AnNajah National University Faculty Of Engineering Civil Engineering


 m. H 2 O.")
 and maximum")
 and maximum")


 Velocity(m/sec) Ductile iron")


 by")
 by using of one")
 by")
 + Cost of two pumps.")


 The cover : (1")


")
")
")


- Slides: 53
An-Najah National University Faculty Of Engineering Civil Engineering Department Graduation Project II Analysis and Redesign of Water network & Design of Wastewater network for Kaferdan village Prepared By : Abdallah Bzoor Kefah Ali Mohammed Abo Abed Supervision of Dr. Anan Jayyousi
Outline: Ø Objectives of the project. Ø Significance of the work Ø Study area Ø Questionnaire analysis Ø Existing water network Ø Redesign of water network Ø Design of wastewater network
Objectives Analyze the existing water network. Redesign Design the water network in the village. a wastewater network.
Significance of the work To supply water at an adequate pressure and flow. To transport sewage through KAFERDAN VILLAGE to sewage treatment plants. To have an economic design as possible for both networks.
Study area
v Area and land use: The present population is 6400 persons. The area is approximately 7330 donum Kaferdan village is a flat land, The ground surface in the village varies from 100 m to 190 m (A. M. S. L).
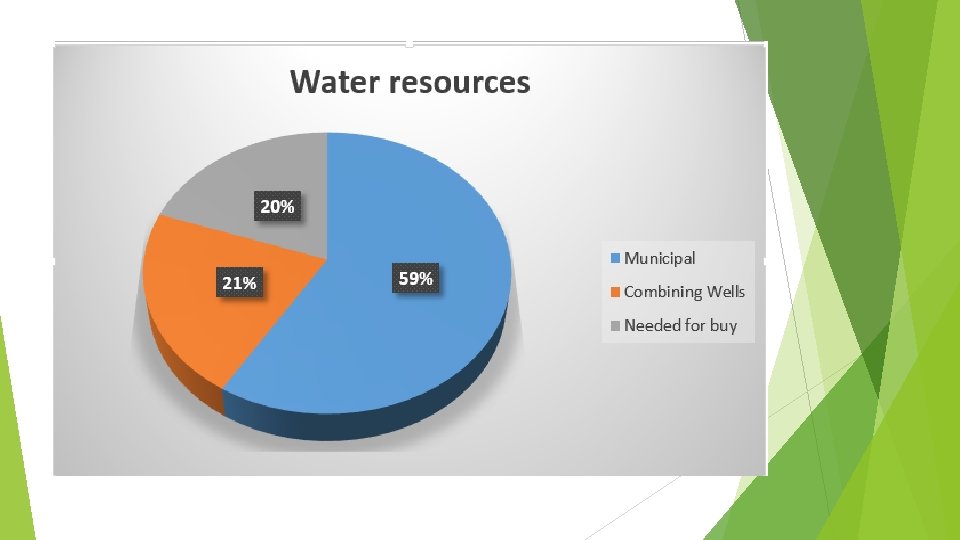
v Data Collection: Contour, Houses, roads, Boundary, aerial photo and amount of consumption water for each consumer, … etc. manhole, conduits, road contour and outfall for the village.
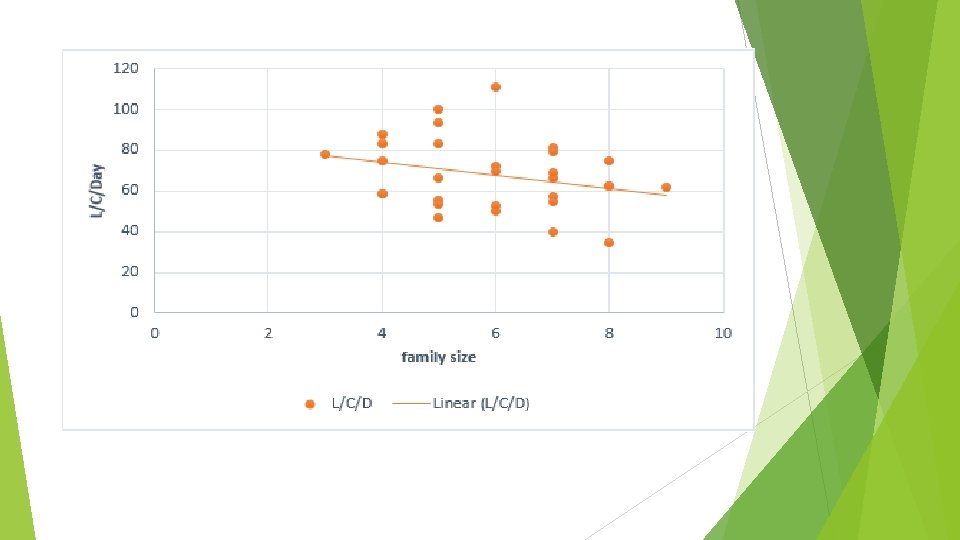
Questionnaire analysis avaerage consumption water Average family size = 5. 9 capita Average consumption = 11. 9 m³ So the water consumption = (11. 9*1000)/(30*5. 9)= 67. 2 L/C/day
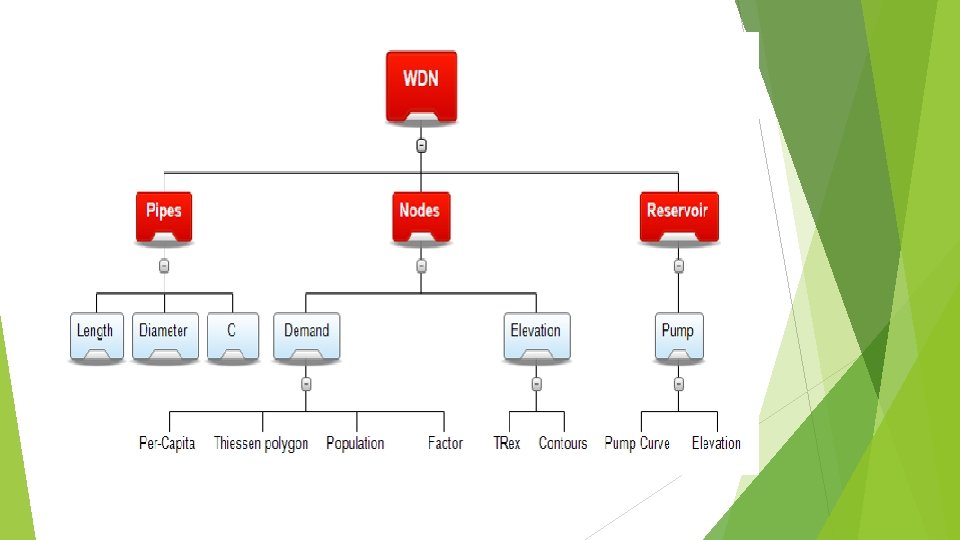
Modeling of WDN
Modeling of WDN
WDN
WDN v Design constraints: Pressure at junction between (20 -100) m. H 2 O. Velocity in pipe (0. 3 -3. 0) m/s.
Result of analysis of WDN Preesure at minimum demand (2: 00 am) and maximum demand (6: 00 am)
Result of analysis of WDN Velocities at minimum demand (2: 00 am) and maximum demand(6: 00 am)
Redesign of WDN
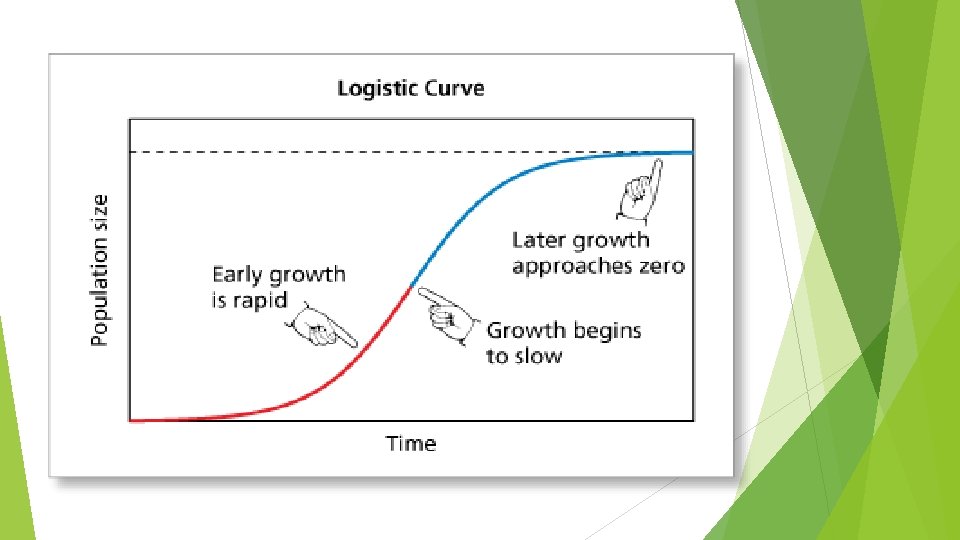
Data of future population
Data of future population
Data of the supply
Model of WDN
WDN
Design Critera Type of pipes / Criterea Pressure(m. H 2 O) Velocity(m/sec) Ductile iron 20 -100 0. 1 - 3
Methodology of Design
Result of Design 1 - Pumps
Result of Design Pw = ɤQH Where : ɤ : Specific weight for water(N/ m³). Q : Total flow rate that input to pump (m³/sec). H : Total head that was added by pump (m). Pw = (9810 N/ m³)*(3852/24*60*60 m³/sec)*(20 m) =8747. 25 watt. Pw = 8. 74725 Kelowatt = Poutput. Pinput = Poutput/µ Where : µ : The efficiency of the pump (-) Pinput = 8. 74725/0. 85 = 10. 29 kelowatt. The power of pump (hp) = 10. 29/0. 75 = 14 hp
Result of Design The below drown illustration the method of installation the two pump in series:
Result of Design 2 - Preesures Pressure at maximum demand (6: 00 am) by using of two pumps Pressure at max flow(6: 00 am) 100 90 80 Pressure( m. H 2 O) 70 60 50 40 30 20 0 50 100 150 200 Pipe number 250 300 350 400
Result of Design Pressure at minimum demand (2: 00 am) by using of one pump Pressure at min flow(2: 00 am) 140 120 100 Pressure (m. H 2 O) 80 60 40 20 0 0 -20 50 100 150 200 Pressure number 250 300 350 400
Result of Design 3 - Velovities Velocity at maximum demand (6: 00 am) by using of two pumps Velocity at max flow (6: 00 am) Velocity(m/sec) 2. 55 2. 05 1. 55 1. 05 0. 55 0. 05 0 50 100 150 200 250 Pipe number 300 350 400 450
Cost of The design Total cost = (Ʃ Ci*Li) + Cost of two pumps. Where : Total cost ($). Ci : The cost of diameter i (inch) per meter ($/m). Li : The length of diameter i (m). In this network was the estimated total cost was 303262 $. Cost of one pump (15 hp) = 14000$ The total cost = 303626+28000 = 331626 $
Design of the wastewater network
Wastewater generation Each person in the town will generate about 80% of water consumption(120 L/c/day). Thus , Avaerage wastewater generation = 0. 8 * 120 * 15159/ 1000 = 1455. 26 m³/day Peak wastewater generation = Pf * Avaearage wastewater generation Where : Pf : Peak factor = 16* {(Population in thousands)^(-1/6)} = 16 * (15159)^(-1/6) = 3. 2 Then , Peak wastewater generation for koferdan town = 3 * 1455. 26 = 4365. 75 m³/day
Design criteria The velocity : (0. 6 – 3 m/sec) The cover : (1 -5 m) The slope : (1 -15%) The distance between manholes are (30 -50 m)
Design constrain
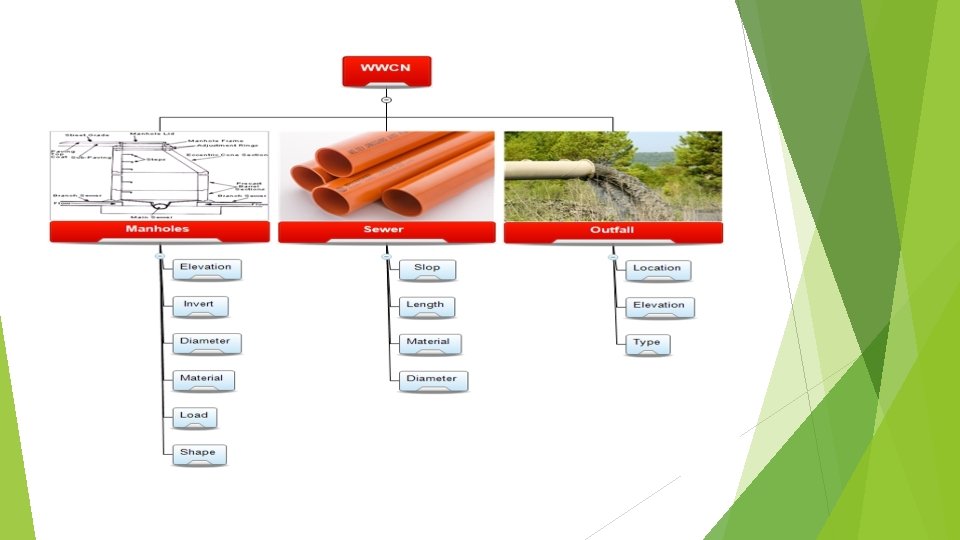
MODELING AND DESIGN
Methodology
Methodology Location & Connecting Manhole Before starting the design we should consider that the manholes must be located at the roads networks wherever there is: 1 - An intersection. 2 - Change in slop. 3 - Change in direction. 4 - Maximum distance of (30 -50) m.
Choosing the PVC conduits
Model of the wastewater network
Loads on manholes By finding the area of catchment of each manhole using Arc. Hydro Tool in GIS we can find the load for each manhole as follows: 15159 capita/7328000 m² = 0. 002 capita/ m² 0. 002* area of each part = number of persons in each part(q˳) Load was produced from each part = (120 L/c/d * q˳* 3 * 0. 8) + (120* q˳* 0. 8 * 0. 2)
Results And Discussion
Velocity (m/s)
Slope (%)
Cover (m)
Profile
The proposed location for Wastewater Treatment Plant Location of WWTP
Conclusions After the end of design process we got the following conclusions: The majority diameter of water pipes are 1. 3, 2, 3, 4, 6 and 8 inch. The water pipe material is ductile iron. The sewer conduit material is PVC because it's easy to site. Most sewer network conduits diameters are 8, 10, 12 inch. Arc. Hydro tools save a lot of time in calculates loads.
Recommendations A periodic maintenance should be done and the damaged parts should be replaced. If possible treatment plant is considered as a feasible project. Suitable space between water pipes and wastewater pipes must be achieved (water pipes must be above wastewater pipes).