Angela Kuo D 145 Presentation Jan 9 2020


 can overcome the issue of")
 • https: //www. youtube. com/watch? v=Ca. Fq 9 cnf. TZI")


 • Ultra-conserved elements (UCEs) are highly conserved regions of genome that")


 383 HAPPY lines Average")


- Slides: 30
Angela Kuo D 145 Presentation Jan, 9, 2020
What is genome mapping? The use of various methods to determine the location of genes and the relative distances between genes on a chromosome. Source : http: //www. yourgenome. org/facts/how-do-you-map-a-genome
Genome mapping is important • • • Aid in assembly after sequencing Understand overall genome structure Compare genomes of different species Identify new genes and disease causing genes Illustrate relationship between genes and regulatory elements Source : https: //www. biostars. org/p/253222/
Classical Linkage Mapping has drawbacks Determines distance between genes through the rate of meiotic recombination Drawbacks • In vivo studies required (meiosis) • Natural meiotic recombination happens not so high • The infrequency of recombination limits the resolution • Require knowledge of gene and traits (hair color, skin color) Source : https: //en. wikipedia. org/wiki/Gene_mapping
HAPPY mapping overcomes the drawbacks Happy : HAPloid equivalents of DNA and Pol. Ymerase chain reaction • Analogous to classical linkage mapping • utilizes in vitro equivalents to model meiotic recombination and division • overcomes the drawbacks of classical linkage mapping and results in a higher resolution map Figure 1
HAPPY mapping protocol Step 1 Step 2 Step PCR for each 3 marker 3. Detect genetic markers & Calculate association (LOD) between markers Human lymphocytes 2. Divide into aliquots~1 haploid equivalent pre tube Sonication or shearing 1. Prepare DNA break randomly Step 4 4. Construct map In vitro method analogous to meiotic recombination Figure 1
Meiosis Recombination HAPPY Segregation Source : https: //www. researchgate. net/figure/Combined-HAPPY-mapping-and-molecular-copy-number-counting-gives-positional-information_fig 2_51081794
Human DMD locus to test HAPPY mapping • The map of the human DMD locus was already known Break DNA randomly Divide into aliquots PCR for 7 markers (D 0, D 3, D 21, D 32, D 45, D 48) of each ~1 haploid aliquot
Run the PCR products on a gel to determine what marks are present in each fragment After whole genome PCR of ~1 haploid aliquots Aliquot # Whole genome DNA amplification can be used to test more markers from the same ~1 haploid sample Positive controls for not closely linked markers Figure 2 Markers that tend to show up together are most likely close in distance
LOD Scores and θ values analyze distance between different markers • LOD= logarithm of the odds of linkage (1 -10) • θ= the probability of breakage between them Table 2 The bigger LOD has greater chance they are linked closely in the genome. The highest value of θ = 1 representing no linkage.
Rank order and relative likelihoods of different marker orders in various fragment sizes. matching the known map! w/ whole genome PCR Table 3
Additional analysis of the effect of fragment sizes on the relationship LOD or θ • Longer fragments demonstrate higher accuracy for greater distances • Shearing can be increased to obtain higher resolution between small distances • Over fragmentation destroys linkages by sonication • Amplifying whole genome before performing PCR of makers gives similar results Known distance between markers Figure 3
HAPPY mapping gives accurate genome map Known map ~1. 75 Mbp ~2. 75 Mbp ~1. 75 Mbp w/ whole genome PCR Figure 4 Notes: • Hard to distinguish between very close markers (D 31 and D 32) • Adding in whole genome PCR step gives similar map and better resolution of close markers
Summary • Dear an Cook developed a new method, analogous to classical linkage mapping, that utilizes in vitro equivalents to meiotic recombination and division • It doesn’t require in vivo studies and bypasses the issue of non-random DNA fragmentation • Can be done in almost any lab (you can do this) • HAPPY mapping is able to generate reliable genetic maps • This method gives higher resolution than classical linkage mapping • The method can be fine-tuned to produce different fragment sizes to investigate different levels of resolution Cons: 1. it requires that you know something about the sequence (because you have to design the PCR primers) 2. Whole genome amplification is limiting in this paper
HAPPY mapping hasn’t been widely used “Up to date, only 8 maps have been generated using the HAPPY approach and all of them were contributed by the inventor’s group” Why? Lacks the necessary amplification of whole genome DNA to provide enough material to detect a large number of markers
MDA improve the HAPPY mapping Multiple Displacement Amplification (MDA) can overcome the issue of lack of starting DNA material. • Non-sequence-specific method to amplify minute amounts of DNA • It can yield 20 -30 µg of amplified DNA starting with as few as 1 -10 copies of DNA
Multiple Displacement Amplification (MDA) • https: //www. youtube. com/watch? v=Ca. Fq 9 cnf. TZI
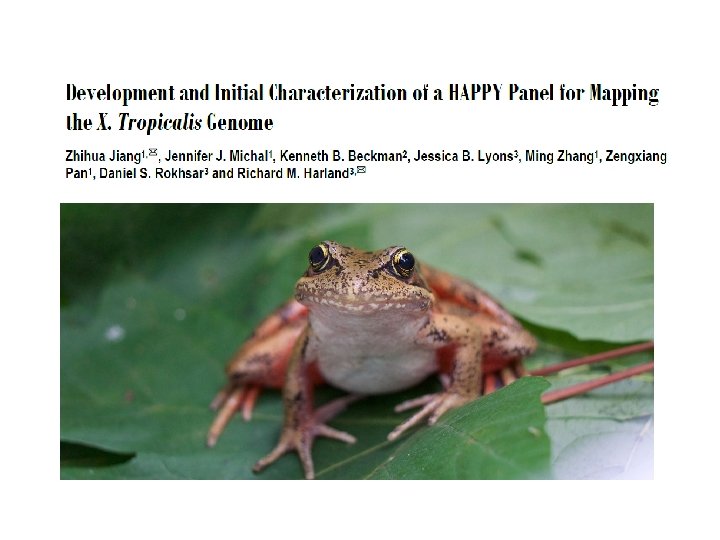
Using new HAPPY mapping to map the Xenopus tropicalis genome Why frogs? • The study of amphibian embryogenesis provides important insight into the mechanisms underlying vertebrate development • The genome has been sequenced, but there are many gaps, which has halted the assembly • The authors suggest using HAPPY approach for construction of whole genome maps to aid in a high quality long-range assembly of the X. tropicalis genome Tropical clawed frog
Mapping the Xenopus tropicalis genome using the HAPPY approach HAPPY mapping method EXCEPT… • MDA to amplify whole genome DNA • Markers are Ultra Conserved Elements (UCE’s) in relation to the human genome Source : https: //www. ijbs. com/v 05 p 0298. htm
Ultra-conserved elements (UCEs) • Ultra-conserved elements (UCEs) are highly conserved regions of genome that are identical in at least two different species • Show evolutionary association between species Source : https: //www. cell. com/cell-reports/fulltext/S 2211 -1247(18)30941 -0? inner. Tabgraphical_S 2211124718309410=
UCEs as map markers • Compared frog genome to human genome and gathered conserved sequences at least 25 bp long with 100% identity • Narrowed list to 21 UCEs markers on Chromosome 1 Table 1
Effects of fragment sizes on MDA yields and marker retention rate MDA amplifies DNA • Retention rate was calculated as the percentage of UCE markers per line • Fragment size impacts retention rate Figure 1
Analyzing the new HAPPY protocol Whole genome samples (positive controls) 383 HAPPY lines Average retention rate = 21. 7% Figure 2
HAPPY map is superior to the current Frog genome assembly Current Frog genome assembly Human chromosome 1 Figure 3 Their HAPPY map
Summary • Using MDA improved the conventional HAPPY method • They developed the first HAPPY panel of Xenopus tropicalis genome using UCE’s • Established a pilot HAPPY map for Xenopus tropicalis • They suggest to replace the PCR steps with next generation sequencing to further improve the pipeline for whole genome sequencing, mapping, and assembly
Additional Reading
4 Key Takeways • Happy Mapping is a new way to map genome not require a lot of knowledge and skills • Utilizes in vitro method to model meiotic recombination and division • It provides higher resolution and reliable map • Using MDA and UCE markers improve the Happy Mapping
Grading Criteria • Introduction/Background: Provide the necessary information to introduce the topic and help explain the purpose of the paper • Significance: the hypothesis/objective and why this paper was important. • Figures/Results: Understand what the figures are saying and how the data was generated (methods!). Also, discuss how they are contributing to the hypothesis • Conclusions: list the main findings. Don’t be afraid to be critical! Providing additional reading is appreciated • Presentation skills: How well you present (speaking loud enough, ability to answer questions, eye contact). Basically, does it seem like you know what you are talking about • Slide appearance: make sure your slides are organized, not too crowded, large enough text, no obnoxious animations • Each presenter will be graded individually
Presentation schedule signups • Link is on Canvas • Sign up by Jan 14 at 12 pm • Open spots will go up for extra credit https: //docs. google. com/spreadsheets/d/1 JSe. NGPd. Jm 9 lzm. Oeq. E_8 MAADOXZec 6 v. Ky. PNEHF 0 w. Gtg/edit? fbclid=Iw. AR 3 va gciiktf. Lty. WDU 8 Mteom. FGXK 4 QLf 0 jxis. Kycs. Fx. KLl. Su 0 Fy. Bla 0 KIYU#gid=0