An Introduction to Quality Improvement Paul Harriman 11

 give you an overview of the basics")


 combined with a ‘method’ (an approach or")


")


 52")


")
")
")
")
- Slides: 59
An Introduction to Quality Improvement Paul Harriman 11: 00 – 12: 00
Aims / Objective • To (very quickly!) give you an overview of the basics of Quality Improvement… • To work out what you don’t know so that we can work out what needs delivering in future sessions
3
4
Will, ideas and execution 5
What is Quality Improvement?
Quality: The IOM’s Six Aims High Quality care is care that is: • Safe – no needless deaths and harm • Effective – no needless pain or suffering • Patient-Centered – no helplessness in those served or serving • Timely – no unwanted waiting • Efficient – no waste • Equitable – for all
Improvement The combination of a ‘change’ (improvement) combined with a ‘method’ (an approach or specific tools) to attain a superior outcome
Quality Improvement Knowledge Appreciation of a System PDSA Cycles and run charts Variation Psychology
Quality Improvement Knowledge Appreciation of a System PDSA Cycles and run charts Variation Psychology
“Every system is perfectly designed to get the results it gets. ” Paul B. Batalden, MD Co-Founder The Institute for Healthcare Improvement Founding Director, Center for Leadership and Improvement, The Dartmouth Institute for Health Policy and Clinical Practice
What is a system? • a collection of processes • working together under a common set of instructions • to produce a defined output
What is a process? • A system of steps • Handling a piece or work • Has an input and an output • Has a supplier and a customer • SIPOC
Elements of a Process Staff Patients / Customers Outputs Inputs Sequence of steps 14 Patient Process passing through a Dialysis Unit
Process and value stream mapping • Later 15
Quality Improvement Knowledge Appreciation of a System PDSA Cycles and run charts Variation Psychology
Variation • A major issue for any system If I had to reduce my message for [management] to just a few words, I’d say it all had to do with reducing variation. ” W. Edwards Deming • Has 2 different types - Common cause - Special cause • Can be planned or unplanned
Two Types of Variation Common Cause Special Cause Variation caused by chance causes, by random variation in the system, resulting from many small factors. Variation caused by special circumstances or assignable cause not inherent to the system. Example: Variation in work pressures due to staffing levels, patient transport delays, extended dialysis times Example: Variation in work pressures due to a cardiac arrest, power failure, fire alarm Statistically significant (not good or bad) 18 18
Run Charts vs. SPC Charts Run Chart • Simple SPC • More Powerful • Easy to create in Excel or • Control lines show the on paper degree of variation • Less Sensitive • Need software • Only need 12 -15 data • Need 25+ data points 19
Quality Improvement Knowledge Appreciation of a System PDSA Cycles and run charts Variation Psychology
Maslow’s Hierarchy of Needs 21
22
Ownership not Buy-In ‘If you want to make true and lasting change, ask the people who do the work how to go about it’ Daren Anderson, MD VP/Chief Quality Officer Community Health Center, Inc.
Enable Mastery Allow autonomy Create sense of purpose How to motivate 24
Sustained Improvement Requires behaviour change Conceptual Model - Susan Michie & Martin Wildman (Adapted) necessity n’t Wo Habit formation Maintenance Motivation concern Routines Capability Opportunity Can’t 25 25
‘Improvement in health care is 20% technical and 80% human’ Marjorie Godfrey, MS, RN, Ph. D The Dartmouth Institute for Health Policy and Clinical Practice
Good change?
The other side of change………………
Motivation, Performance Change Curve Time 30 Elizabeth Kubler-Ross, 1969
The Everett Rogers curve 31
Quality Improvement Knowledge Appreciation of a System PDSA Cycles and run charts Variation Psychology
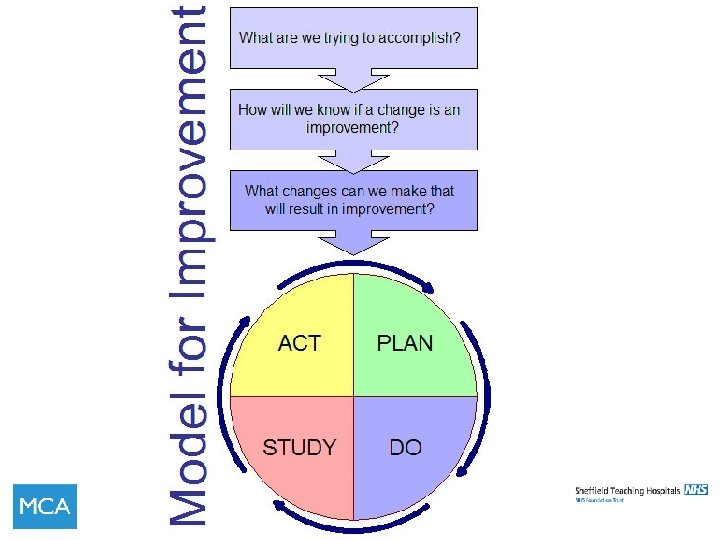
Why Measure? If you don’t measure it how will you know that the change is an improvement? How will you know if what you are observing is not due to chance? 34 34
The Three Faces of Measurement Aspect Improvement Assurance Research Improvement of care (optimise application of knowledge) Comparison, choice, reassurance, spur for change Generate new knowledge Test observable No test, evaluate current performance Test blinded or controlled Accept consistent bias Measure and adjust to reduce bias Design to eliminate bias “Just enough” data, small sequential samples Obtain 100% of available, relevant data “Just in case” data • Testing Strategy Sequential tests No tests One large test • Determining if a change is an improvement Time Series Data (Run charts or Shewhart control charts) No change focus Hypothesis, statistical tests (t-test, F-test, chi square), p-values Aim Methods: • Test Observability • Bias • Sample Size
What is our global aim Uptake of shared hd care New patients in Hospital main unit Out patient department Ongoing process Patients to be expected to do certain tasks and be encouraged with choice of others. Percentage of patients doing 5 or more to increase. Patients will not be dependant unless they are unwell. We do not wish to waste any opportunity to engage 36
Key Components of a Specific Aim • Ambitious • Measureable • Operationally specific • Time-limited How Much? By When?
Measurement over time • Run charts - Simple, efficient and powerful - Plot over time + median - Rules for identifying unexpected runs - Use for WIP (queues, bed occupancy) • Statistical process control charts (SPC) - Derived from manufacturing - Plot over time; mean and control limits - Data needs to be independent - Needs 25 data points in a stable system to start
Quality Improvement A structure for Improvement and some tools
Quality Improvement The structure SDSA ‘Standardise’ Treatment - PDSA Diagnosis - Change Ideas Assessment
Continuous Improvements Change Ideas Global Aim Build a Big Room Themes ‘Post-it Frenzy’ Change Concepts Benchmarking and visits Process/Value Stream Map Fishbone Driver Diagram Brainstorming Specific aim Define measures Spaghetti Diagrams Selection criteria & Multivoting Pre. Phase Coached weekly meetings Patient stories Standardise Change idea A P S D AP SD System data Reflective learning
Big Room Concepts
Anatomy of a Driver Diagram Primary Drivers Secondary Drivers A 1 B Aim 2 Outcome ‘Multiple influences’ C 3 ‘Cause the outcome’ 43 D
A Non Medical Example Primary Drivers Secondary Drivers Shop at cheaper petrol station Reduce fuel price per gallon Walk to work Aim Decrease fuel costs Reduce miles driven Increase Efficiency Decrease use of rapid acceleration Inappropriate use of gears Decrease use of rapid breaking 44
Linking it all together – Rapid cycle improvement Global Aim – Increase Shared HD care in centre based HD patients PDSA 3 PDSA 2 Specific aim - patients to learn and complete 5 or more out of 14 tasks Specific aim - increase home HD and in centre independent dialysis by 4% within Participating centres 45 Change ideas Measures PDSA 1 PDSA 6 PDSA 5 PDSA 4 Change ideas Measures
Linking measures to Drivers Global Aim Specific Aim We aim to improve the movement of patients across boundaries within the stroke pathway We will improve the quality of patient information in the Transfer of Care document so that it contains 100% of the information required by colleagues at the next step in the Stroke pathway” We plan to achieve this by 1 st September 2016 46 PDSA 1 PDSA 2 PDSA 3
What is stakeholder analysis? • Technique to identify, engage and communicate with key stakeholders effectively • Stakeholder: anyone impacted upon, or with an interest or concern in the service. • Use SIPOC to help identify them
Lean Wastes • Transportation • Inventory • Motion • Waste • Over-production • Over-procesing • Defects • Skills
5 Whys – Getting to the root cause The patient stayed in hospital 111 days – Why? Because they developed hospital acquired pneumonia – Why? Because they were immobile – Why? Because they fell on the ward – Why? Because they had been waiting for discharge – Why? Because there is a lack of home care provision The patient stopped wanting to learn how to programme his machine Because he was getting different information from lots of staff Because the staff were teaching in different ways Because the staff had not asked him what he had already been taught Because the staff had not all been trained to communicate in this way Because there was no standard training for staff
5 S
Fishbone Diagram Driver Sub-category driver Driver Major driver Result /effect Driver
Fishbone (Cause and Effect Diagram) 52
Spaghetti diagrams
PDSA Cycle: Deciding on Scale of Test Engagement, Readiness to Change Current Situation Confidence Low Degree of Belief that change idea will lead to Improvement High Degree of Belief that change idea will lead to Improvement Source - The Improvement Guide Resistant (No commitment) Indifferent (some commitment) Ready (strong commitment)
PDSA Cycle: Deciding on Scale of Test Engagement, Readiness to Change Current Situation Cost of failure large Low Degree of Belief that change idea will lead to Improvement Confidence Cost of failure small Cost of failure large High Degree of Belief that change idea will lead to Improvement Cost of failure small Source - The Improvement Guide Resistant (No commitment) Indifferent (some commitment) Ready (strong commitment)
PDSA Cycle: Deciding on Scale of Test Engagement, Readiness to Change Resistant (No commitment) Indifferent (some commitment) Ready (strong commitment) Cost of failure large Very Small Scale Test Cost of failure small Very Small Scale Test Cost of failure large Very Small Scale Test Current Situation Confidence Low Degree of Belief that change idea will lead to Improvement High Degree of Belief that change idea will lead to Improvement Cost of failure small Source - The Improvement Guide
PDSA Cycle: Deciding on Scale of Test Engagement, Readiness to Change Resistant (No commitment) Indifferent (some commitment) Ready (strong commitment) Cost of failure large Very Small Scale Test Cost of failure small Very Small Scale Test Cost of failure large Very Small Scale Test Cost of failure small Scale Test Current Situation Confidence Low Degree of Belief that change idea will lead to Improvement High Degree of Belief that change idea will lead to Improvement Source - The Improvement Guide
PDSA Cycle: Deciding on Scale of Test Engagement, Readiness to Change Resistant (No commitment) Indifferent (some commitment) Ready (strong commitment) Cost of failure large Very Small Scale Test Cost of failure small Very Small Scale Test Cost of failure large Very Small Scale Test Large Scale Test Cost of failure small Scale Test Large Scale Test Current Situation Confidence Low Degree of Belief that change idea will lead to Improvement High Degree of Belief that change idea will lead to Improvement Source - The Improvement Guide
PDSA Cycle: Deciding on Scale of Test Engagement, Readiness to Change Resistant (No commitment) Indifferent (some commitment) Ready (strong commitment) Cost of failure large Very Small Scale Test Cost of failure small Very Small Scale Test Cost of failure large Very Small Scale Test Large Scale Test Cost of failure small Scale Test Large Scale Test Implement Current Situation Confidence Low Degree of Belief that change idea will lead to Improvement High Degree of Belief that change idea will lead to Improvement Source - The Improvement Guide