Quality management COTINUOUS QUALITY IMPROVEMENT Quality and Patient


: is an organizational process in which staff identify, plan, and")

 can be defined as a set of policies, processes")


 is a management strategy aimed at embedding awareness")
 TQM is composed of three paradigms: v Total: Involving")


 created the Quality Management")


: Identifies many possible causes for")


 : Includes not performing an activity that")
- Slides: 48
Quality management COTINUOUS QUALITY IMPROVEMENT
Quality and Patient Safety
Top priorities l l l Quality and Patient Safety. Commitment to provide exceptional patient care and customer service throughout all our facilities. To ensure expert medical care in the safest environment possible, in both an inpatient and outpatient setting.
Quality Management v v l Quality : Degree to which a set of inherent characteristic fulfills requirements. Quality : the perception of the degree to which the product or service meets the customer's expectations. Quality Management: Managing the continuous improvement of service delivery processes and outcomes through data-driven strategies and empowered staff to exceed customer expectations.
Quality management l Quality management is a method for ensuring that all the activities necessary to design, develop and implement a product or service are effective and efficient with respect to the system and its performance.
l l The heart of analysis is customer needs. Quality is not the absence of errors as defined by the supplier, but the presence of value as defined by the customer. Customer satisfaction is when customer needs and expectations are met or exceeded.
Ø Basics : Strategize For Customer Loyalty! Power Up Your Organization for Maximum Retention Ø Handling Customer Complaints: Best Practices in Resolving Customer Complaints Consumers expect value for their money and count on the existence of services when needed. Ø
Ø Ø patients are demanding to be informed partners in decisions regarding their health patients now complain, demand, report and sue and have realized that the quality of nursing care is an important factor in patient outcomes.
l l Responding to Angry Customers: Understanding Hostile Customers. Give An Angry Customer Even More Than They Asked For. Measuring Customer Satisfaction: Using satisfaction surveys to achieve a competitive advantage When Should Changes Be Made to a Customer Satisfaction Tracking Questionnaire
Continuous Quality Improvement (CQI): is an organizational process in which staff identify, plan, and implement ongoing improvements in service delivery. v CQI provides a vital way to assess and monitor the delivery of services to ensure that they are consistent with an organization’s best practice clinical principles. v
l The primary goal of the Quality Improvement program is the ongoing improvement of the delivery, quality, efficiency, and outcome of patient care and services.
l Quality Management System (QMS) can be defined as a set of policies, processes and procedures required for planning and execution (production / development / service) in the core business area of an organization.
Continuous Improvement Methods l Widely used methods of continuous improvement such as, Six Sigma and Total Quality Management. They emphasize employee involvement and teamwork; measuring and systematizing processes; and reducing variation, defects and cycle times.
l Six Sigma seeks to improve the quality output of process by identifying and removing the causes of defects (errors) and minimizing variability in manufacturing and business processes
l l Total Quality Management (TQM) is a management strategy aimed at embedding awareness of quality in all organizational processes. TQM has been widely used in manufacturing, education, government, and service industries. Total Quality provides an umbrella under which everyone in the organization can strive and create customer satisfaction at continually lower real costs.
Total Quality Management (TQM ) TQM is composed of three paradigms: v Total: Involving the entire organization, supply chain, and/or product life cycle v Quality: With its usual Definitions, with all its complexities v Management: The system of managing with steps like Plan, Organize, Control, Lead, Staff, l
l Six Sigma is a set of practices originally developed by Motorola to systematically improve processes by eliminating defects. A defect is defined as nonconformity of a product or service to its specifications.
l The term "Six Sigma" refers to the ability of highly capable processes to produce output within specification. In particular, processes that operate with six sigma quality produce at defect levels below 3. 4 defects per (one) million opportunities (DPMO). Six Sigma's implicit goal is to improve all processes to that level of quality or better.
Quality Improvement Heroes: l W. Edwards Deming is best known for his management philosophy establishing quality, productivity, and competitive position. He has formulated 14 points of attention for managers, some of these points are more appropriate for service management.
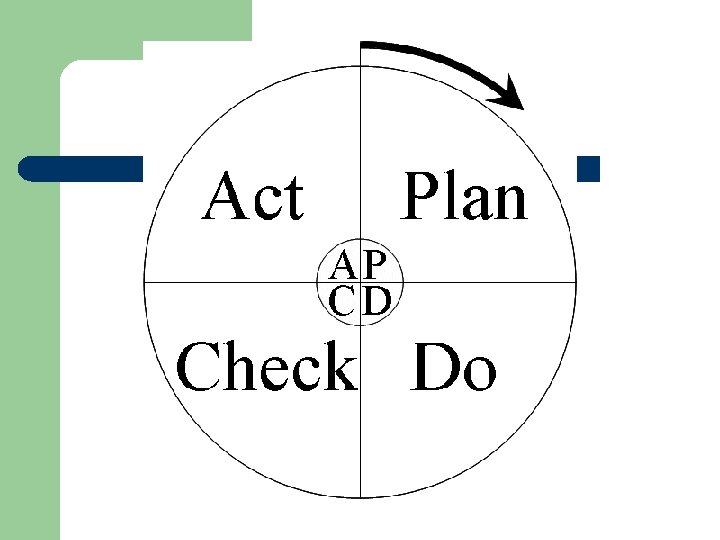
l l l Break down barriers between departments; Management should learn their responsibilities, and take on leadership Improve constantly Institute a program of education and selfimprovement. The following diagram is the (PDCA) cycle for quality improvements, made popular by Deming.
l l l FOCUS on a particular issue. Find a process to improve Organize to improve a process Clarify what is known Understand variation Select a process improvement
l l l The philosophy is to keep improving the quality of an organization. It is defined by four keys: Plan: Design or revise business process components to improve results Do: Implement the plan and measure its performance Check: Assess the measurements and report the results to decision makers Act: Decide on changes needed to improve the process
l l Quality Standards The International Organization for Standardization (ISO) created the Quality Management System (QMS) standards in 1987. These were the series of standards comprising ISO 9001: 1987, ISO 9002: 1987 and ISO 9003: 1987; which were applicable in different types of industries, based on the type of activity: designing, production or service delivery.
History l l the concern for high quality health care dates back to the 5 th Century BC, when Hippocrates established a code of medical ethics, obliging future doctors to swear "never to do harm to anyone". The history of quality assurance activities in nursing can be traced back to Florence Nightingale's attempts to improve the conditions of care Her standards to assess the care of the soldiers has been established as one of the first documented efforts of quality improvement work as a priority for nurses throughout the world (Kahn, 987: 21).
Improving Quality through Nursing l l the role of nursing in providing quality health care. the impending gap between the need for nurses and the supply , the various ways that hospitals and other health organizations are reducing nurse staffing and increasing nurse workloads.
Improving Quality through Nursing l l The quality of nursing is central to preventing errors in hospitals and providing high-quality care. It was have demonstrated an association between nurses’ workload and the number of deaths in hospitals. It was have also shown an association between nurses’ education and the number of deaths. highly dissatisfied nurses with their working conditions , lack of autonomy, turnover and burnout. Studies have suggested that when nurses have more control over their work, care improves and hospitals function better.
FACT l Hospitals with low nurse staffing levels tend to have higher rates of poor patient outcomes such as pneumonia, shock, cardiac arrest, and urinary tract infections, according to research funded by the Agency for Healthcare Research and Quality (AHRQ) and others.
Functions of the quality improvement department to improve nursing quality l l Develop mechanisms for using evidence-based practice to improve quality of care Support nursing staff involvement in collaborative quality initiatives that improve organizational performance and patient outcomes Assist nursing staff to interpret and use data from internal and external sources to improve care or resolve identified problems Promote safe practices by infusing a culture of safety for both patients and staff.
l l Promote the use of an institutional set of core outcome indicators to monitor and improve care Facilitate performance improvement efforts of department and interdisciplinary teams Coordinate or conduct interdisciplinary performance improvements that impact patient care delivery from multiple services Provide education and consultation to internal and external constituents regarding quality and outcomes management activities
l l Promote a scientific approach to problemsolving in management and delivery of patient care services Promote discussion and exchange of information regarding status and progress of evidence-based practice, and process improvement projects.
scope l l l The scope of patient care services provided by the department includes: Assessment of patients Planning, implementing, evaluating the nursing plan of care Administration of medications Administration of treatments and therapies Patient and family education
Structure, Process and Outcome l l l Structure is the evaluation of the organization of the institution delivering care; the conditions under which care is provided and its impact on quality, i. e. buildings, budget and equipment. Process concerns the evaluation of the performance of health professionals in the management of patients outcome is the evaluation of the end result, observable changes in the health status of the patient.
Quality Tools l Cause Analysis Tools Tips and tools for the first step to improvement identifying the cause of a problem or situation. Evaluation and Decision-Making Tools Making informed decisions and choosing the best options with a simple, objective rating system, and determining the success of a project. Process Analysis Tools How to identify and eliminate unnecessary process steps to increase efficiency, reduce timelines and cut costs.
Quality Tools You Can Use l l l Flowcharting Fishbone diagrams Pareto charts SMART goals Brainstorming Benchmarking Interviews Nominal group process Force-field analysis Multi-voting Cost-benefit analysis l l l l Observation Written standards and procedures Rewards Teamwork Questionnaires Charts/graphs Time-run chart
l Seven Basic Quality Tools These seven tools get to the heart of implementing quality principles. These are the most fundamental quality control (QC) tools. They were first emphasized by Kaoru Ishikawa, professor of engineering at Tokyo University and the father of “quality circles. ”
1. Cause-and-effect diagram (also called Ishikawa or fishbone chart): Identifies many possible causes for an effect or problem and sorts ideas into useful categories.
l Check sheet: A structured, prepared form for collecting and analyzing data; a generic tool that can be adapted for a wide variety of purposes.
Control Chart: Out-of-Control Signals l l Control charts: they are also called: statistical process control. They are: Graphs used to study how a process changes over time.
l Histogram: The most commonly used graph for showing frequency distributions, or how often each different value in a set of data occurs.
l Pareto chart: Shows on a bar graph which factors are more significant.
l l Pareto chart is a bar that displays categories of data in descending order of frequency from the left to the right. When analyzing data about the frequency of problems or causes in a process. There are many problems or causes Communicating with others about your data.
l Scatter diagram: Graphs pairs of numerical data, one variable on each axis, to look for a relationship. l Is there any relationship between product purity (percent purity) and the amount of iron
Stratification: technique that separates data gathered from a variety of sources so that patterns can be seen.
Risk management l l Risk management is the human activity which integrates recognition of risk, risk assessment, developing strategies to manage it, and preventing of risk using managerial resources. The strategies include transferring the risk to another party, avoiding the risk, reducing the negative effect of the risk, and accepting some or all of the consequences of a particular risk
Steps in the risk management process l l Identification of risk in a selected domain of interest 1. Planning the remainder of the process. 2. Mapping out the following: the social scope of risk management, the identity and objectives of stakeholders, and the basis upon which risks will be evaluated, constraints. .
l l l 3. Defining a framework for the activity and an agenda for identification. 4. Developing an analysis of risks involved in the process. 5. Mitigation of risks using available technological, human and organizational resources
Potential risk treatments l l Avoidance (elimination) : Includes not performing an activity that could carry risk Reduction ( mitigation): Involves methods that reduce the severity of the loss Retention : Involves accepting the loss when it occurs. Self insurance Transfer ( buying insurance) : Means causing another party to accept the risk, typically by contract