Weather Radar Data Doppler Spectral Moments Reflectivity factor

 Widespread spatial distribution of scatterers (range ambiguities) *2) Large")
 and short")
")
")
")

 relations ¶ Error sources ¶ Procedure on the WSR-88")

 Radar calibration 2) Height of measurements *3) Attenuation 4)")
, and R(disdrometer) Log(N) Sep 11, 1999")
 DSD’s, R(Z), and R(disrometer)")


|, , LDR, xv,")
 = 52 KDP 0. 96 ZDR-0. 447 - is least")
 and R(KDP, ZDR) vs Rain Gauge")

-R(KDPZDR) R(gauges)-R(Z) Area Mean Rain Rate and Bias R(gauges)-R(radar)")


")


 • Overcomes the effects")


 for Snow and Ice Water Content Snow fall rate: Z(mm 6 m-3) =75")


- Slides: 48
Weather Radar Data õDoppler Spectral Moments õReflectivity factor Z õMean Velocity v õSpectrum width v õPolarimetric Variables õDifferential Reflectivity ZDR õSpecific Differential Phase õCorrelation Coefficient hv õLinear Depolarization Ratio LDR
Contributors to Measurement Errors *1) Widespread spatial distribution of scatterers (range ambiguities) *2) Large velocity distribution (velocity ambiguities) 3) Antenna sidelobes 4) Antenna motion *5) Ground clutter (regular and anomalous propagation) *6) Non meteorological scatterers (birds, etc. ) *7) Finite dwell time 8) Receiver noise *9) Radar calibration *--- these can be somewhat mitigated
Mitigation of Range Ambiguities Uniform PRTs Alternate batches of long (for Z) and short (for velocity) PRTS. Long PRTs (first PPI scan) for reflectivity ra>460 km; Short PRTs (second PPI scan) for velocity, ra <200 km; typically 150 km El = 19. 5 o 7 Scans 5 Scans = 5. 25 = 4. 3 = 2. 4 = 1. 45 4 Scans = 0. 5
Reflectivity Field of Widespread Showers (Data displayed to 460 km)
Velocity Field: Widespread Showers (5 d. B overlaid threshold; data displayed to 230 km)
Spectrum Width Field: Widespread Showers (20 d. B threshold)
Echoes from Birds leaving a Roost; Spectrum Width Field
Measurements of Rain ¶ R(Z) relations ¶ Error sources ¶ Procedure on the WSR-88 D
Reflectivity Factor Rainfall Rate Relations Marshall-Palmer: Z = 200 R 1. 6 Z(mm 6 m-3); R(mm h-1) For WSR-88 D: Z = 300 R 1. 4 - convective rain Z = 200 R 1. 2 - tropical rain
Rain Rate Error Sources *1) Radar calibration 2) Height of measurements *3) Attenuation 4) Incomplete beam filling *5) Evaporation *6) Beam blockage 7) Gradients of rain rate 8) Vertical air motions *9) Variability in DSD
DSDs, R(Z), and R(disdrometer) Log(N) Sep 11, 1999
Dec 3, 1999 Log(N) DSD’s, R(Z), and R(disrometer)
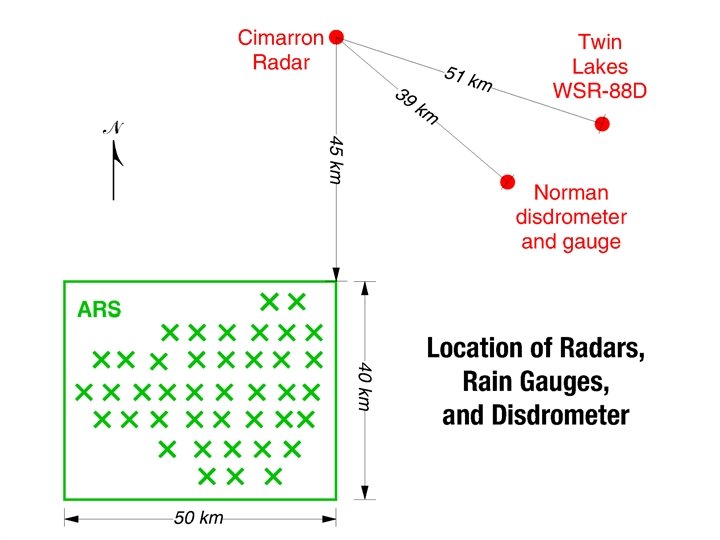
Locations of Z Data used in the WSR-88 D for Rain Measurement
Applications of Polarization ♪ ♪ Polarimetric Variables Measurements of Rain Measurements of Snow Classification of Precipitation
Polarimetric Variables ÝQuantitative - Zh, ZDR, KDP ÝQualitative - | hv(0)|, , LDR, xv, hv ÝAre not independent ÝAre related to precipitation parameters ÝRelations among hydrometeor parameters allow retrieval of bulk precipitation properties and amounts
Rainfall Relation R(KDP, ZDR) = 52 KDP 0. 96 ZDR-0. 447 - is least sensitive to the variation of the median drop diameter Do - is valid for a 11 cm wavelength
Scatergrams: R(Z) and R(KDP, ZDR) vs Rain Gauge
Sensitivity to Hail
R(gauges)-R(KDPZDR) R(gauges)-R(Z) Area Mean Rain Rate and Bias R(gauges)-R(radar)
Fundamental Problems in Remote Sensing of Precipitation ♥ Classification - what is where? ♥ Quantification - what is the amount?
Weighting Functions
Partitions in the Zh, ZDR Space into Regions of Hydrometeor Types
Weighting Function for Moderate Rain WMR(Zh, ZDR)
Scores for hydrometeor classes Ai = multiplicative factor 1 Wj = weighting function of two variables assigned to the class j Yi = a variable other than reflectivity (T, ZDR, KDP, hv, LDR) j = hydrometeor class, one the following: light rain, moderate rain, rain with large drops, rain/hail mixture, small hail, dry snow, wet snow, horizontal crystals, vertical crystals, other Class j for which Sj is a maximum is chosen as the correct one
Florida
Florida
Florida
Florida
Florida
Fields of classified Hydrometeors - Florida
Fields of classified Hydrometeor - Florida
Fields of classified Hydrometeors - Florida
Suggestions ¯Data quality - develop acceptance tests ¯Anomalous Propagation - consider “fuzzy logic” scheme ¯Classify precipitation into type (snow, hail, graupel, rain, bright band) even if only Z is available ¯Calibrate the radar (post operationally, use data, gauges, . . anything)
Specific Differential Phase at short wavelengths (3 and 5 cm) • Overcomes the effects of attenuation • Is more sensitive to rain rate • Is influenced by resonant scattering from large drops
Suggestions for Polarimetric measurements at =3 and 5 cm Develop a classification scheme Develop a R(KDP, ZDR) or other polarimetric relation to estimate rain Correct Z for attenuation and ZDR for differential attenuation (use DP) Use KDP to calibrate Z
Radar Echo Classifier • • Uses “fuzzy logic” technique Base data Z, V, W used Derived fields (“features”) are calculated Weighting functions are applied to the feature fields to create “interest” fields • Interest fields are weighted and summed • Threshold applied, producing final algorithm output
AP Detection Algorithm • Features derived from base data are: – Median radial velocity – Standard deviation of radial velocity – Median spectrum width – “Texture” of the reflectivity – Reflectivity variables “spin” and “sign” • Similar to texture • Computed over a local area
Investigate data “features” • Feature distributions Clutter mean V Clutter texture Z Weather mean V Weather texture Z – AP Clutter – Precipitation • Best features have good separation between echo types
AP Weighting Functions Median Radial Velocity Median Spectrum Width “Texture” of Reflectivity Standard Deviation of Radial Velocity 1 F) Spin “Reflectivity 0 0 100 50 1 0 Spin” G) Sign “Reflectivity Sign” -10 -0. 6 0 0. 6 10
Field of Weights for AP Clutter Weighting functions are applied to the feature field to create an “interest” field AP Clutter Values scaled between 0 -1 For median velocity field, the weighting function is: 1 0 -2. 3 0 2. 3 Interest Field Radial Velocity +3 m/s
Example of APDA using S-Pol data from STEPS Polarimetric truth field given by the Particle Identification (PID) output Reflectivity Radial Velocity PID APDA is thresholded at 0. 5 Good agreement between PID clutter and APDA Clutter Rain 20 June 2000, 0234 UTC 0. 5 degree elevation
Storm-Scale Prediction • Sample 4 -hour forecast from the Center for Analysis and Prediction of Storms’ Advanced Regional Prediction System (ARPS) – a full-physics mesoscale prediction system • For the Fort Worth forecast – 4 -hour prediction – 3 km grid resolution – Model initial state included assimilation of • WSR-88 D reflectivity and radial velocity data • Surface and upper-air data • Satellite and wind profiler data
7 pm 8 pm Forecast w/Radar 6 pm 2 hr 3 hr 4 hr
7 pm 8 pm Fcst w/o Radar 6 pm 2 hr 3 hr 4 hr
R(Z) for Snow and Ice Water Content Snow fall rate: Z(mm 6 m-3) =75 R 2 ; R in mm h-1 of water Ice Water Content: IWC(gr m-3)= 0. 446 (m)KDP(deg km-1)/(1 -Zv/Zh)
Vertical Cross Sections Z ZDR KDP hv
In Situ and Pol Measurements T-28 aircraft