CPSC 7373 Artificial Intelligence Lecture 7 Unsupervised Learning

- Slides: 54
CPSC 7373: Artificial Intelligence Lecture 7: Unsupervised Learning Jiang Bian, Fall 2014 University of Arkansas for Medical Sciences University of Arkansas at Little Rock
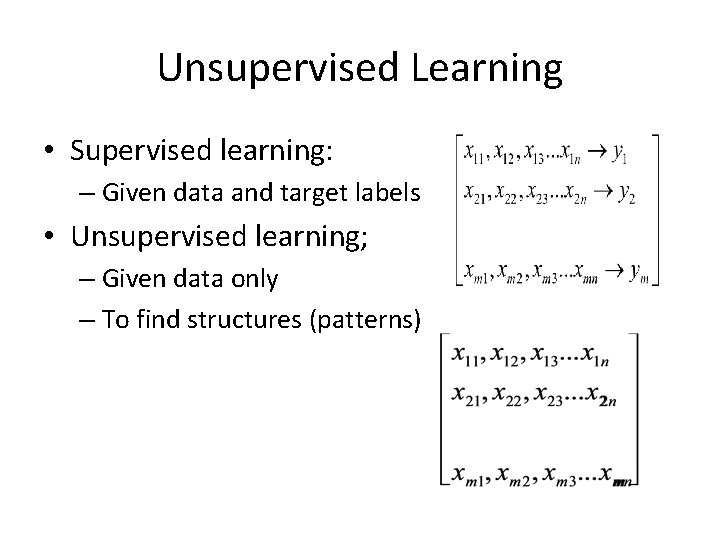
Unsupervised Learning • Supervised learning: – Given data and target labels • Unsupervised learning; – Given data only – To find structures (patterns)
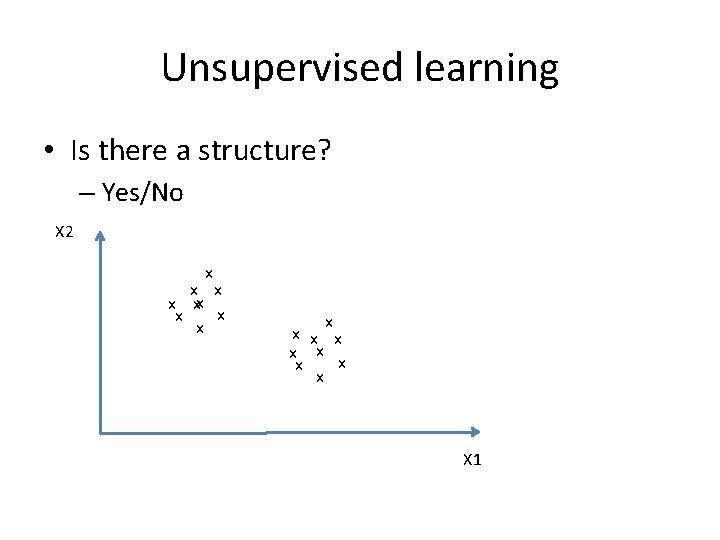
Unsupervised learning • Is there a structure? – Yes/No X 2 x x xx x x x X 1
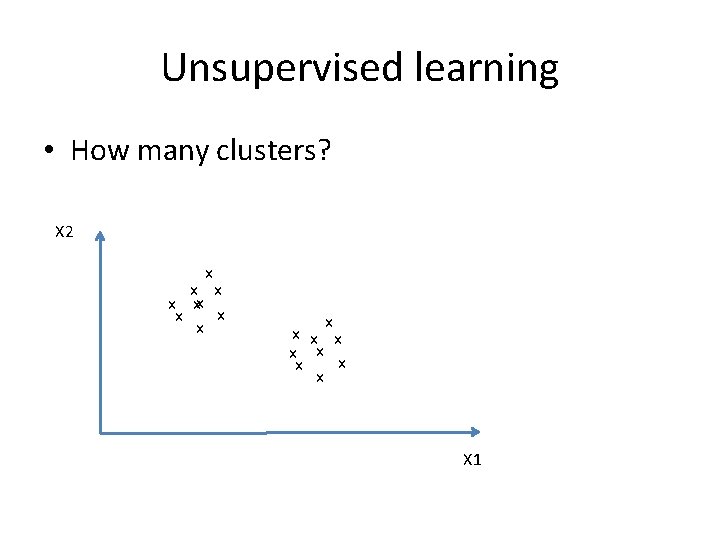
Unsupervised learning • How many clusters? X 2 x x xx x x x X 1
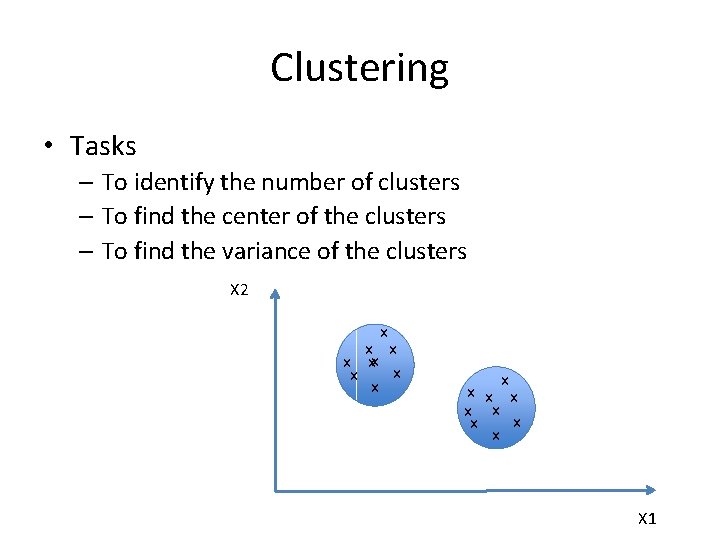
Clustering • Tasks – To identify the number of clusters – To find the center of the clusters – To find the variance of the clusters X 2 x x xx x x x X 1
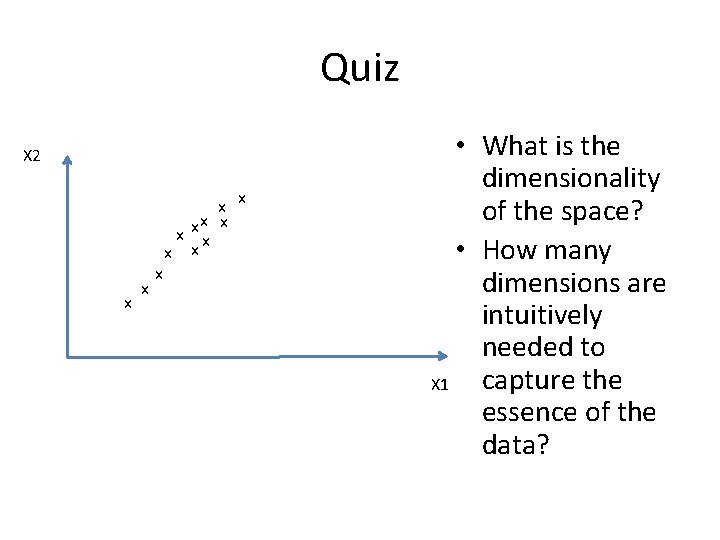
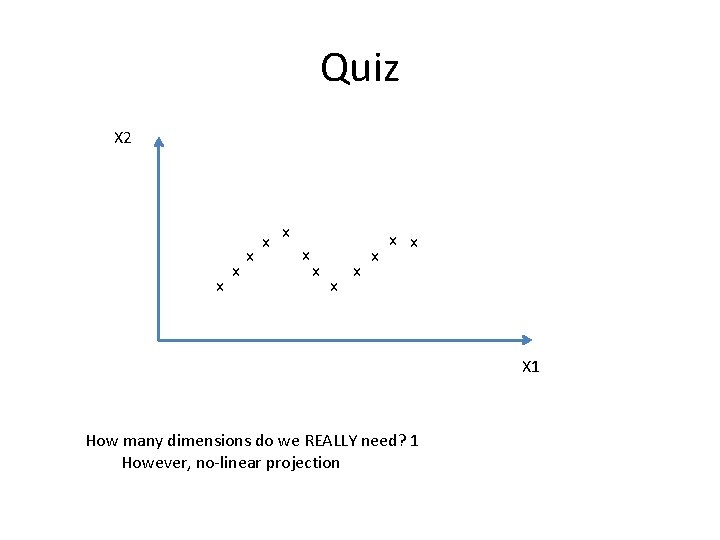
Quiz X 2 x x x • What is the dimensionality of the space? • How many dimensions are intuitively needed to capture the X 1 essence of the data?
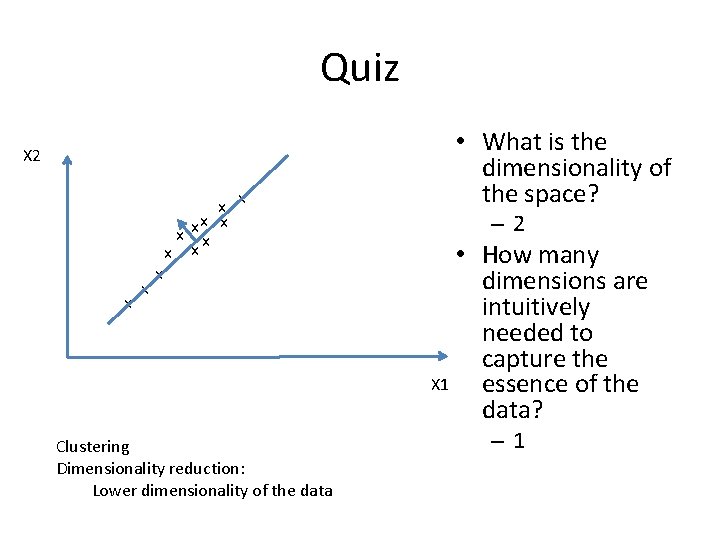
Quiz X 2 x x x Clustering Dimensionality reduction: Lower dimensionality of the data • What is the dimensionality of the space? – 2 • How many dimensions are intuitively needed to capture the X 1 essence of the data? – 1
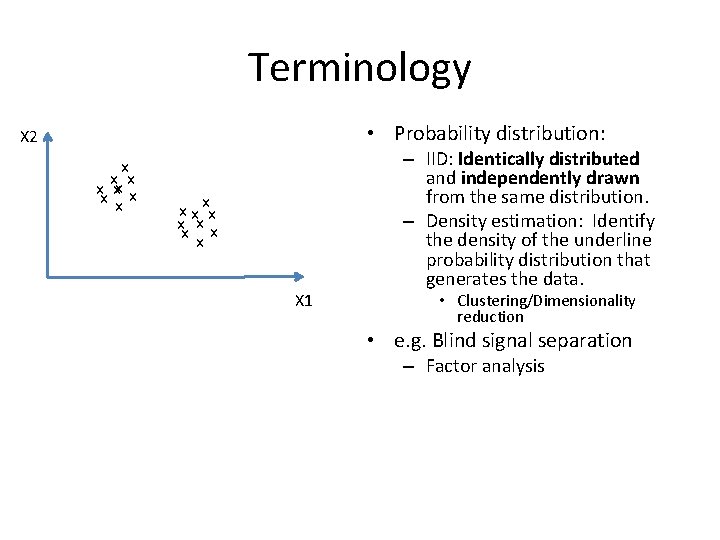
Terminology • Probability distribution: X 2 x x x xx xx x x x X 1 – IID: Identically distributed and independently drawn from the same distribution. – Density estimation: Identify the density of the underline probability distribution that generates the data. • Clustering/Dimensionality reduction • e. g. Blind signal separation – Factor analysis
Example: Google street view • Concepts discoveries: – Houses, Trees, pavements, cars, etc. • Learn from observations without target labels – Andrew Ng, “How many computers to identify a Cat? 16, 000” from the New York Times
Clustering • Two methods: – k-Means – Expectation maximization • Probabilistic generalization of k-Means.
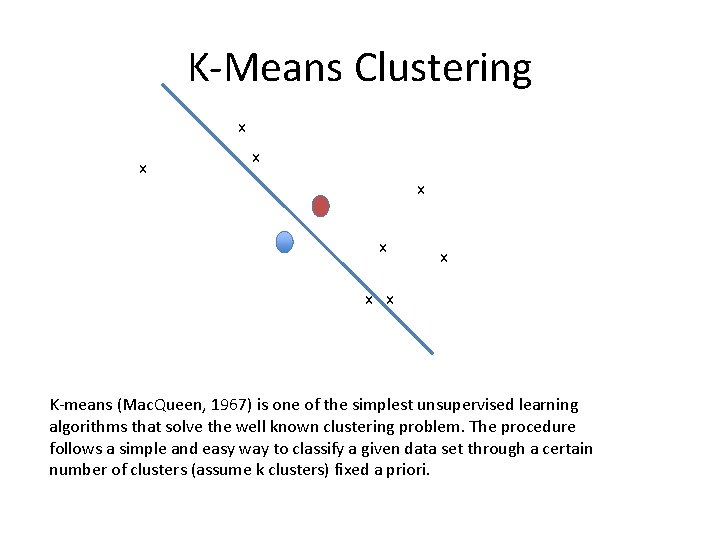
K-Means Clustering x x x x K-means (Mac. Queen, 1967) is one of the simplest unsupervised learning algorithms that solve the well known clustering problem. The procedure follows a simple and easy way to classify a given data set through a certain number of clusters (assume k clusters) fixed a priori.
k-Means Algorithm • Suppose that we have n sample feature vectors x 1, x 2, . . . , xn all from the same class, and we know that they fall into k compact clusters, k < n. Let mi be the mean of the vectors in cluster i. If the clusters are well separated, we can use a minimum-distance classifier to separate them. That is, we can say that x is in cluster i if || x - mi || is the minimum of all the k distances. This suggests the following procedure for finding the k means: – Make initial guesses for the means m 1, m 2, . . . , mk – Until there are no changes in any mean • Use the estimated means to classify the samples into clusters • For i from 1 to k – Replace mi with the mean of all of the samples for cluster i • end_for – end_until • http: //home. dei. polimi. it/matteucc/Clustering/tutorial_html/Apple t. KM. html
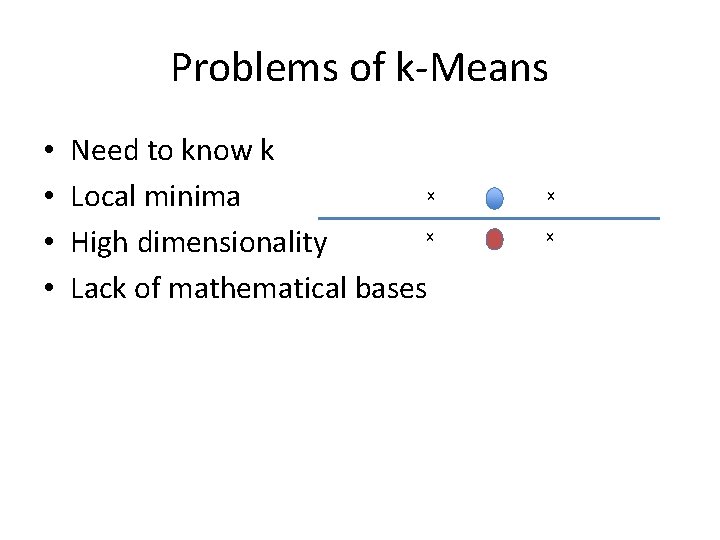
Problems of k-Means • • Need to know k x Local minima x High dimensionality Lack of mathematical bases x x
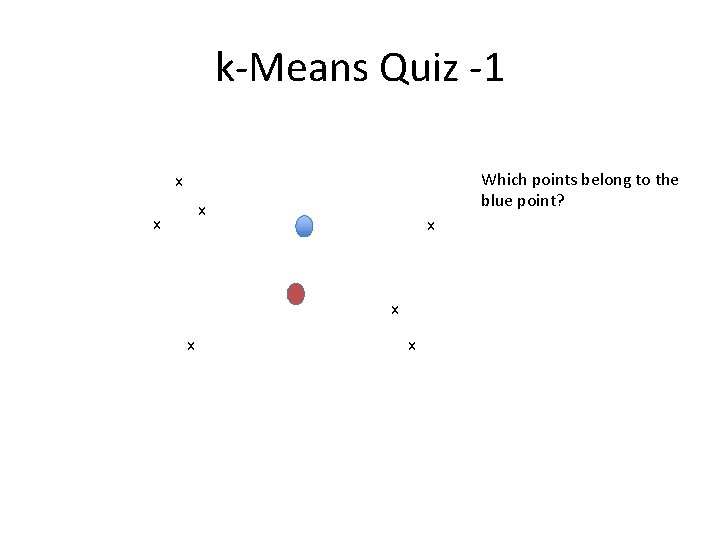
k-Means Quiz -1 Which points belong to the blue point? x x x x
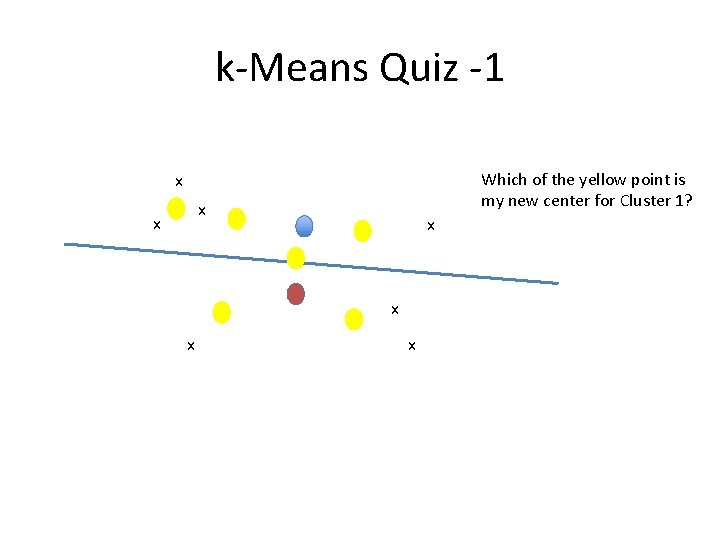
k-Means Quiz -1 Which of the yellow point is my new center for Cluster 1? x x x x
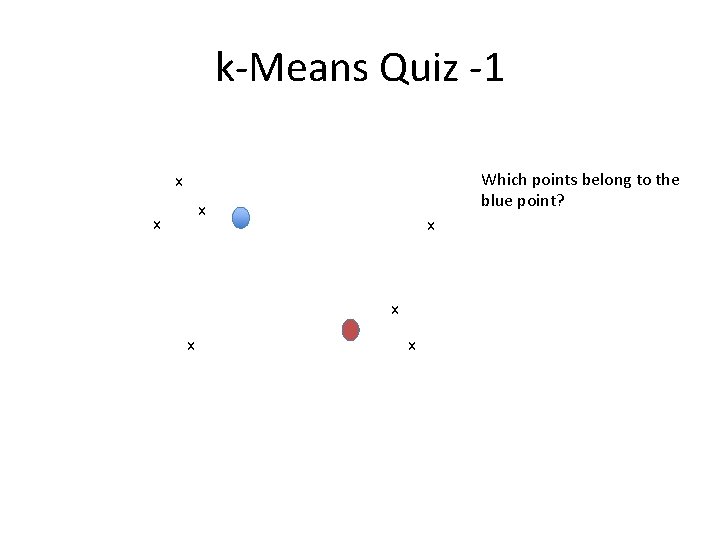
k-Means Quiz -1 Which points belong to the blue point? x x x x
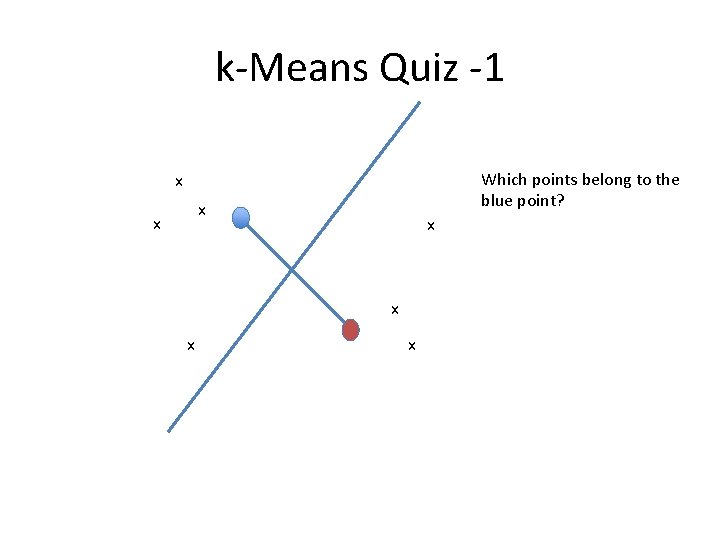
k-Means Quiz -1 Which points belong to the blue point? x x x x
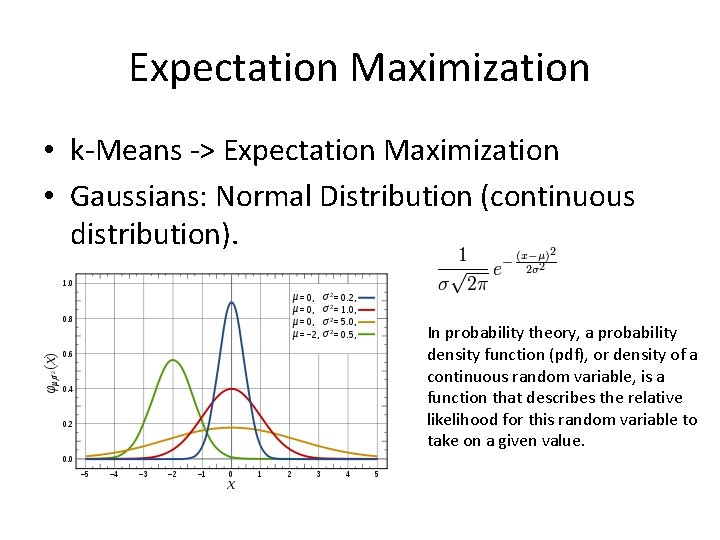
Expectation Maximization • k-Means -> Expectation Maximization • Gaussians: Normal Distribution (continuous distribution). In probability theory, a probability density function (pdf), or density of a continuous random variable, is a function that describes the relative likelihood for this random variable to take on a given value.
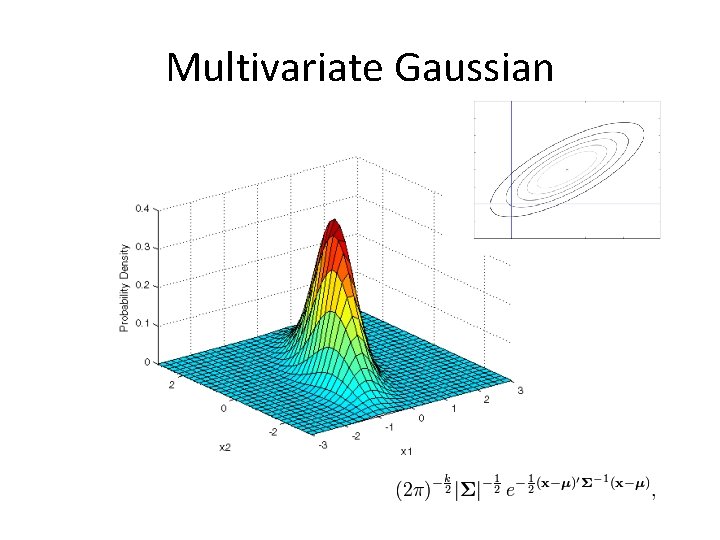
Multivariate Gaussian
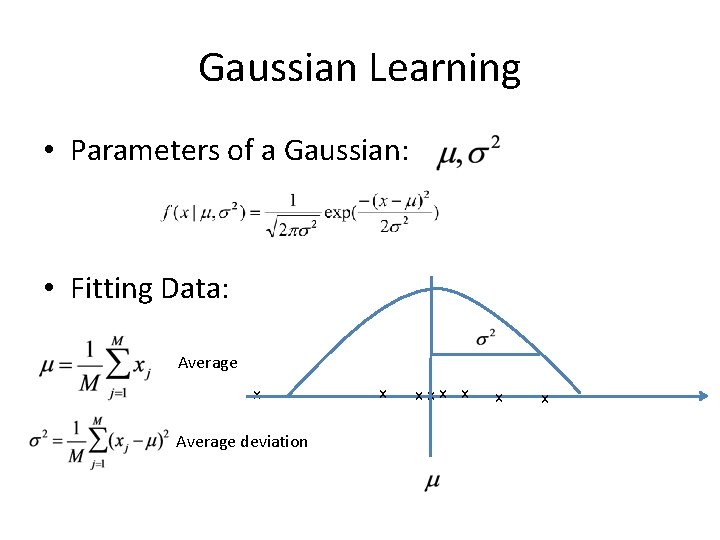
Gaussian Learning • Parameters of a Gaussian: • Fitting Data: Average x Average deviation x xxx x
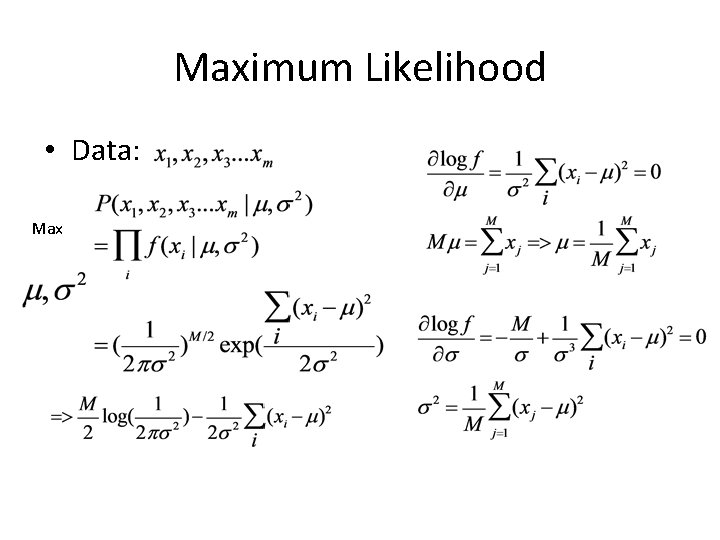
Maximum Likelihood • Data: Max
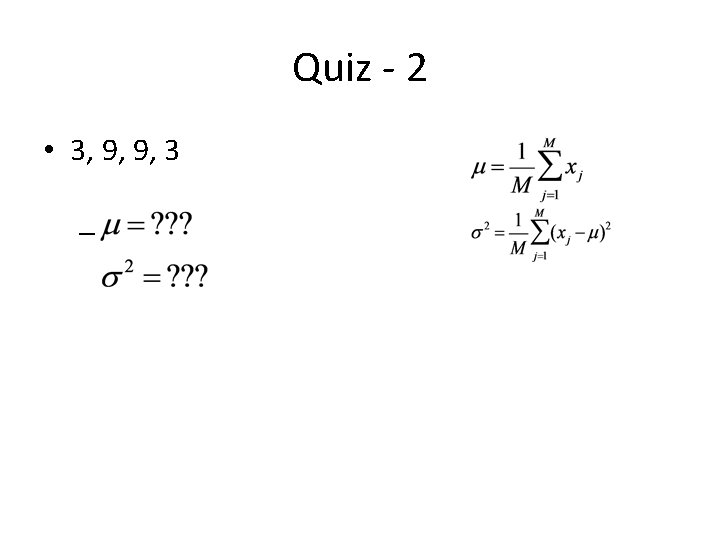
Quiz - 2 • 3, 9, 9, 3 –
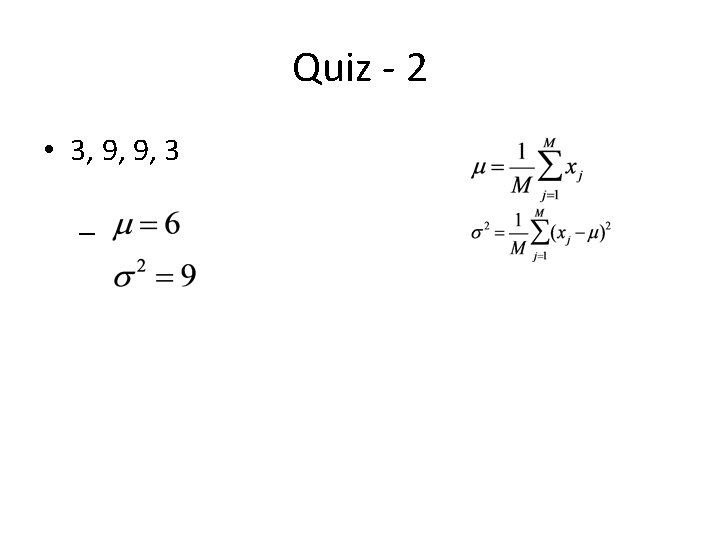
Quiz - 2 • 3, 9, 9, 3 –
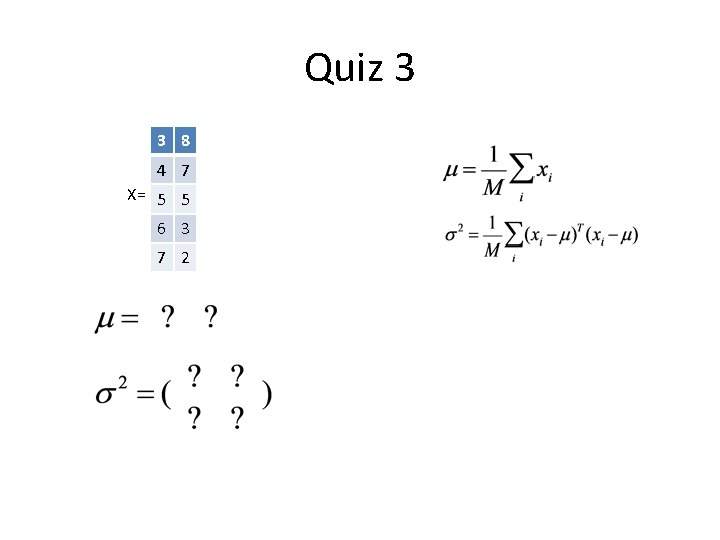
Quiz 3 3 8 4 7 X= 5 5 6 3 7 2
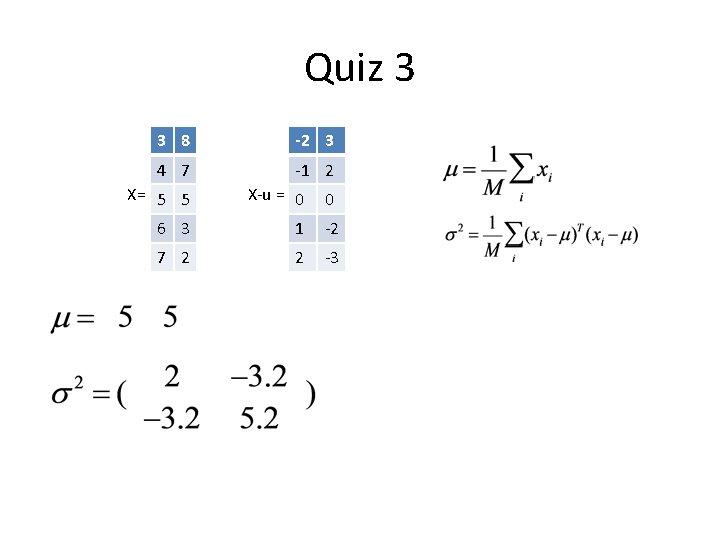
Quiz 3 3 8 -2 3 4 7 -1 2 X= 5 5 X-u = 0 6 3 1 -2 7 2 2 -3 0
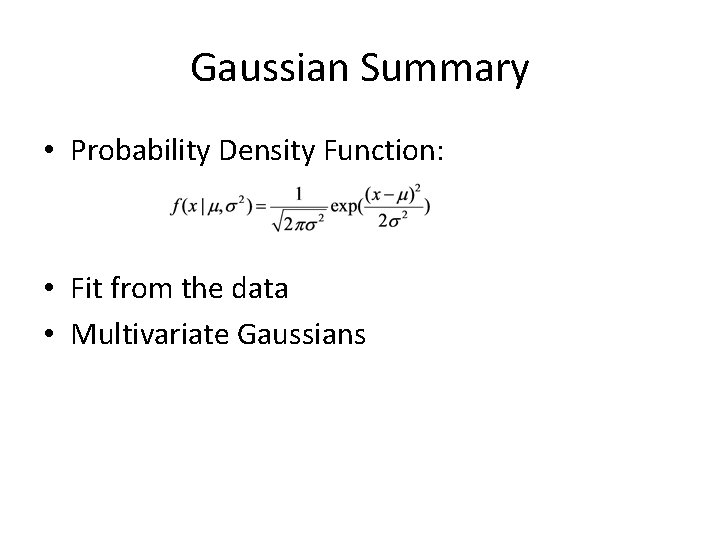
Gaussian Summary • Probability Density Function: • Fit from the data • Multivariate Gaussians
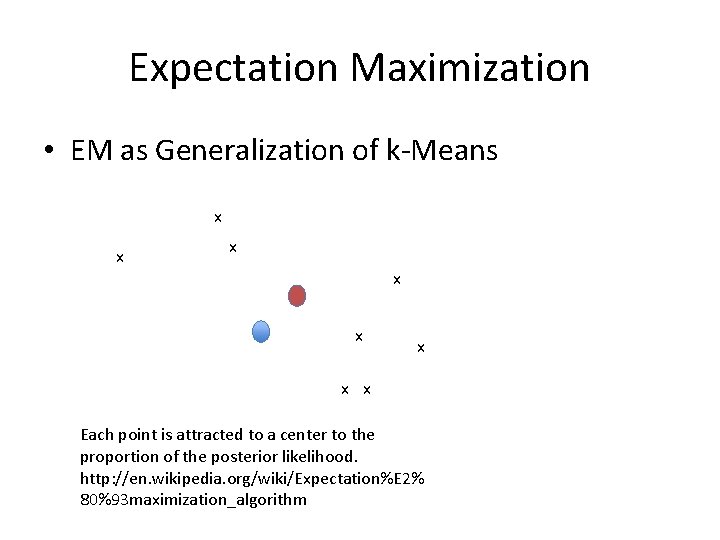
Expectation Maximization • EM as Generalization of k-Means x x x x Each point is attracted to a center to the proportion of the posterior likelihood. http: //en. wikipedia. org/wiki/Expectation%E 2% 80%93 maximization_algorithm
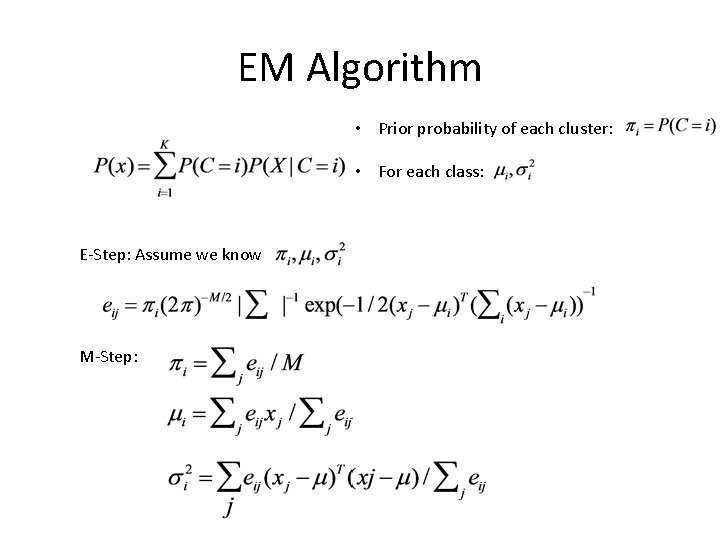
EM Algorithm • Prior probability of each cluster: • For each class: E-Step: Assume we know M-Step:
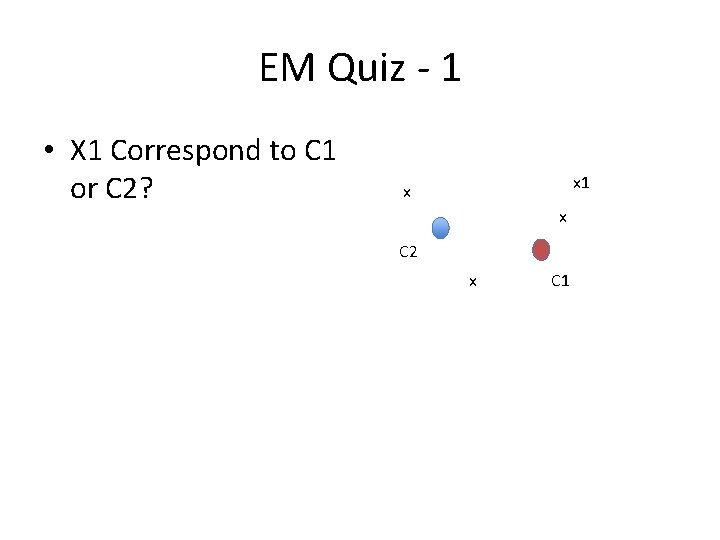
EM Quiz - 1 • X 1 Correspond to C 1 or C 2? x 1 x x C 2 x C 1
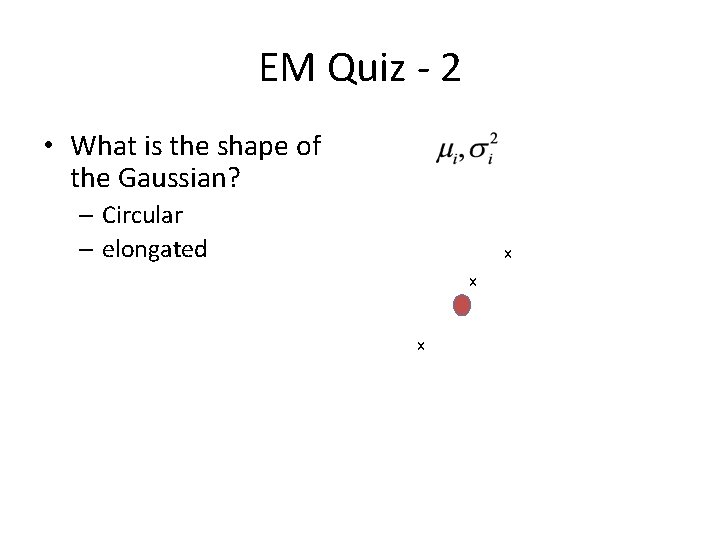
EM Quiz - 2 • What is the shape of the Gaussian? – Circular – elongated x x x
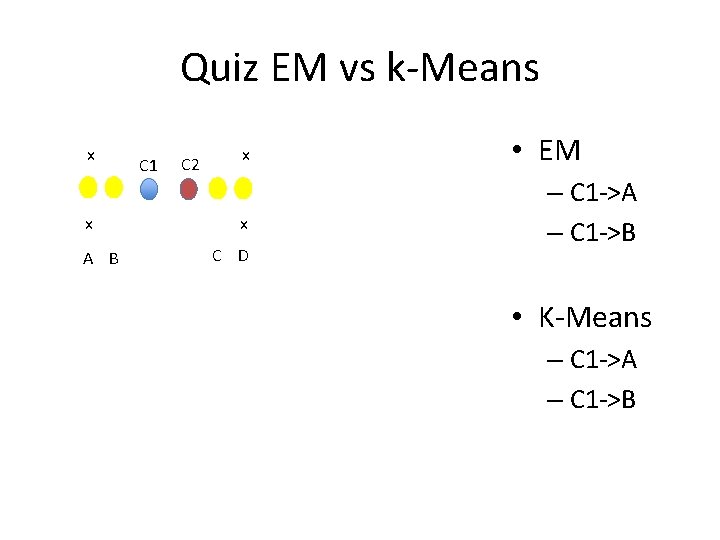
Quiz EM vs k-Means x x A B C 1 C 2 x x C D • EM – C 1 ->A – C 1 ->B • K-Means – C 1 ->A – C 1 ->B
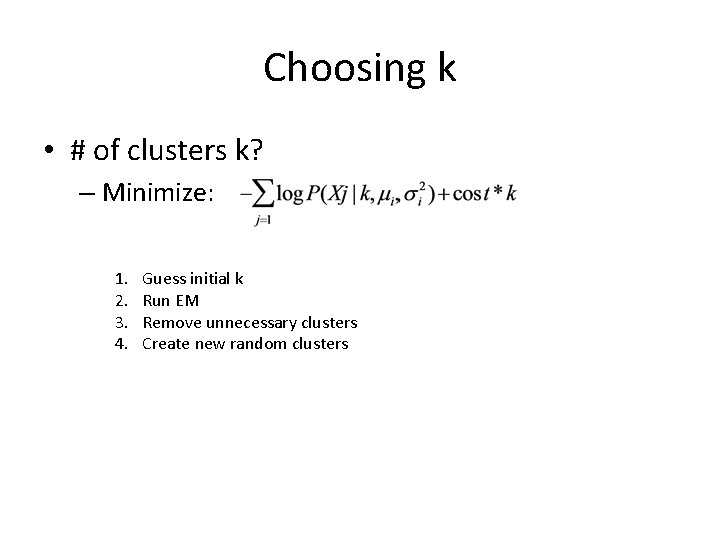
Choosing k • # of clusters k? – Minimize: 1. 2. 3. 4. Guess initial k Run EM Remove unnecessary clusters Create new random clusters
Clustering summary • K-Means • Expectation Maximization
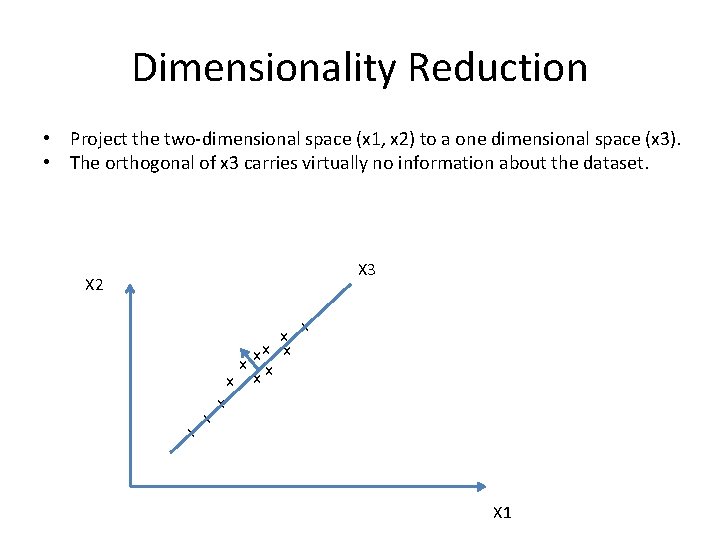
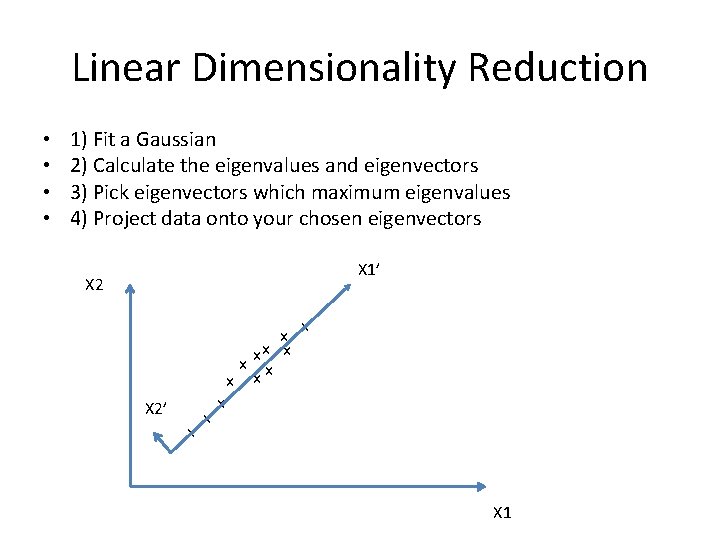
Dimensionality Reduction • Project the two-dimensional space (x 1, x 2) to a one dimensional space (x 3). • The orthogonal of x 3 carries virtually no information about the dataset. X 3 X 2 x x x X 1
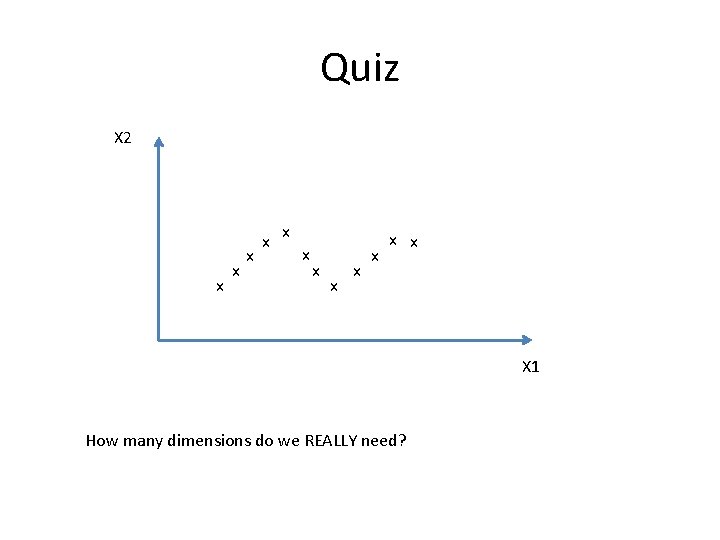
Quiz X 2 x x x X 1 How many dimensions do we REALLY need?
Quiz X 2 x x x X 1 How many dimensions do we REALLY need? 1 However, no-linear projection
Linear Dimensionality Reduction • • 1) Fit a Gaussian 2) Calculate the eigenvalues and eigenvectors 3) Pick eigenvectors which maximum eigenvalues 4) Project data onto your chosen eigenvectors X 1’ X 2’ x x x X 1
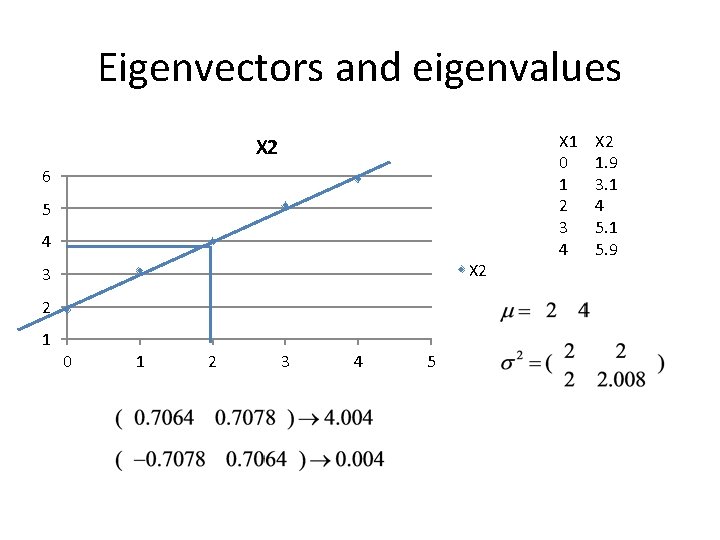
Eigenvectors and eigenvalues X 2 6 5 4 X 2 3 2 1 0 1 2 3 4 5 X 1 0 1 2 3 4 X 2 1. 9 3. 1 4 5. 1 5. 9
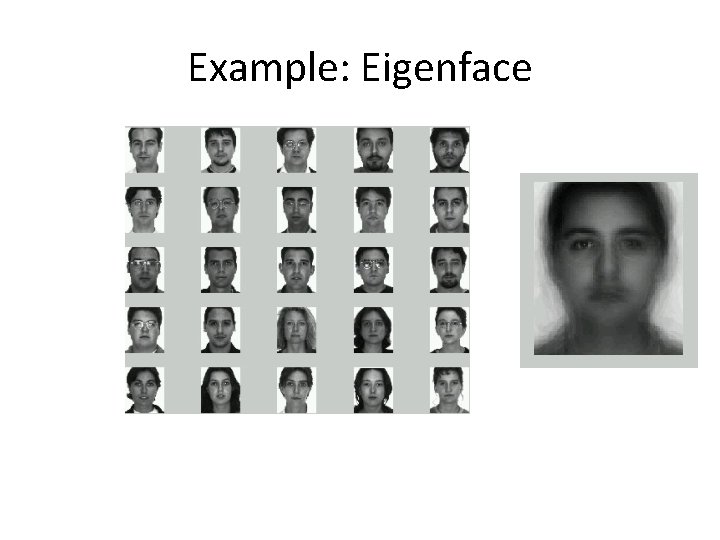
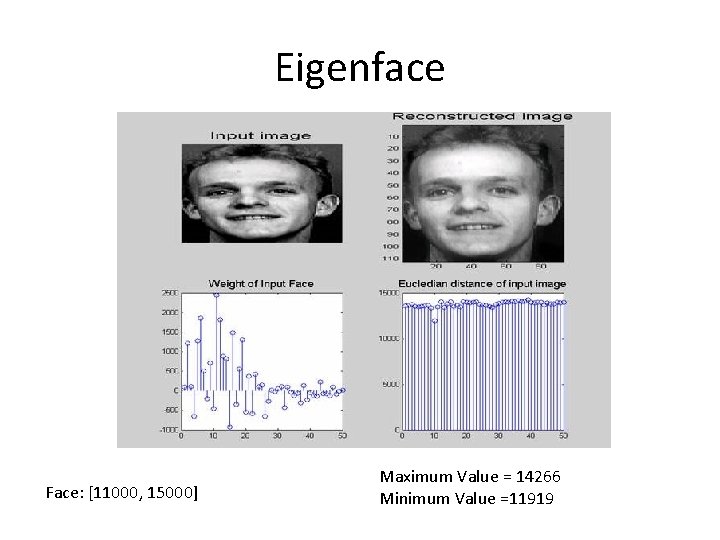
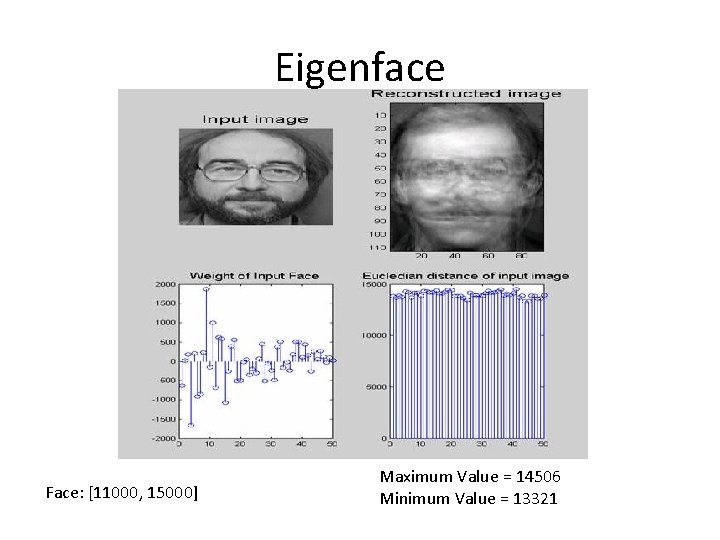
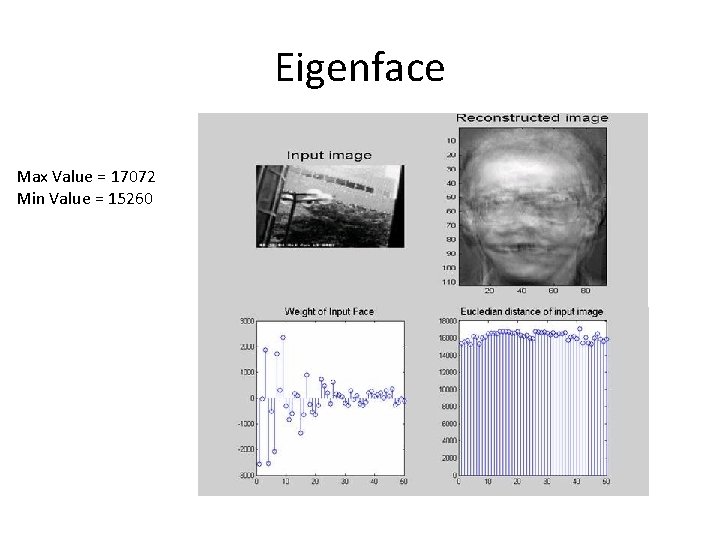
Example: Eigenface
Eigenface Face: [11000, 15000] Maximum Value = 14266 Minimum Value =11919
Eigenface Face: [11000, 15000] Maximum Value = 14506 Minimum Value = 13321
Eigenface Max Value = 17072 Min Value = 15260
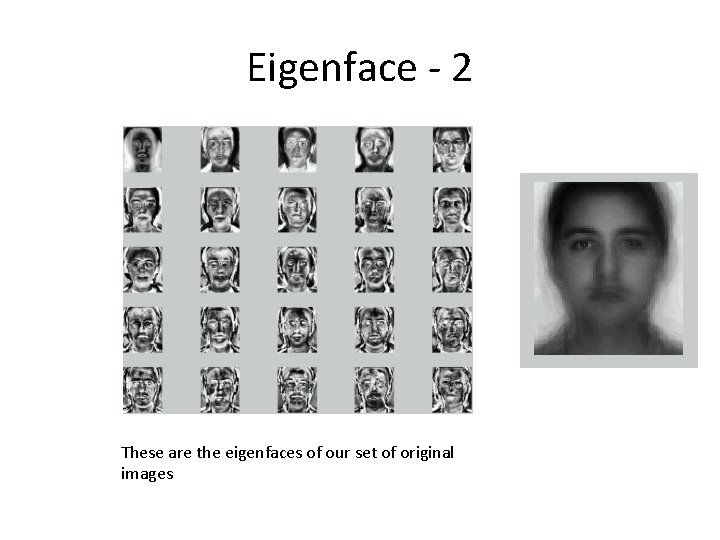
Eigenface - 2 These are the eigenfaces of our set of original images
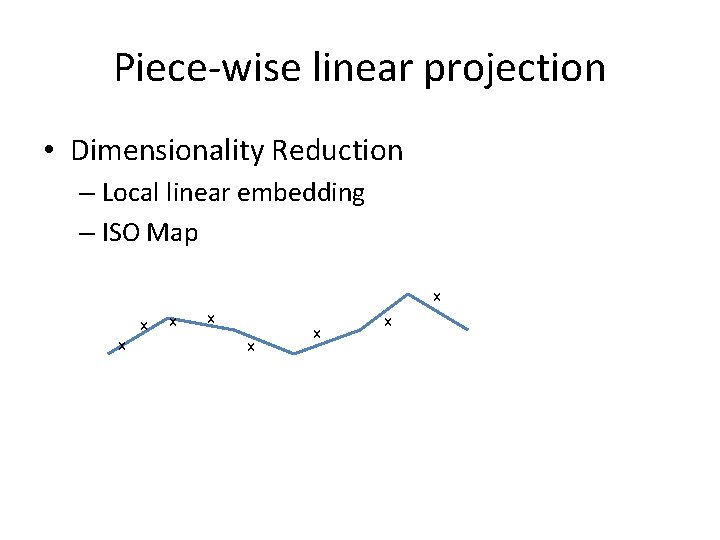
Piece-wise linear projection • Dimensionality Reduction – Local linear embedding – ISO Map x x x x
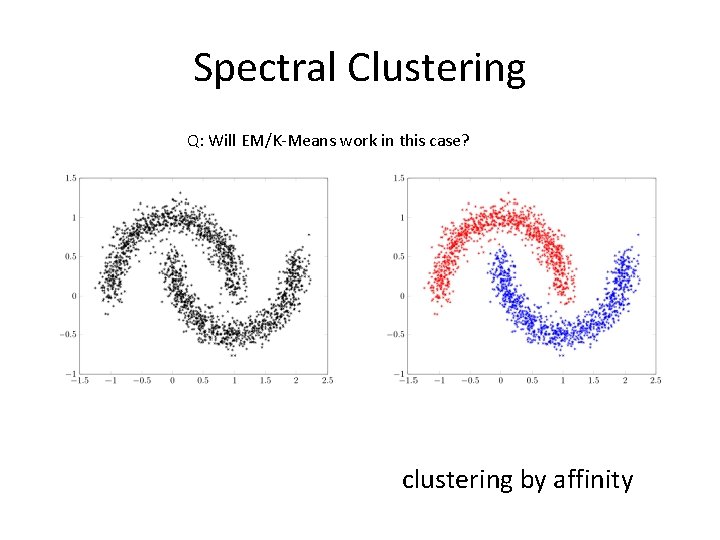
Spectral Clustering Q: Will EM/K-Means work in this case? clustering by affinity
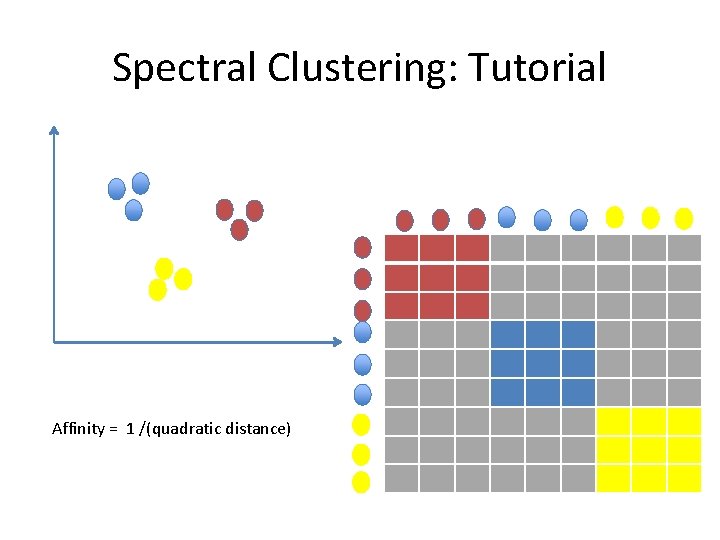
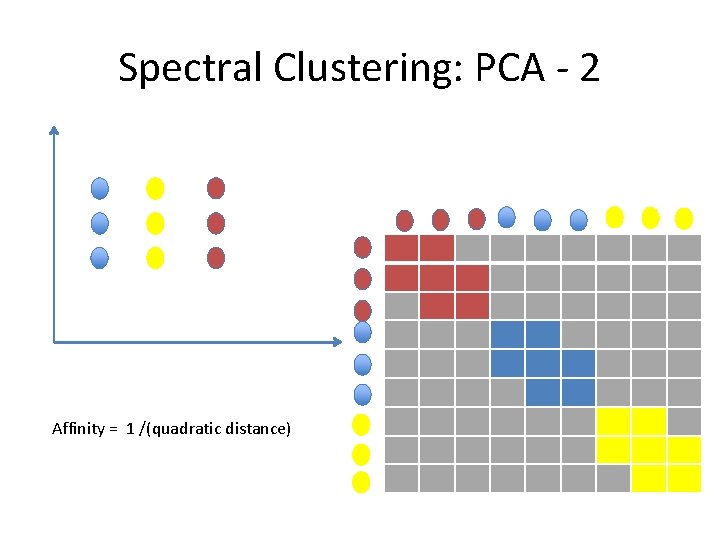
Spectral Clustering: Tutorial Affinity = 1 /(quadratic distance)
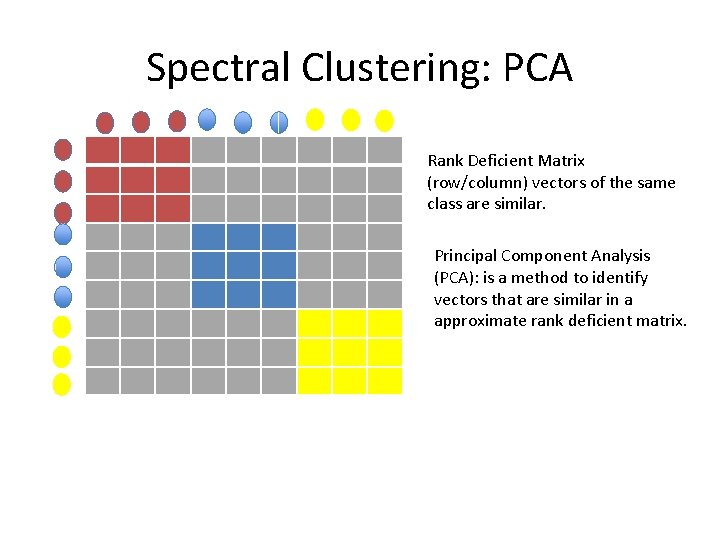
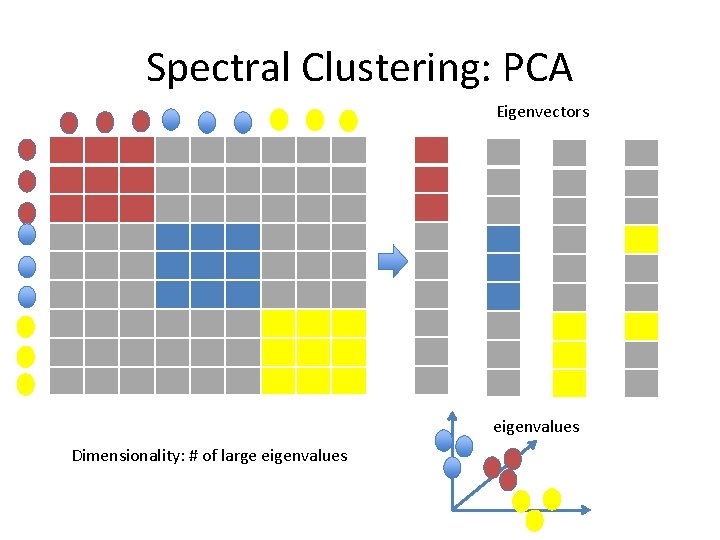
Spectral Clustering: PCA Rank Deficient Matrix (row/column) vectors of the same class are similar. Principal Component Analysis (PCA): is a method to identify vectors that are similar in a approximate rank deficient matrix.
Spectral Clustering: PCA Eigenvectors eigenvalues Dimensionality: # of large eigenvalues
Spectral Clustering: PCA - 2 Affinity = 1 /(quadratic distance)
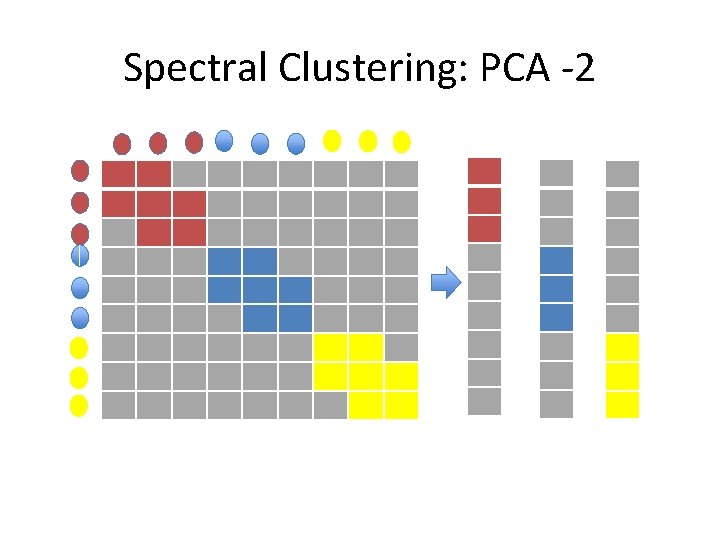
Spectral Clustering: PCA -2
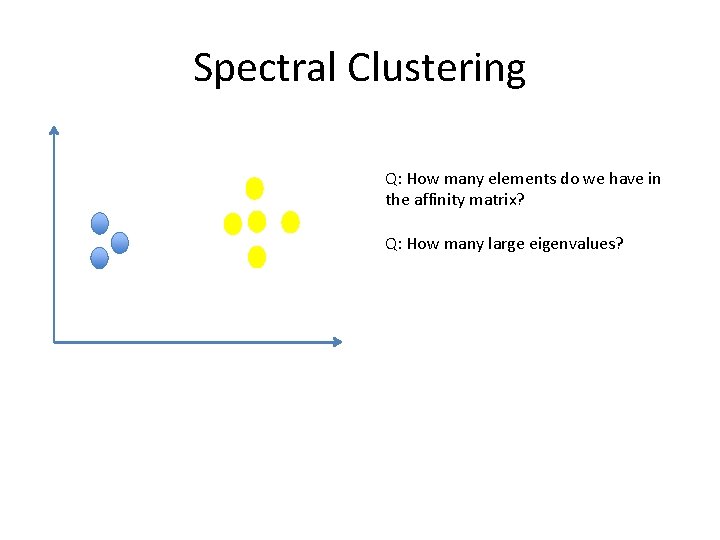
Spectral Clustering Q: How many elements do we have in the affinity matrix? Q: How many large eigenvalues?
Supervised vs Unsupervised Supervised Unsupervised