Weather Map April 3 Atmospheric Pressure Air Pressure


- Slides: 47

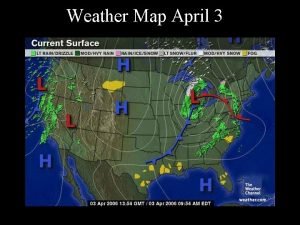
Weather Map April 3


Atmospheric Pressure

Air Pressure Affects • • Wind movement Cloud formation (convergence) Precipitation Development of storms Pressure is one of the most properties for studying the atmosphere and predicting weather!

• Pressure - force exerted per unit area • Units of pressure –Pascal (pa) –Bar (b) –Millibar (mb) – 1 mb = 100 Pa • Surface pressure - pressure that the atmosphere exerts on the surface. Near sea level the average air pressure is about 1000 mb = 100 Pa = 1 atmosphere = 14. 7 pounds/inch 2. 1013 mb is the true value.

• Pressure - force exerted per unit area

• In a sealed container, the air pressure is proportional to rate of collisions between molecules and the walls of the container. • Two ways to increase P –Increase the amount of gas molecules –Increase temperature • If the pressure in your container is less than the air pressure outside the container, opening the container will cause air to rush in. • If the pressure in your container is greater than the air pressure outside the container, opening the container will cause air to rush out. Air moves from areas of high pressure to areas of low pressure.

• Ideal Gas Law • P=DRT – P - pressure – D - density – R- constant – T - temperature This indicates a relationship between pressure, temperature and density. If D increases and T remains constant, P will increase. If T increases and D remains constant, P will increase.

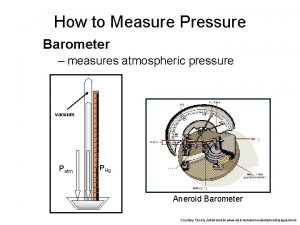
Measuring Pressure • Barometer - any instrument used to measure pressure. • Two Common Types – Mercury barometer – Aneroid Barometer


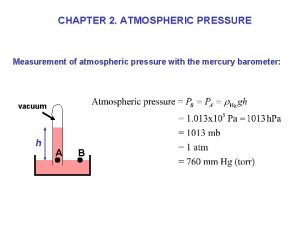
Mercury Barometer • Standard instrument for measuring pressure • Consists of a reservoir of mercury and a graduated tube marked in centimeters • Air pressure is pushed down on the mercury in the reservoir and forces it up the tube • The barometric pressure is expressed in centimeters (cm) – – 1 cm = 13. 32 mb Standard air pressure at sea level is 76 cm 1 inch = 33. 84 mb Standard air pressure at sea level is 29. 2 inches • Correction to the Mercury Barometer – 1) elevation – 2) Temperature – 3) latitude (gravity differences)

Corrections for the Mercury Barometer • 1) Elelvation – When studying pressure distributions it is often useful to look at horizontal distributions of pressure. Since pressure changes with elevation, measurements of pressure taken at different elevations are standardized to”mean sea level”. 2) Temperature since mercury also responds to temperature change, a temperature correction must be made and mercury barometers usually have thermometers too. 3) gravity variations are standardized to 45 o N and S of the equator.

• Aneroid Barometer – Without liquid – Contains a collapsible chamber (the aneroid cell) – Weight of the atmosphere pushed down on the chamber and compresses it by an amount proportional to the air pressure. – Corrections • Elevation • Location • No temperature correction required.

Other Barometer types • Barograph • Microbarometer

Barograph • Stacked aneroid cells move a needle • Needle movement is traced out on a spool of paper • This creates a data-log of variations in atmospheric pressure

Microbarometer • Extremely sensitive barometers • Can measure with great precision • Can measure in microbars or Pascals (vs. hectopascals and millibars)

Microbarometer • There is a global network of microbarographs • They are used to monitor worldwide compliance with the Comprehensive Nuclear Test Ban Treaty • Detect minute changes in pressure associated with nuclear explosions • As a network can id the location and nuclear yield of an explosion

Microbarometer Image courtesy of: http: //www. knmi. nl/~evers/infrasound/lofar/exloo/install 1. jpg

Pressure distributions are important to map across the globe because they influence winds. Weather maps show distributions of sea level pressure using lines of pressure called isobars. Isobar - Map line connecting point of the same pressure. Points between isobars have pressures between that represented by the lines. Usually drawn at intervals of 4 mb on a surface map.

Isobars. Spacing of isobars indicates the pressure gradient. Pressure gradient - rate of change in pressure over a region. Closely spaced isobars indicates a steep pressure gradient. Widely spaced isobars indicates a gentle pressure gradient.

Air spreads from areas of high pressure to areas of low pressure and the pressure gradient produces a force called the pressure gradient force (PGF) Pressure gradient force (PGF) - a force that arises from spatial variation in pressure.


Pressure Gradients 1) Horizontal pressure gradients Changes in pressure gradient across the US (~ 3000 km) are ~ 40 mb/3000 km or 1 mb/75 km 2) Hurricane pressure gradients Hurricanes produce the most destructive winds. Hurricane pressure gradients = 1 mb/6 km

Vertical Pressure Gradients

Pressure Gradients 3) Vertical pressure gradients Much greater Surface e pressures are about 1000 mb 5 km up into the troposphere pressures decrease to 500 mb Vertical pressure gradients = 100 mb/km So why don’t the air blow away? Hydrostatic equilibrium - vertical PGF is balanced by the force of gravity.

5000 m 500 mb 4000 m 3000 m 2000 m 1000 mb

The PGF is proportional to the slope of the 500 mb pressure surface. 5000 m 500 mb 700 mb 4000 m 3000 m 2000 m 1000 mb

Contour Lines • For the upper atmosphere contour lines are used to show the height at which a specific pressure occurs. • Contour lines - lines connecting point of the same elevation.

Weather Maps • NOAA - National Oceanographic and Atmosphere Administrations • NWS - National Weather Service – Produces a series of weather maps twice a day. – Surface Maps - using isobar maps – – – Using height contours: 300 mb - Upper atmosphere 500 mb - middle atmosphere 700 mb -lower atmosphere 850 mb - lower atmosphere

Forces Affecting Speed and Direction of Wind • If no other forces were present the wind would flow in the direction of the pressure gradient force. • Two other forces affect winds: – Coriolis Force – Friction • Coriolis Force - force arising from Earth’s rotation exerted on all freely moving objects. First described by Gaspard de Coriolis (19 th Century)

Coriolis Force • Earth’s rotation causes two types of motion: – Translational motion – Rotational motion • Rotational motion is greatest at the poles

Effects of the Coriolis Force 1) Objects moving in free space experience an apparent deflection to the right of their path of motion. 2) Coriolis force is strongest at the poles and weakest at the equator. 3) Coriolis force is a deflective force affecting direction only and not speed.

Friction Air in contact with the surface experiences frictional drag, which decreases wind speed. Affects the lower 1. 5 km of the atmosphere called the planetary boundary later. Planetary boundary layer - lower 1. 5 km of the atmosphere, which is affected by frictional drag. Free atmosphere - part of the atmosphere above 1. 5 km, which is not affected by frictional drag. Therefore winds in the upper atmosphere are simpler

Winds in the Upper Atmosphere Geostrophic (Earth turned) flow - wind flows in a straight path, at constant speed parallel to isobars or height contours. Isobars are straight, parallel and equally spaced- Ideal Gradient Flow - wind blowing parallel to the isobars and perpendicular to the pressure gradient. Wind may change direction and speed. Supergeostrophic flow - PGF is weaker than the Coriolis force causing the air to rotate clockwise. Occurs around high pressure systems called anitcyclones

Winds in the Upper Atmosphere Geostrophic (Earth turned) flow - wind flows in a straight path, at constant speed parallel to isobars. Isobars are straight, parallel and equally spaced- Ideal Gradient Flow - wind blowing parallel to the isobars and perpendicular to the pressure gradient. Wind may change direction and speed. Supergeostrophic flow - PGF is weaker than the Coriolis force causing the air to rotate clockwise. Occurs around high pressure systems called anitcyclones. Subgeostrophic flow - PGF is stronger than the Coriolis force causing the air to rotate counterclockwise. Occurs low pressure systems called cyclones.

Cyclones and Anticyclones

Cyclones and Anticyclones • Sea level pressure across the globe are divided into high and low pressure centers.

Anticyclones • Enclosed areas of high pressure. • Shown on weather maps by “H” • In the Northern Hemisphere, upper level winds rotate clockwise around H pressure systems. In near surface H pressure systems air spirals out from the central H in a clockwise rotation. • In the Southern Hemisphere, upper level winds rotate counterclockwise around H pressure systems. In near surface H pressure systems air spirals out from the central H in a counterclockwise rotation. • Results: – Inhibits cloud growth because of divergence – Low wind speeds – Clear skies

Cyclones • Enclosed areas of low pressure. • Shown on weather maps by “L” • In the Northern Hemisphere, upper level winds rotate counterclockwise around L pressure systems. In near surface L pressure systems air spirals in toward the central L in a counterclockwise rotation. • In the Southern Hemisphere, upper level winds rotate clockwise around L pressure systems. In near surface H pressure systems air spirals in toward the central L in a clockwise rotation. • Results: – – cloud growth because of convergence high wind speeds Cloudy skies Major producers of stormy weather in our region


Convergence in the upper atmosphere leads to divergence near the surface Divergence in the upper atmosphere leads to convergence near the surface

Other weather indicators • Storm Glass • Tempest Prognosticator

Storm Glass • Developed by Admiral Robert Fitz. Roy (captain of the HMS Beagle ) • Mixture of: – – – distilled water Ethanol potassium nitrate ammonium chloride Camphor Image after: http: //www. wikipedia. com

Tempest Prognosticator • • Developed by Dr. Merryweather of England. Exhibited at “The Great Exhibition” In 1851 The Crystal Palace Also called the Leech Barometer Image after: http: //www. britannica. com

Tempest Prognosticator • Noted that leeches become agitated when storms approach • Leeches in the device crawl to the top of their chambers, where they trigger the ringing of a small bell Image after: http: //www. whitbymuseum. org. uk

Pressure Maps • http: //www. usairnet. com/weather/maps/curr ent/barometric-pressure/ • http: //ww 2010. atmos. uiuc. edu/(Gl)/guides/ maps/sfc/slp/irslpvec. rxml
 Atmospheric weather variables
 Weather studies introduction to atmospheric science
 American meteorological society
 Air pressure at different altitudes
 Pressure head meaning
 Barometer vacuum
 High pressure and low pressure
 Atmospheric pressure in complete denture
 Mapline of atmospheric pressure
 Why does low air pressure usually indicate stormy weather
 Pt tanah air sentosa
 Measures air temperature
 Air mass vocabulary
 Weather symbols station model
 Tongue twister winter
 Poem about clothes
 Cold cool
 Whether the weather is fine or whether the weather is not
 Heavy weather by weather report
 Capital weather gang weather wall
 Atmospheric opacity
 Atmospheric perspective landscape
 Atmospheric diving system
 Atmospheric gravity waves
 Penn state atmospheric science
 Lab 5 atmospheric moisture
 Forceparcel
 Single cell model of atmospheric circulation
 Atmospheric stability
 Unstable equilibrium definition
 Atmospheric stability
 Circulates air between 60-90 latitudes
 Atmospheric heaven
 Section 1 atmospheric basics continued answers
 Atmospheric opacity
 Atmospheric circulation
 Atmospheric distortion correction
 Layers of the atmosphere
 Hadley cells
 A first course in atmospheric thermodynamics solutions
 Atmospheric convection
 Atmospheric convection
 Atmospheric convection
 Soaring index
 Atmospheric diving suit
 Lightning elves
 Facility for airborne atmospheric measurements
 Atmospheric refraction
