User perceptions of highway roughness Kevan Shafizadeh and
- Slides: 43
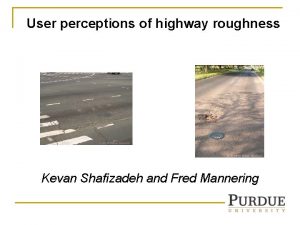
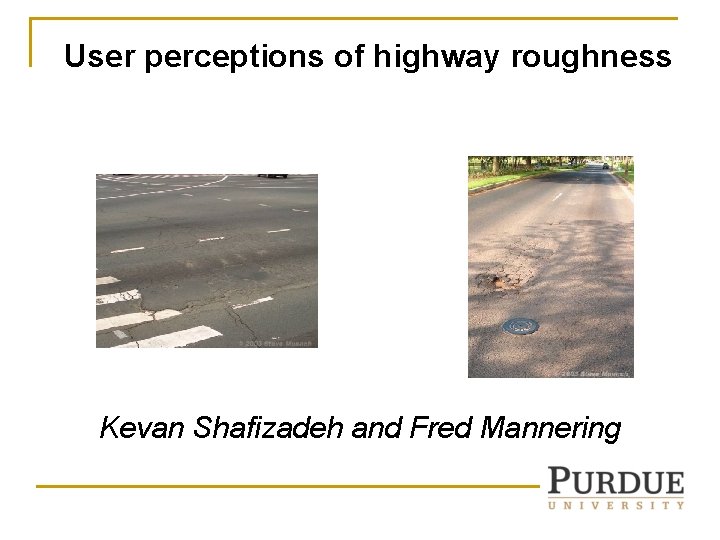
User perceptions of highway roughness Kevan Shafizadeh and Fred Mannering
Background Ø Ø States invest millions of dollars annually measuring the physical condition of their highways Such measurements are used to allocate resources for repair and reconstruction Ø Ø Are the correct factors being measured? How do physical measurements correspond to public perceptions?
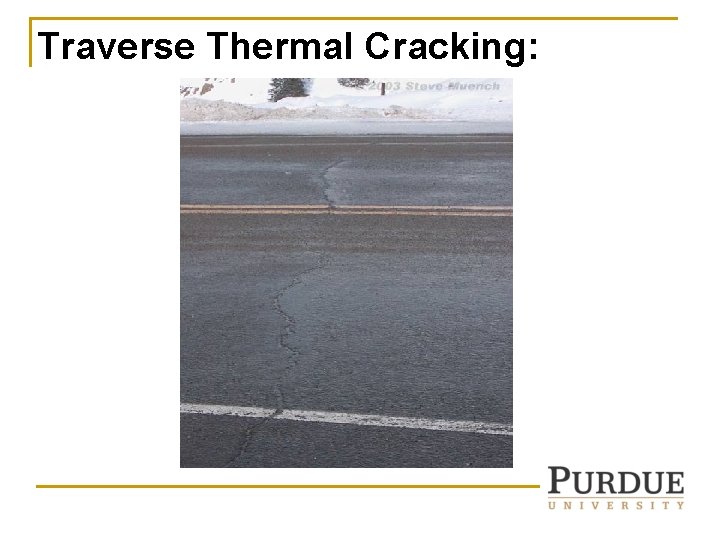
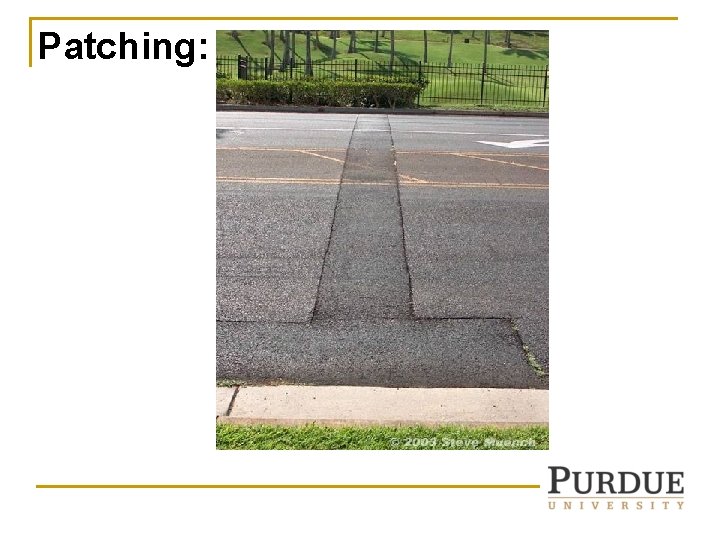
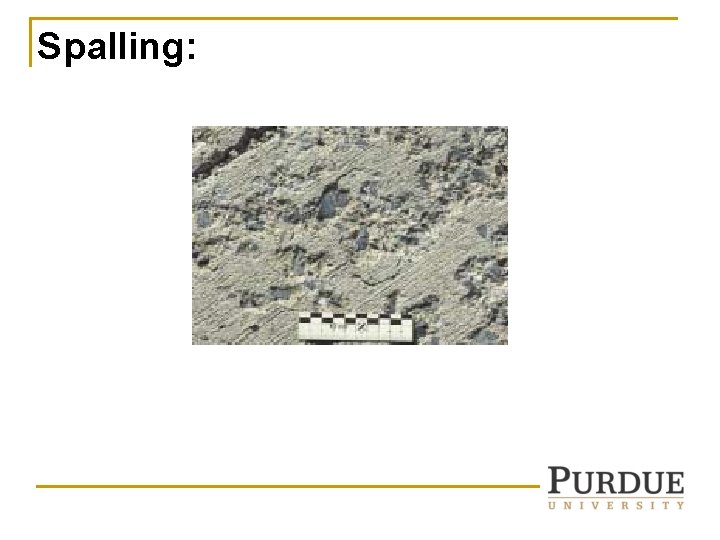
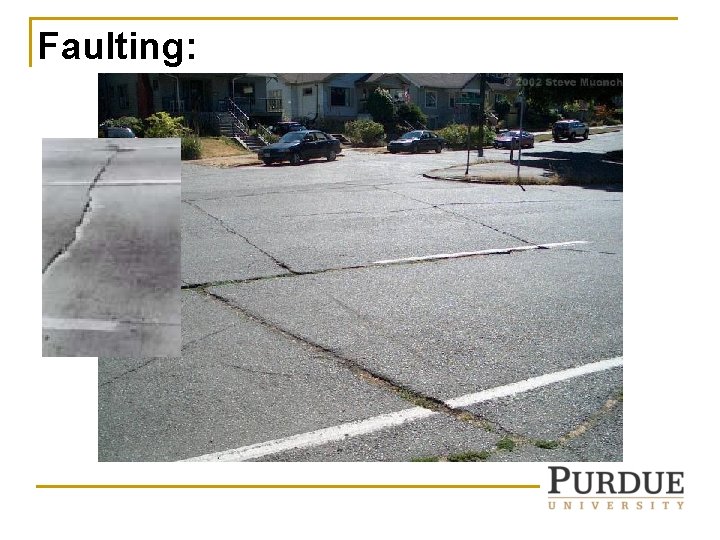
Factors usually measured: Ø Ø Ø Rutting Faulting Cracking Patching Spalling
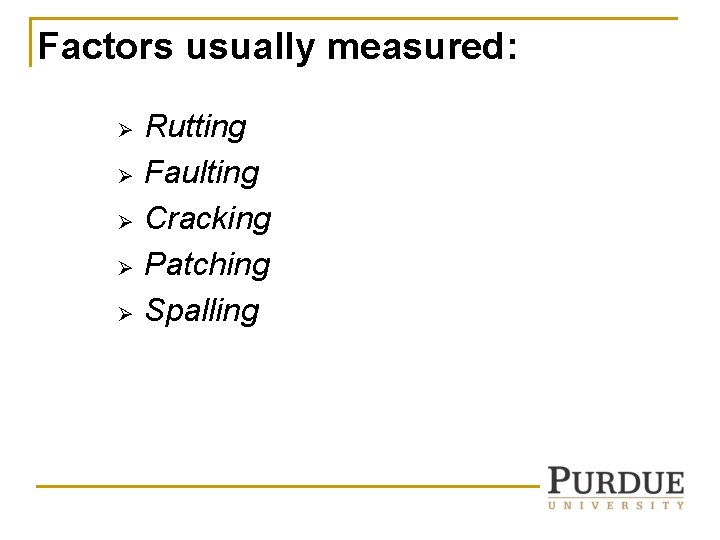
Rutting (surface deflection in wheel path):
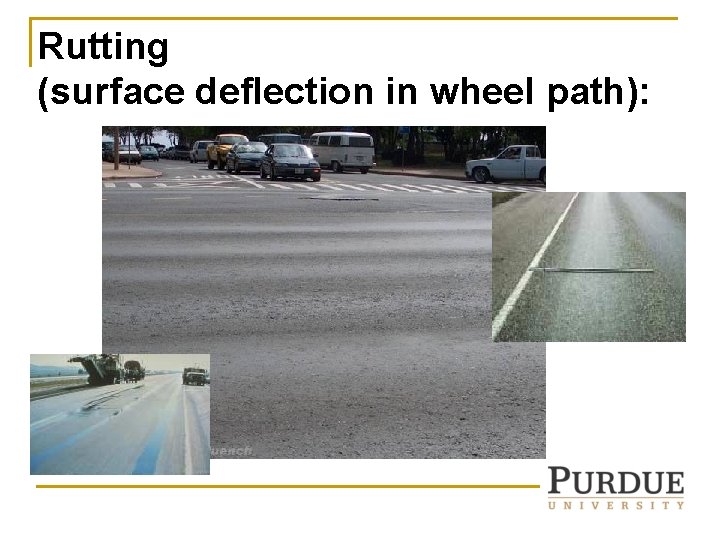
Alligator (fatigue) Cracking:
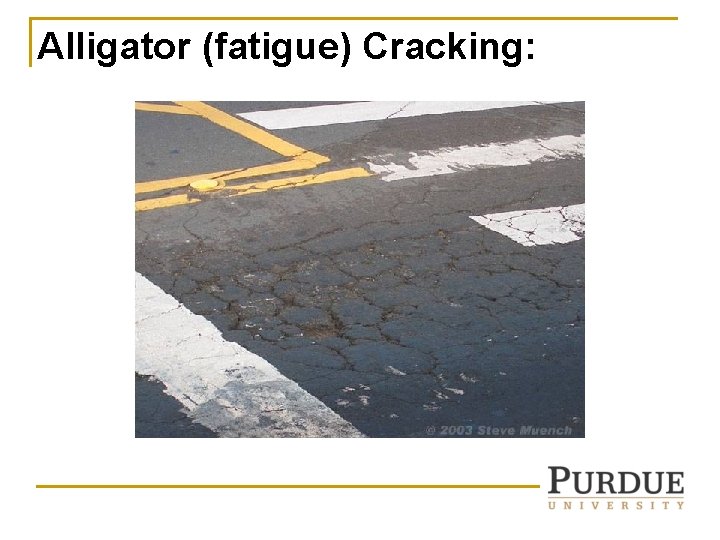
Slippage Cracking:
Traverse Thermal Cracking:
Patching:
Spalling:
Faulting:
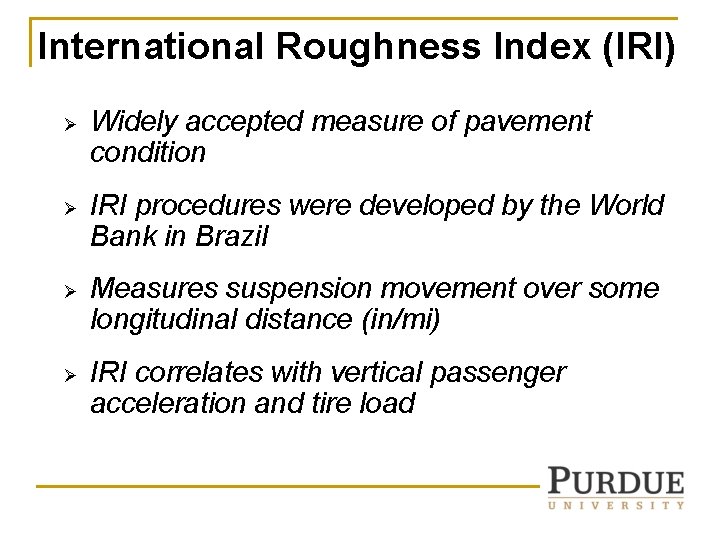
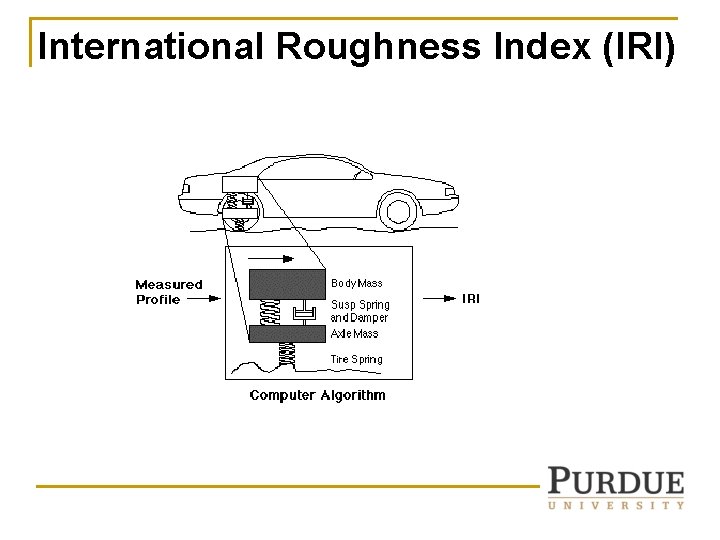
International Roughness Index (IRI) Ø Ø Widely accepted measure of pavement condition IRI procedures were developed by the World Bank in Brazil Measures suspension movement over some longitudinal distance (in/mi) IRI correlates with vertical passenger acceleration and tire load
International Roughness Index (IRI)
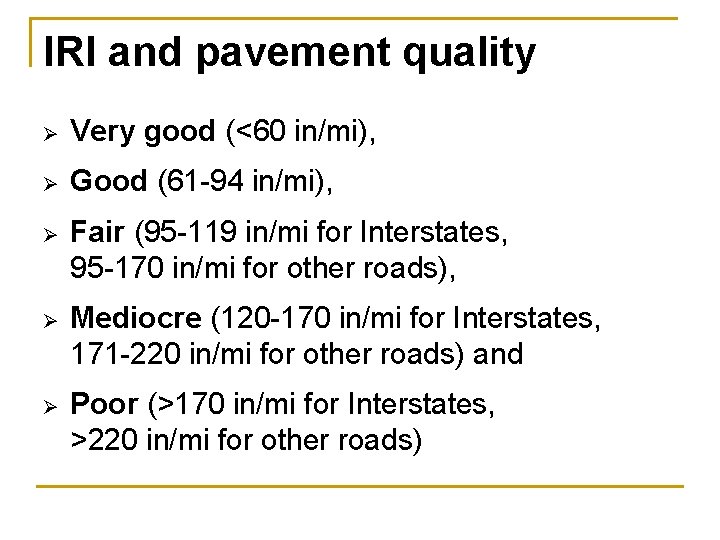
IRI and pavement quality Ø Very good (<60 in/mi), Ø Good (61 -94 in/mi), Ø Fair (95 -119 in/mi for Interstates, 95 -170 in/mi for other roads), Ø Mediocre (120 -170 in/mi for Interstates, 171 -220 in/mi for other roads) and Ø Poor (>170 in/mi for Interstates, >220 in/mi for other roads)
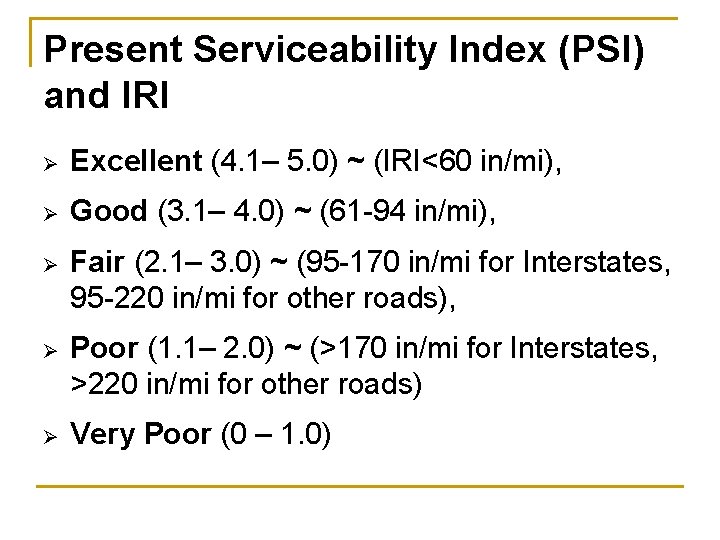
Present Serviceability Index (PSI) and IRI Ø Excellent (4. 1– 5. 0) ~ (IRI<60 in/mi), Ø Good (3. 1– 4. 0) ~ (61 -94 in/mi), Ø Fair (2. 1– 3. 0) ~ (95 -170 in/mi for Interstates, 95 -220 in/mi for other roads), Ø Poor (1. 1– 2. 0) ~ (>170 in/mi for Interstates, >220 in/mi for other roads) Ø Very Poor (0 – 1. 0)
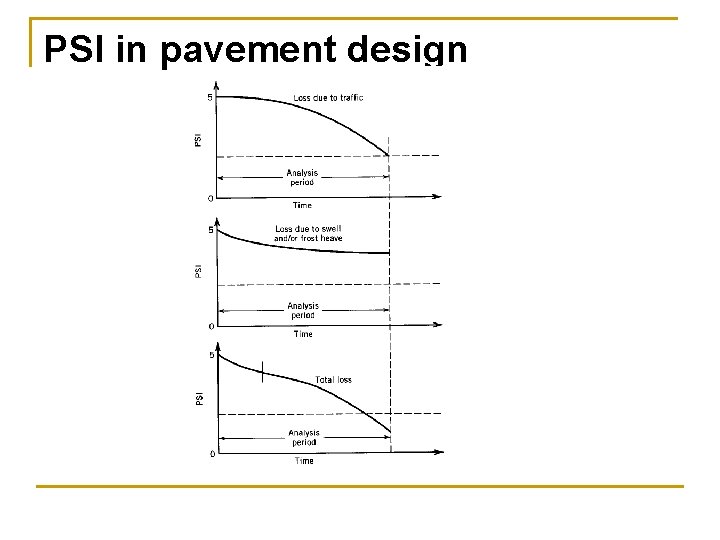
PSI in pavement design
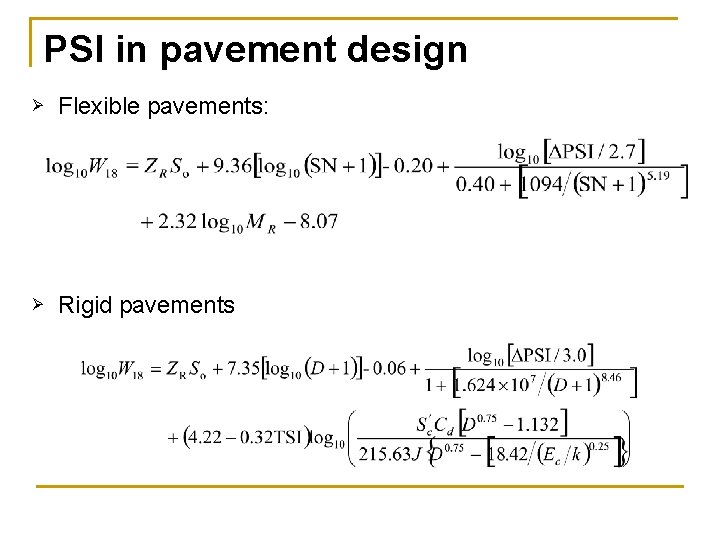
PSI in pavement design Ø Initial and terminal PSI used in pavement design equations Ø Terminal PSI is critical in determining Load Equivalency Factors to get W 18
PSI in pavement design Ø Flexible pavements: Ø Rigid pavements
Study Motivation Ø To determine how user perceptions of pavement roughness (the intent of PSI) relate to the IRI and other factors
What makes a road feel rough?
Factors likely to determine roughness opinion Ø Socioeconomic (age, income, etc. ) Ø Type of vehicle driven Ø Interior noise level Ø Passenger expectations when driving from one pavement condition to the next Ø Physical measures of pavement condition
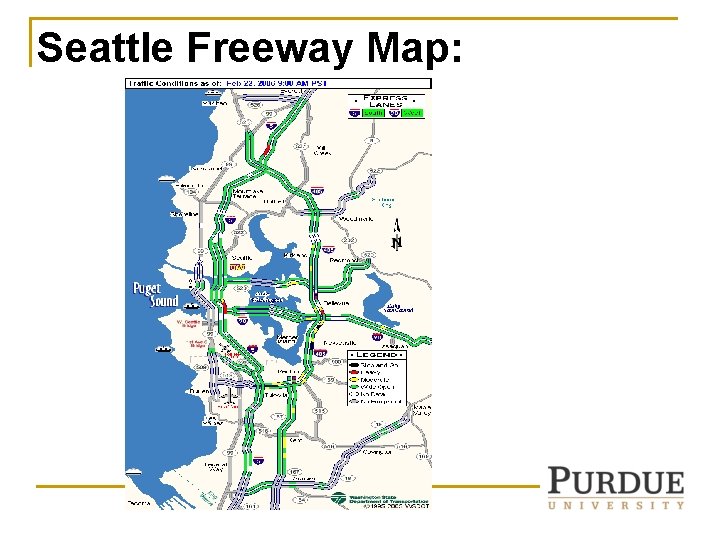
Study approach: Ø Ø Have 56 individuals drive a variety of vehicles (mid-sized sedan, sport-utility vehicle, pick-up truck, minivan) Individuals drive over a circuit of Seattle freeways that includes 40 segments with detailed data from pavement databases (IRI, Pavement structural condition, patching, pavement type, etc. )
Seattle Freeway Map:
Study approach (continued): Ø In addition to physical pavement measurements, on the 40 sections data are collected on: Ø 1(smooth) to 5 (rough) scale of roughness impression Ø Interior vehicle noise Ø Vehicle speed Ø Weather conditions Ø Pavement surface (wet or dry)
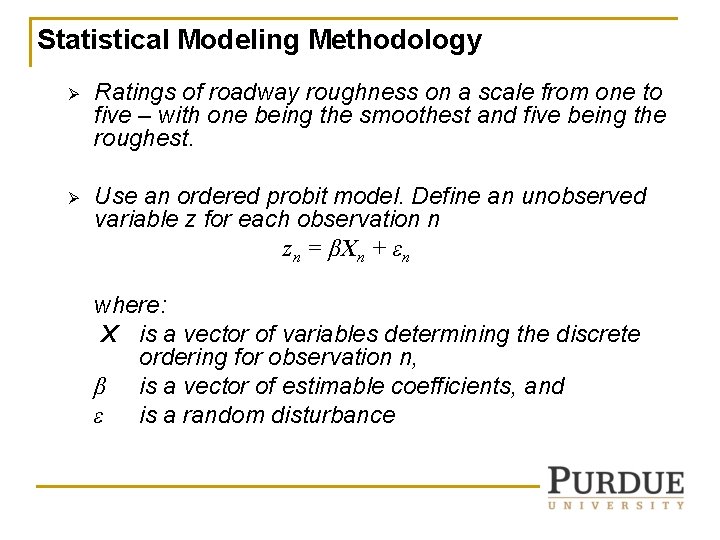
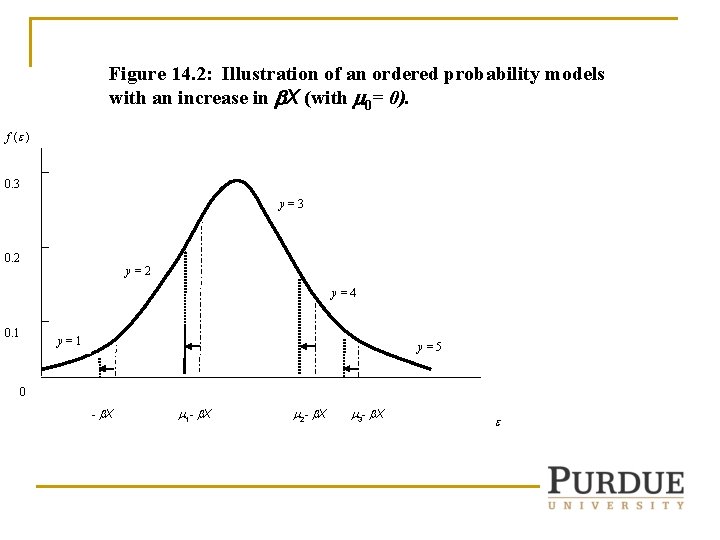
Statistical Modeling Methodology Ø Ratings of roadway roughness on a scale from one to five – with one being the smoothest and five being the roughest. Ø Use an ordered probit model. Define an unobserved variable z for each observation n zn = βXn + εn where: X is a vector of variables determining the discrete ordering for observation n, β is a vector of estimable coefficients, and ε is a random disturbance
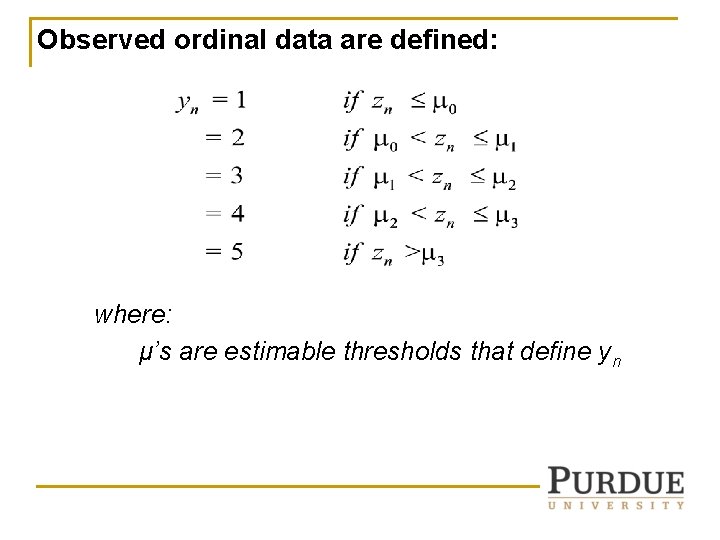
Observed ordinal data are defined: where: μ’s are estimable thresholds that define yn
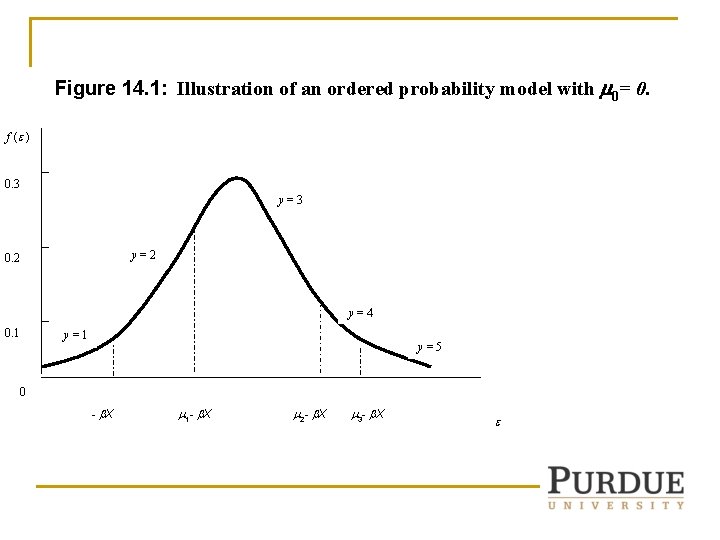
Figure 14. 1: Illustration of an ordered probability model with 0= 0. f ( ) 0. 3 y=2 0. 2 y=4 0. 1 y=5 0 - X 1 - X 2 - X 3 - X
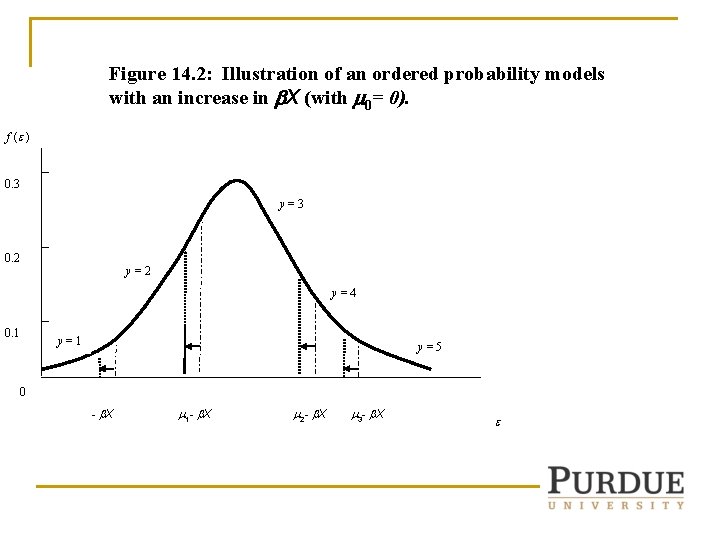
Figure 14. 2: Illustration of an ordered probability models with an increase in X (with 0= 0). f ( ) 0. 3 y=3 0. 2 y=4 0. 1 y=5 0 - X 1 - X 2 - X 3 - X
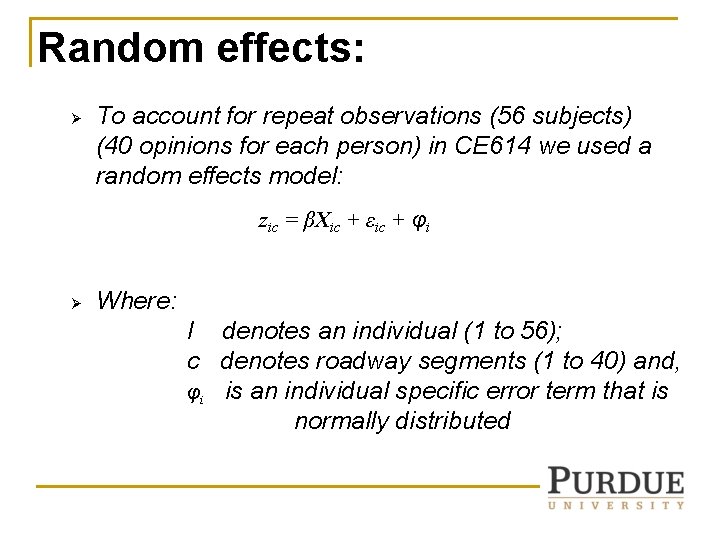
Random effects: Ø To account for repeat observations (56 subjects) (40 opinions for each person) in CE 614 we used a random effects model: zic = βXic + εic + φi Ø Where: I denotes an individual (1 to 56); c denotes roadway segments (1 to 40) and, φi is an individual specific error term that is normally distributed
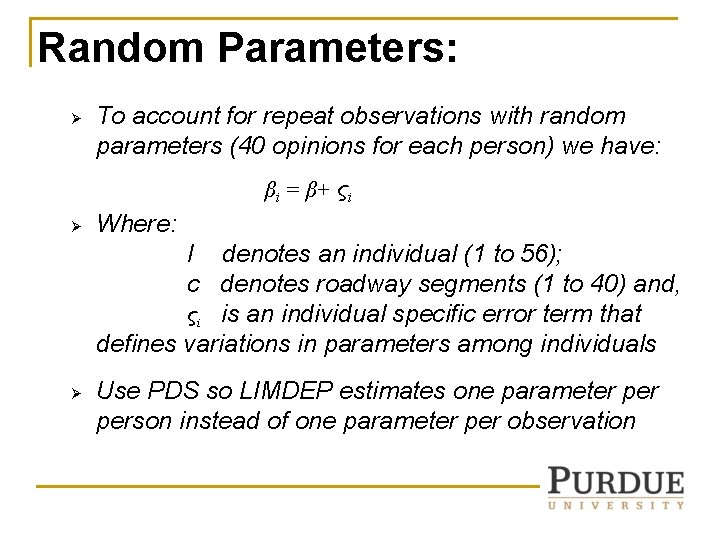
Random Parameters: Ø To account for repeat observations with random parameters (40 opinions for each person) we have: βi = β+ ςi Ø Where: I denotes an individual (1 to 56); c denotes roadway segments (1 to 40) and, ςi is an individual specific error term that defines variations in parameters among individuals Ø Use PDS so LIMDEP estimates one parameter person instead of one parameter per observation
General results (midsized vehicle) Poor (170 in/mi)
General results (SUV) Poor (170 in/mi)
General results (pickup truck) Poor (170 in/mi)
General results (minivan) Poor (170 in/mi)
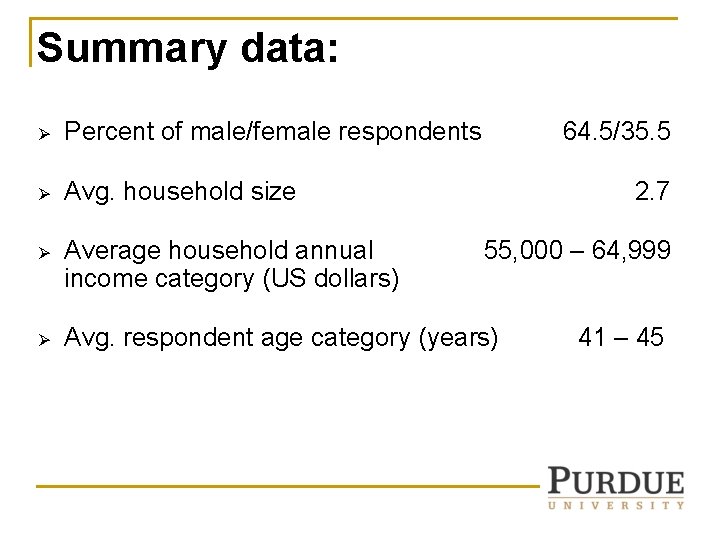
Summary data: Ø Percent of male/female respondents 64. 5/35. 5 Ø Avg. household size Ø Average household annual income category (US dollars) Ø Avg. respondent age category (years) 2. 7 55, 000 – 64, 999 41 – 45
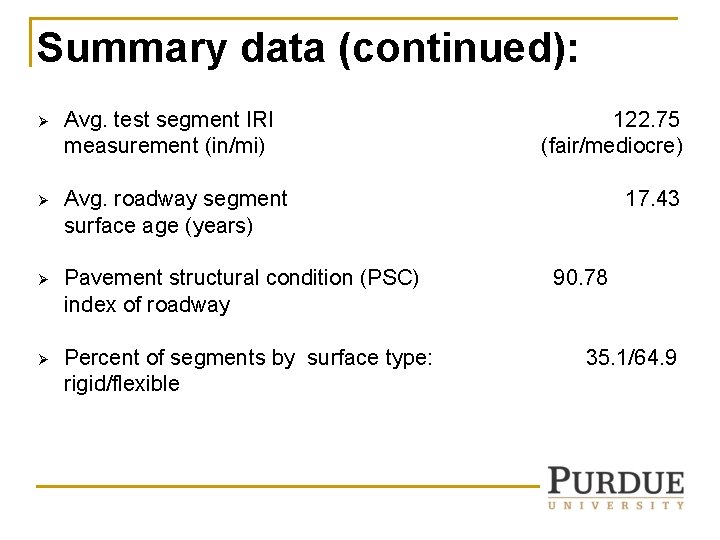
Summary data (continued): Ø Avg. test segment IRI measurement (in/mi) Ø Avg. roadway segment surface age (years) Ø Pavement structural condition (PSC) index of roadway Ø Percent of segments by surface type: rigid/flexible 122. 75 (fair/mediocre) 17. 43 90. 78 35. 1/64. 9
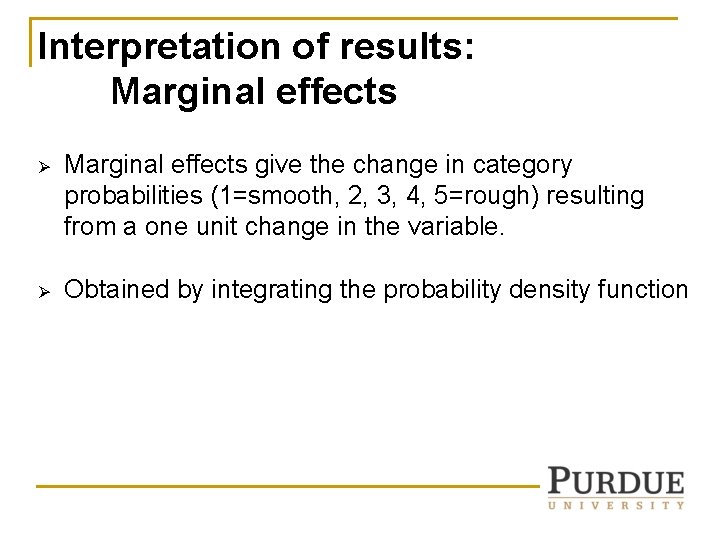
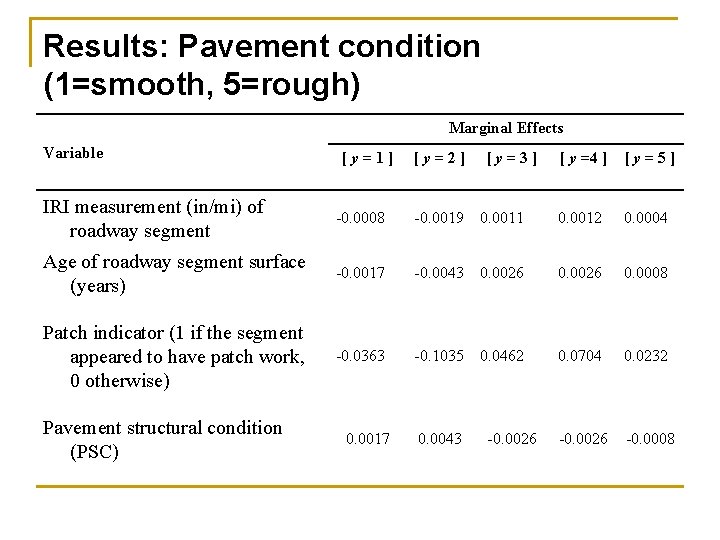
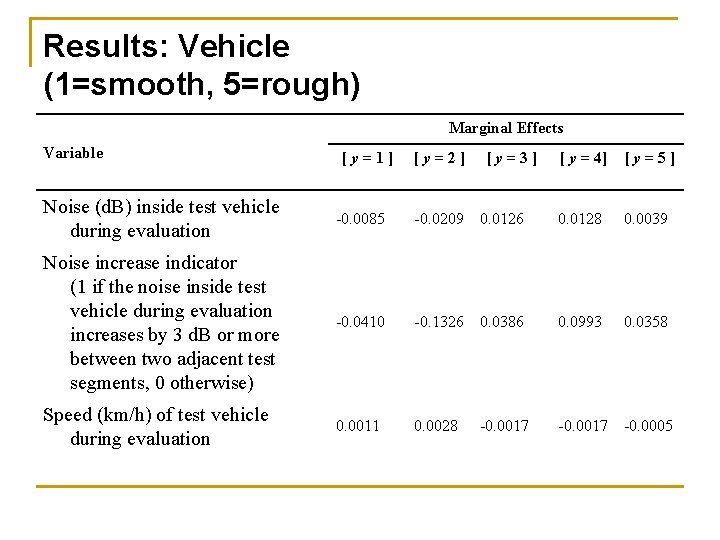
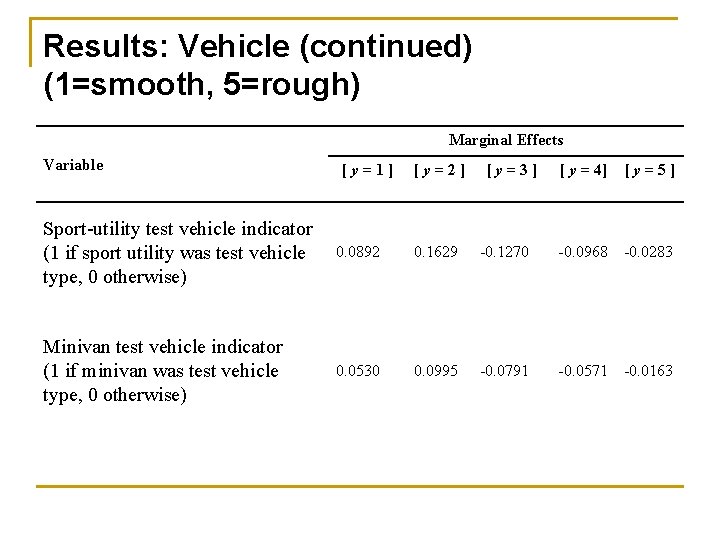
Interpretation of results: Marginal effects Ø Marginal effects give the change in category probabilities (1=smooth, 2, 3, 4, 5=rough) resulting from a one unit change in the variable. Ø Obtained by integrating the probability density function
Figure 14. 2: Illustration of an ordered probability models with an increase in X (with 0= 0). f ( ) 0. 3 y=3 0. 2 y=4 0. 1 y=5 0 - X 1 - X 2 - X 3 - X
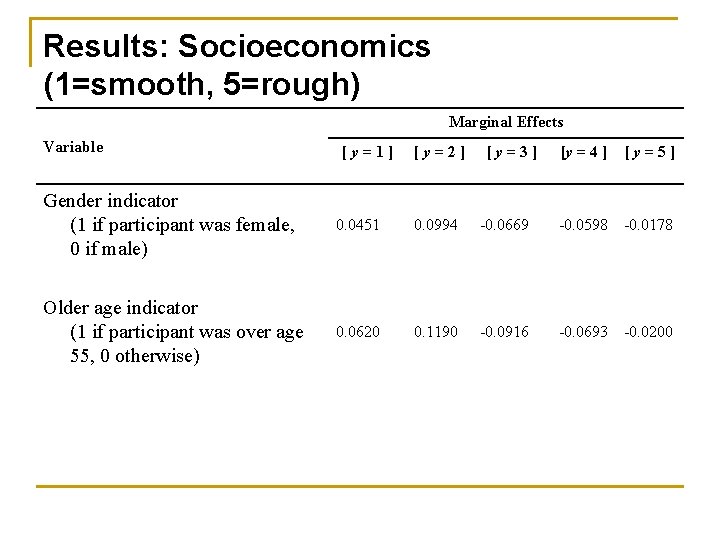
Results: Socioeconomics (1=smooth, 5=rough) Marginal Effects Variable [y=1] [y=2] [y=3] [y = 4 ] [y=5] Gender indicator (1 if participant was female, 0 if male) 0. 0451 0. 0994 -0. 0669 -0. 0598 -0. 0178 Older age indicator (1 if participant was over age 55, 0 otherwise) 0. 0620 0. 1190 -0. 0916 -0. 0693 -0. 0200
Results: Pavement condition (1=smooth, 5=rough) Marginal Effects Variable [y=1] [y=2] [y=3] [ y =4 ] [y=5] IRI measurement (in/mi) of roadway segment -0. 0008 -0. 0019 0. 0011 0. 0012 0. 0004 Age of roadway segment surface (years) -0. 0017 -0. 0043 0. 0026 0. 0008 Patch indicator (1 if the segment appeared to have patch work, 0 otherwise) -0. 0363 -0. 1035 0. 0462 0. 0704 0. 0232 0. 0017 0. 0043 -0. 0026 -0. 0008 Pavement structural condition (PSC) -0. 0026
Results: Vehicle (1=smooth, 5=rough) Marginal Effects Variable [y=1] [y=2] [y=3] [ y = 4] [y=5] Noise (d. B) inside test vehicle during evaluation -0. 0085 -0. 0209 0. 0126 0. 0128 0. 0039 Noise increase indicator (1 if the noise inside test vehicle during evaluation increases by 3 d. B or more between two adjacent test segments, 0 otherwise) -0. 0410 -0. 1326 0. 0386 0. 0993 0. 0358 Speed (km/h) of test vehicle during evaluation 0. 0011 0. 0028 -0. 0017 -0. 0005
Results: Vehicle (continued) (1=smooth, 5=rough) Marginal Effects Variable [y=1] [y=2] [y=3] [ y = 4] [y=5] Sport-utility test vehicle indicator (1 if sport utility was test vehicle type, 0 otherwise) 0. 0892 0. 1629 -0. 1270 -0. 0968 -0. 0283 Minivan test vehicle indicator (1 if minivan was test vehicle type, 0 otherwise) 0. 0530 0. 0995 -0. 0791 -0. 0571 -0. 0163
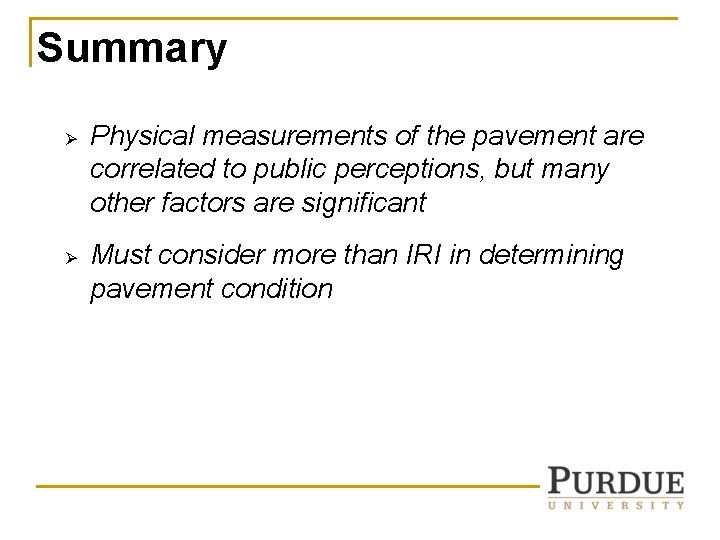
Summary Ø Ø Physical measurements of the pavement are correlated to public perceptions, but many other factors are significant Must consider more than IRI in determining pavement condition
Assignment #1 See Example 14. 2 on page 354 See: Shafizadeh, K. , Mannering, F. , 2006. Statistical modeling of user perceptions of infrastructure condition: An application to the case of highway roughness. Journal of Transportation Engineering 132(2), 133 -140.