Trends in AfricanAmerican Marriage Patterns Steven Ruggles and


 Harmonized census microdata spanning the period from")


.")
. n Or, generational")

")
 n Research will be conducted in Census Bureau Research")
 n For each commuting zone, we will construct measures")
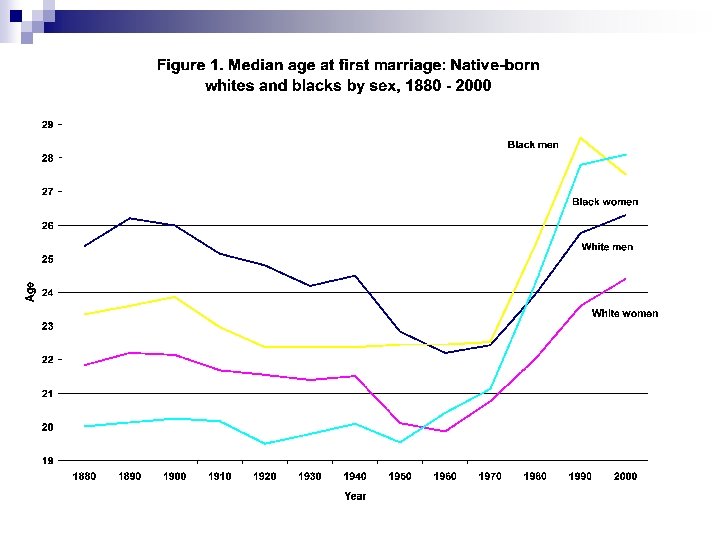
 Median")


- Slides: 77
Trends in African-American Marriage Patterns Steven Ruggles and Catherine Fitch Data collection funded by the National Science Foundation and the National Institutes of Health
We have three big questions: 1. Why was there no postwar marriage boom among blacks? 2. Why did black marriage rise so rapidly after 1970? 3. Why did the traditional gender pattern of marriage reverse among blacks after 1990?
No marriage boom for black men
Or women
Extraordinary increase in marriage age, 1970 -1990
Reversal of traditional sex pattern of marriage
Data: Integrated Public Use Microdata Series (IPUMS-USA) Harmonized census microdata spanning the period from 1850 to 2000 with user-friendly access, integrated comprehensive hypertext documentation. IPUMS makes analysis of long run change easy. http: //ipums. org
Although we have three nice questions, we have fewer answers. n Absence of a black marriage boom: –we have that one covered n Rise of black marriage 1970 -1990: –I will briefly summarize our pending proposal n Reversal of traditional gender pattern –some preliminary results
Question 1. Why was there no black marriage boom?
No marriage boom for blacks
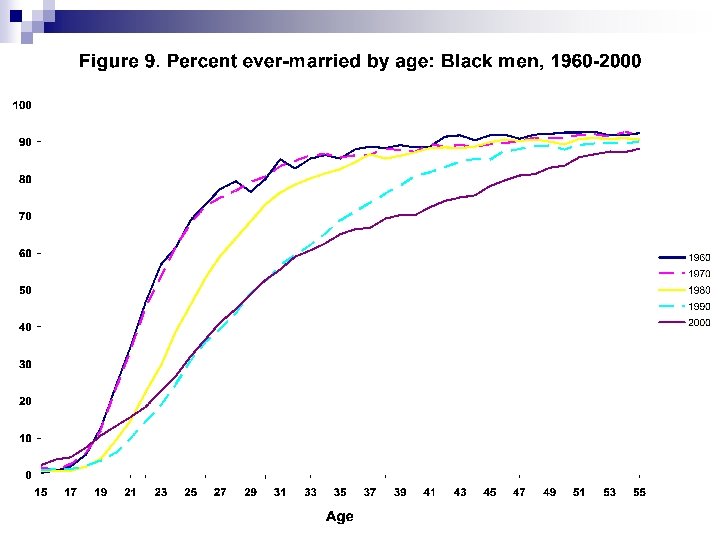
Marriage distribution: No marriage boom for black men
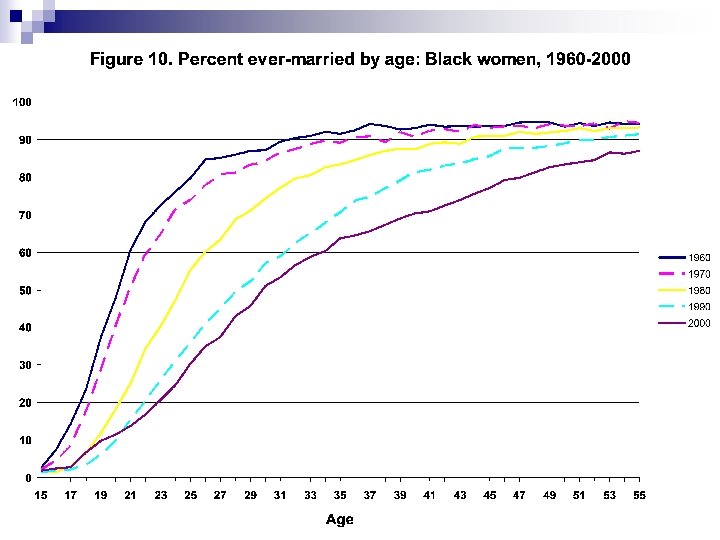
Virtually no marriage boom for black women
Methodological interlude
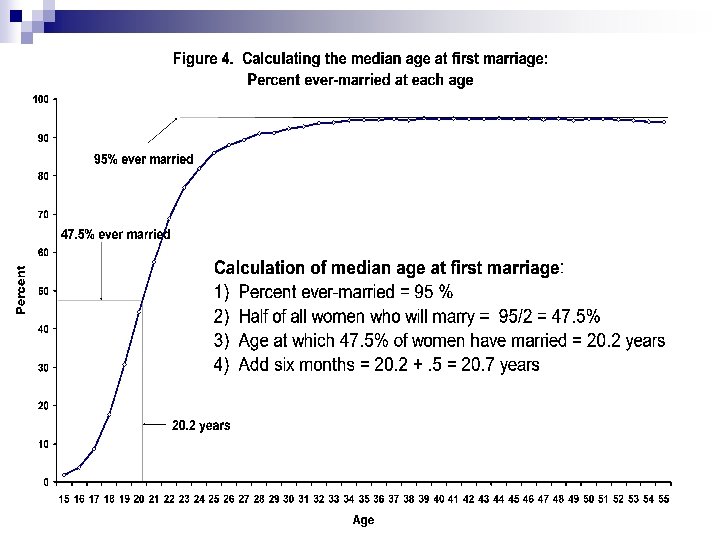
To investigate differentials, we shift our measures from median marriage and marriage distribution to percent of young people never married. n The indirect median age at marriage is unreliable in periods of rapid change (this is particularly important for answering question 3). n It also doesn’t allow us to look at differentials between most population subgroups, since people change their characteristics as they age. Here is how the indirect median is calculated:
The indirect median has been the principal measure of marriage in the U. S. for a century, but it is now unreliable. With the rapid change in marriage patterns since 1960 we cannot predict how many people will eventually marry, so estimates are increasingly biased upwards. Also, indirect median is no good for studying differentials in characteristics that change over the life course, like socioeconomic status. So, forget about marriage age: we will focus on percent of young people never-married.
Note: SMAM is even worse.
Trend in percent never married is closely similar to trend in marriage age, but there is a slight bump in marriage for black men from 1950 to 1970
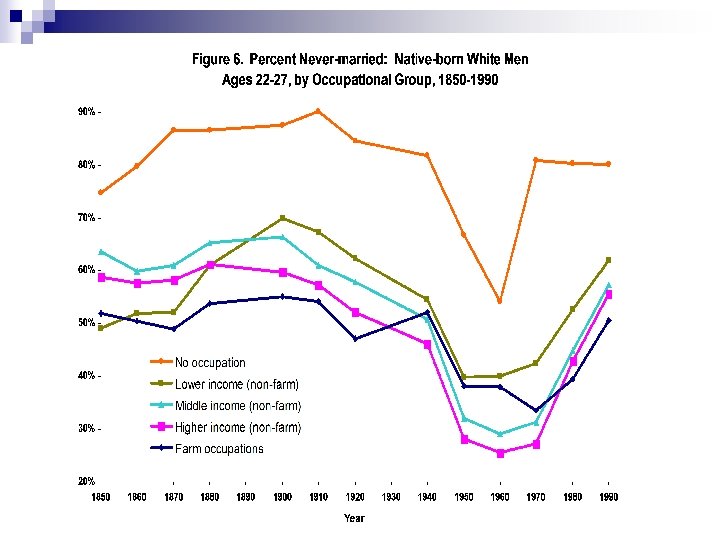
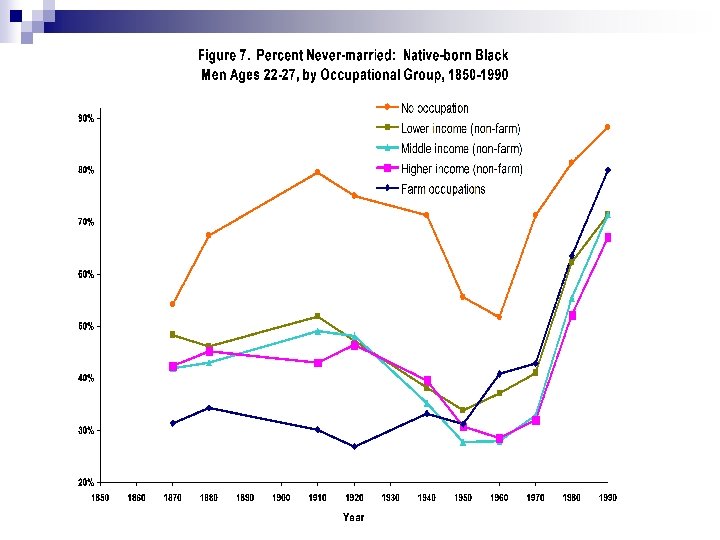
Among white men, there was a marriage boom in every occupational group. But check out what happens when we do the same thing for blacks:
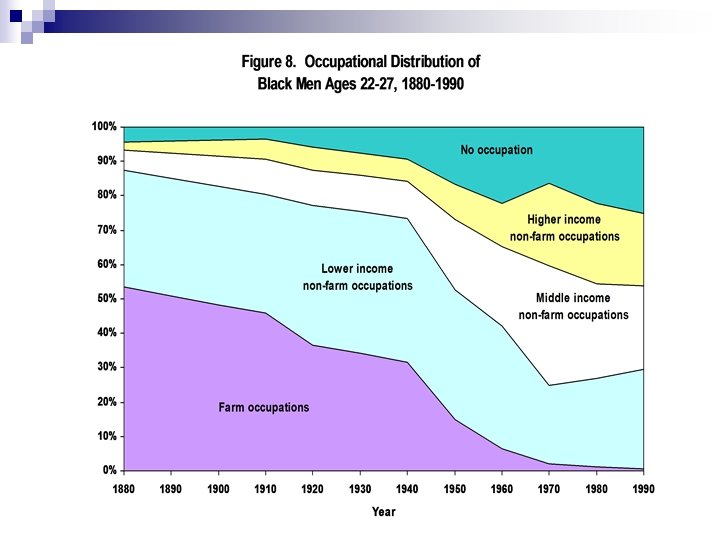
Among black men, there was a marriage boom in every occupational group except for farming. What was happening to the black occupational distribution?
Conclusion 1: n After the war, blacks were forced off southern farms by mechanization and consolidation of sharecropping farms. n This resulted in massive dislocation and a rise of young men with no occupation. n Without the shift from farming into no occupation, there would have been a substantial black post-war marriage boom. n There was no marriage boom for blacks because there was no economic boom for blacks.
3 key graphs again, reverse order:
Take the occupational distribution. . .
multiply by unmarried in each group. . .
. . . and the marriage boom for blacks evaporates.
Question 2. What caused the extraordinary rise of black marriage after 1970?
Extraordinary increase in marriage age, 1970 -1990
Hypothesis 1. Declining male opportunity n Marriage boom resulted from rising prosperity, job security, optimism (Glick and Carter 1958); declining male opportunities in 1970 s and 1980 s, especially among blacks, reversed the trend (Wilson 1987 and many others). n Increasing economic uncertainty (Oppenheimer 1988) and inequality (Gould and Paserman 2003) compounded the problem.
Hypothesis 2. Rising female opportunity n Growing economic opportunities for women increased marriage age. ¨ Decreased dependence on a spouse, opened alternatives to marriage (Cherlin 1980). ¨ Undermined sex-role specialization and reduced the value of marriage (Becker 1981).
Hypotheses, continued n These theories predict a positive association between male economic opportunity and early marriage, and an inverse association for female opportunity. n Historically, these relationships have been strong, but recent evidence that the relationship may have reversed for women (e. g. Oppenheimer and Lew 1995)
Hypotheses-continued n Or, maybe it is cultural change (Mc. Lanahan 2004: The Feminist Revolution). n Or, increasing difficulty in establishing households because of rising housing costs. n Or, AFDC/TANF (pretty implausible as an explanation, but we will stick it in as a control).
Hypotheses-continued n Or, availability of potential spouses (especially nonincarcerated working spouses). n Or, generational shifts in economic opportunity (Easterlin thesis).
Past studies that attempted to assess relationship between economic opportunities for men and women at the local level on marriage formation ran into data limitations, especially for blacks. We need microdata to construct sensitive and comparable measures of economic opportunity and other explanatory variables, but available samples are too small and have lousy geographic information (especially before 1980).
Fitch and Ruggles Research Proposal: n We will use internal long-form data (1960 -2000) being constructed by the Census Bureau’s National Historical Census Files Project (with the support of IPUMS Redesign project). n Long-form data provides information on between 40 and 45 million persons in each census year with full census geography.
Fitch and Ruggles Proposal (continued) n Research will be conducted in Census Bureau Research Data Center to ensure confidentiality. n We will construct 1980 commuting zones (Tolbert and Killian 1987) for each census year to serve as the basis for measures of local area characteristics.
Fitch and Ruggles Proposal (continued) n For each commuting zone, we will construct measures of wage levels, inequality, housing, labor-force participation, and spouse availability. n Measures calculated separately for non-Hispanic whites, blacks, and Hispanics of each sex. n Measures standardized to control for variation in marital status and age to avoid endogeneity.
Commuting-zone measures of wages and inequality Wage and salary income (level and distribution) Median log wages Proportion of individuals with salary below 2000 poverty threshold for a family of four ($17, 463) Proportion of individuals with wages over three times the 2000 poverty threshold for a family of four ($52, 389) Standard deviation of log wages Difference in wages between 90 th and 10 th percentiles Difference in wages between 50 th and 90 th percentiles Ratio of median wages at age 20 -29 to median wages at age 40 -59
Commuting zone measures of participation, welfare, housing, and spouse availability Labor force participation and unemployment Proportion employed 35+ hours for 50+ weeks Proportion employed part-time Proportion unemployed Welfare generosity (state level) AFDC/TANF maximum benefit levels Housing Index of local housing costs (rental and home value) Percent of home ownership Spouse availability Age-specific sex ratio Male Marriageable Pool Index (MMPI), no income control (Lichter et al. 1992, Wilson 1987) MMPI with income control (Lichter et al. 1992)
Analysis n Mixed-effect multi-level models to assess changing impact of local economic and demographic conditions on marriage probabilities n Separate models for each census year n Pooled models for each pair of years, to make counterfactual predictions (estimate the net structural effects of each economic change in each decade while controlling for relevant background variables)
Conclusion 2: The sources of the unprecedented rise in black marriage between 1970 and 1990 need further study with better data.
Question 3. Why did the traditional gender pattern of marriage reverse among blacks after 1990?
Reversal of traditional sex pattern of marriage
The median age at marriage for black men decreased between 1990 and 2000 and is now younger than the median age at marriage for black women. We pose three questions: n Is this change real? (i. e. , has there been an increase in the propensity to marry among young black men? ) n What are the proximate determinants of the gender differences in marriage for black men and black women? n What are some possible explanations for this reversal in marriage trends for black men?
Is this change real: What about the underenumeration of young black men? n Historically, young single black men have been disproportionately under-enumerated, leading to underestimated marriage age. n Reports from Census 2000 suggest that the underenumeration of young black men was substantially reduced. n Therefore, errors in marriage estimation resulting from under-enumeration are probably less severe than in previous censuses.
Is this change real? Likely impact of changes in underenumeration If underenumeration of young black men had remained constant, the measured decline in black male marriage between 1990 and 2000 probably would have been even greater.
Is this change real: Could it be a bad measure of marriage age? n In periods of rapid change, calculations of marriage may be biased since we cannot predict the percent of young people who will eventually marry. n We can avoid the problem by examining the changing age pattern of black marital status, 1960 -2000.
Black male age pattern of marriage For men, the pattern in 2000 differs from previous years in two ways. n First, young men (aged 17 -26) are more likely to be married than in 1990. n Second, the percent of men older than 35 years who remained never-married was higher than in any prior census year.
Black female age pattern of marriage n The pattern for women in 2000 suggests a slight increase in the percent of very young women (aged 1821) ever-married. n There was a significant decrease in the percent of women ever-married at every other age. n Magnitude of change since 1960 is extraordinary.
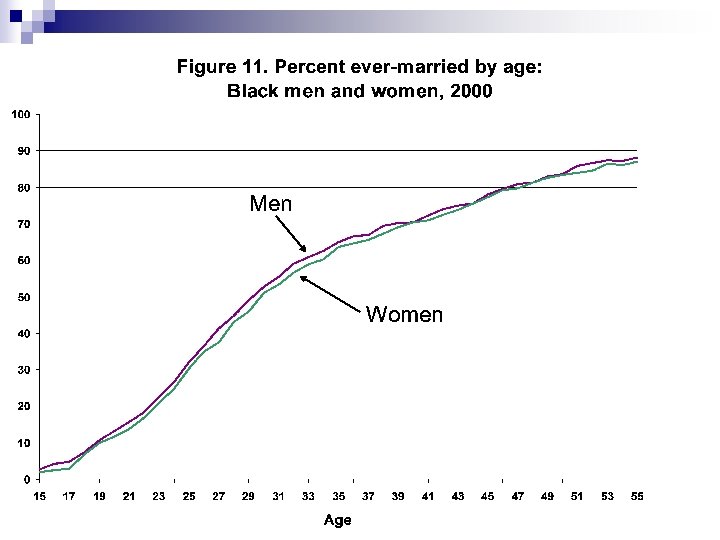
Sex differences in black age pattern of marriage, 2000 n At all ages, black men in 2000 were more often married than black women. n This is very strange. n For both men and women, the curve has flattened dramatically and is now almost linear.
Is this change real? What else could be going wrong? n It is not due to documented Census Bureau allocation or editing procedures (i. e. those identified with flags). n It is not due to differential immigration patterns. n It is not due to the changes in the race question in Census 2000.
Conclusion: It looks real n Even when we ignore indirect medians, there was a large shift in the gender pattern of marriage age. n There was an increase in marriage for young black men, and there was not a similar increase for black women. n At every age, the percent of black men ever-married is greater than the percent of black women ever-married.
Methodological note: One more point about indirect medians The slope of the curve in the peak-marrying years was far flatter in 2000 than in any previous census, so estimates of marriage are increasingly sensitive to errors in the percent of eventual non-marriage.
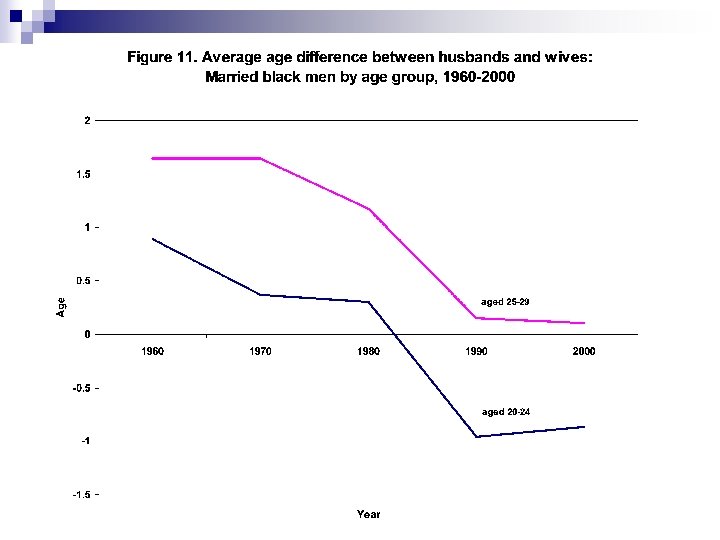
What are the proximate determinants of the gender differences in marriage for black men and women? If under-enumeration, bad data, or immigration are not factors, the potential proximate determinants are: 1. Change in the average difference between spouses 2. Change in differential rate of intermarriage for black men and black women
Changes in mean age intervals between spouses n In 2000, men aged 20 -24 years were almost a year younger than their wives on average; men aged 25 to 29 average only a tenth of year older than their wives. n There was not, however, a large change in mean age intervals between 1990 and 2000.
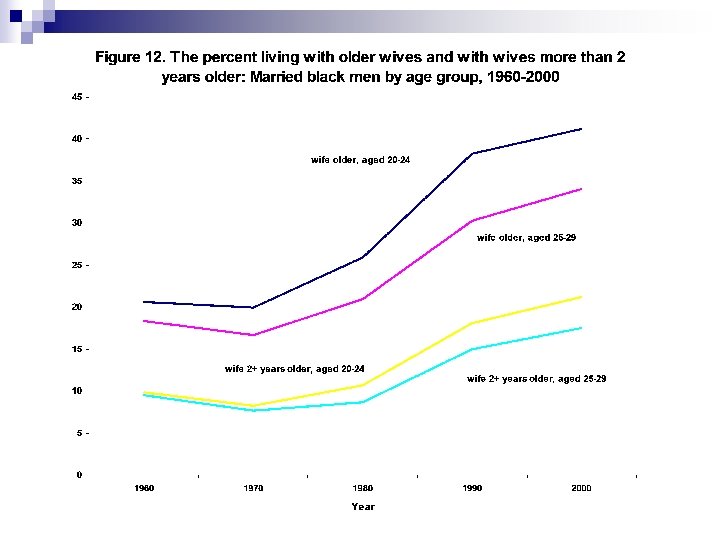
Changes in percent of older wives There was, however, an increase between 1990 and 2000 in the percent of men with older wives, particularly men with wives more than 2 years older.
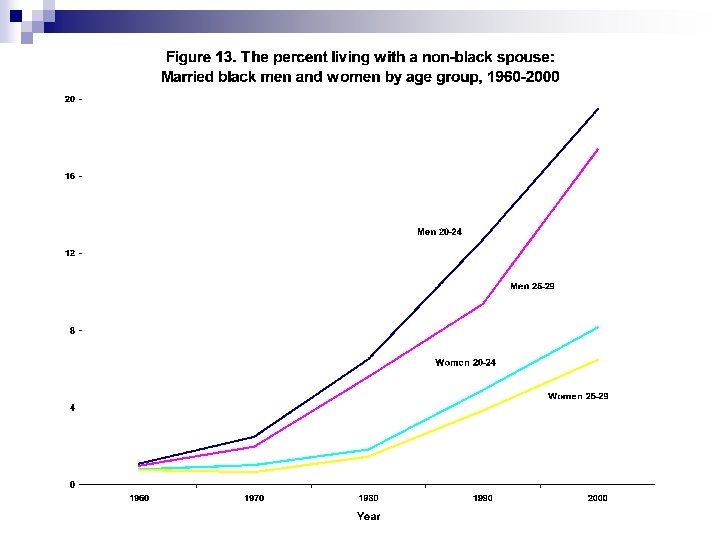
Intermarriage n Young black men are out-marrying at very high rates (much higher than among women), allowing marriage formation to increase for black men and to continue to decline for black women. n In all years and both age groups, black men married nonblack women at least twice as often as black women married non-black men. n The increase in intermarriage between 1990 and 2000 was much greater for men than for women.
Proximate determinants: conclusions n The increase in marriage formation among young black men during the 1990 s resulted partly from the extraordinary increase in intermarriage of young black men, reflecting shifting social norms. n The increase in the percent of black men with older wives also contributed to the reversal in the traditional gender pattern of marriage. n The sources of change in age intervals are murky.
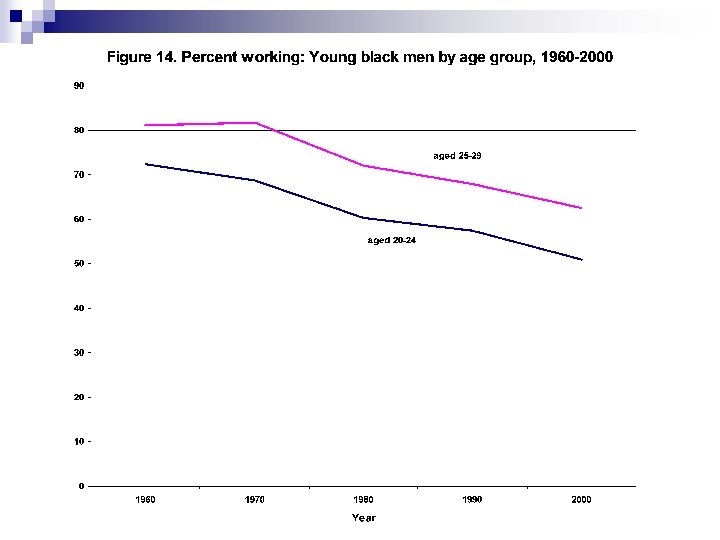
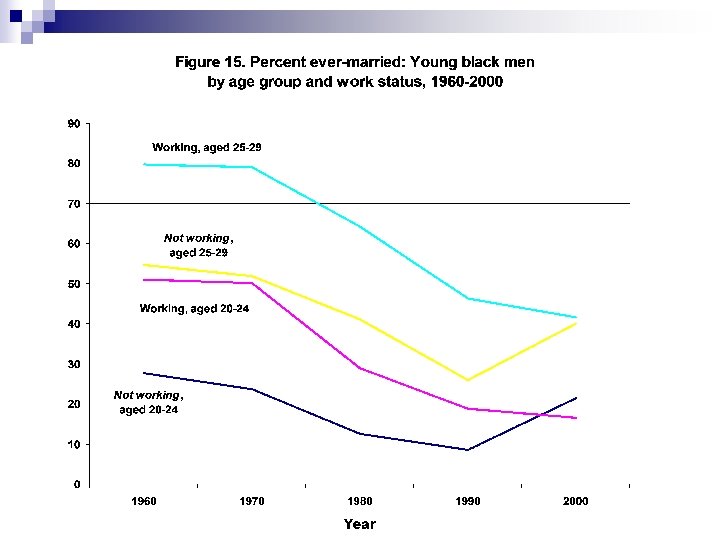
What are some possible explanations for the reversal in marriage trends for black men? n We hypothesized that the economic boom of the 1990 s increased economic opportunities for young black men, which encouraged marriage formation. n We were wrong. n Measured by employment, economic circumstances did not improve for young black men.
The effect of male employment disappeared n Even more surprising, the traditional relationship between employment and marriage disappeared in 2000. n Among young black men who worked, marriage continued to decline between 1990 and 2000.
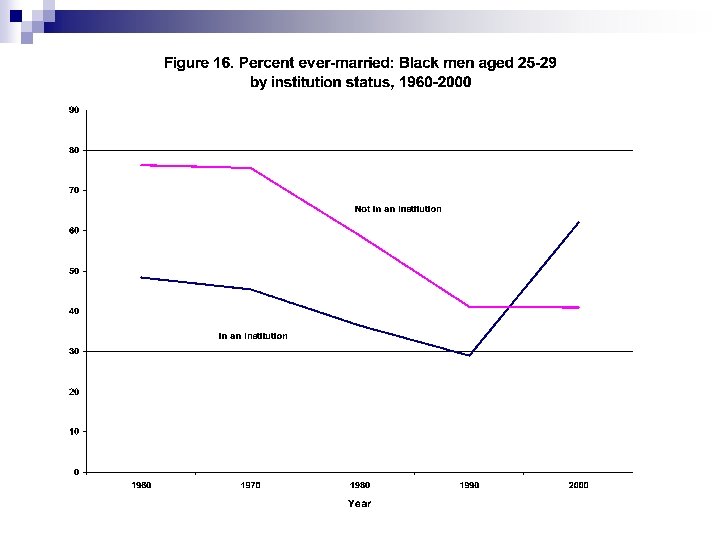
The rise in marriage for black men was confined to those who were not employed n Further investigation of the characteristics of the nonworking married population revealed that many were living in institutions. n In 2000, the percent ever-married among men in institutions increased dramatically, and the percent evermarried among the non-institutional population was virtually unchanged.
The increase in black male marriage in 2000 does not appear to be related to improved economic circumstances. Marriage increased among the non-working population, particularly among institutional inmates. We offer a free IPUMS mug to anyone with a plausible explanation for this change. * * while supplies last
Conclusions n The absence of a post-war marriage boom for blacks is connected to the dislocation associated with the precipitous decline of farming. n There a lot of possible explanations for the extraordinary rise in marriage between 1970 and 1990, and we have a plan for investigating them. n We really don’t have a clue about why there was a marriage boom after 1990 among non-employed and institutionalized black men.
Additional information about our data at http: //ipums. org “Use it for good, never for evil. ” Thank you. Steven Ruggles ruggles@pop. umn. edu http: //ipums. org