The Standard Data Mining Problem Definition Terminology Meta

The Standard Data Mining Problem • Definition • Terminology - Meta. Neural Format - Features, response and ID - Classification versus regression - Modeling/Feature detection - Training/Validation/Calibration • Outliers, rare events and minority classes • Data Preparation - Data cleansing - Scaling • Jacknife and bootstrap validation • Confusion matrix and ROC curves • Conclusions

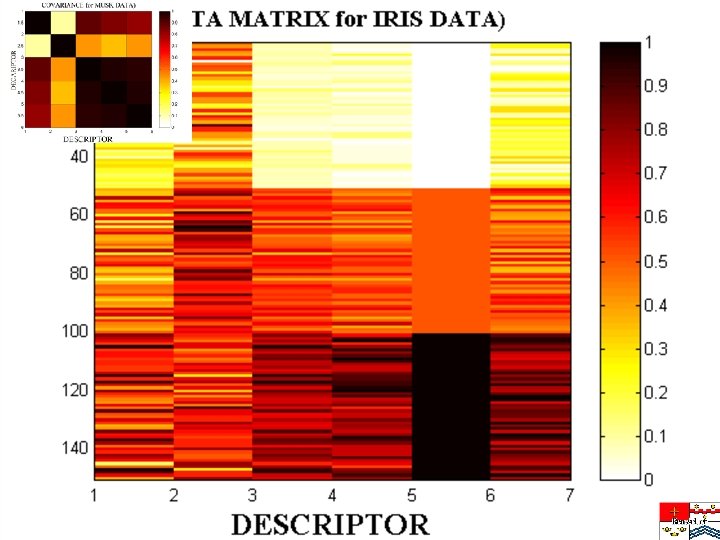
TERMINOLOGY • Standard Data Mining Problem • Meta. Neural Format - descriptive features - response (to predict) - pattern ID - data matrix ANM= {aij} for i = 1 to N and j = 1 to M • Validation/Calibration • Training/Validation/Test Set


Datafile Name: Fisher's Iris UC URVINE DATA REPOSITORY Datafile Subjects: Agriculture , Famous datasets Story Names: Fisher's Irises Reference: Fisher, R. A. (1936). The Use of Multiple Measurements in Axonomic Problems. Annals of Eugenics 7, 179 -188. Authorization: free use Description: This is a dataset made famous by Fisher, who used it to illustrate principles of discriminant analysis. It contains 6 variables with 150 observations. Number of cases: 150 Variable Names: 1. Species_No: Flower species as a code 2. Species_Name: Species name 3. Petal_Width: Petal Width 4. Petal_Length: Petal Length 5. Sepal_Width: Sepal Width 6. Sepal_Length: Sepal Length


©Inxight Eureka from Inxight Software, Inc. 2001. All Rights Reserved

Cluster Dispersion Measure • For good clustering cluster dispersion should be small • Cluster dispersion is the sum of the distances of all the cluster members from to cluster prototypes • For all the clusters!!!

K-Means Clustering • • Specify number of clusters Select cluster prototypes at random 1. Calculate cluster dispersion 2. Calculate new prototypes 3. Check convergence • • • If converged try with different initial prototypes Inspect/calibrate/validate results Vary number of clusters

Random selection for cluster prototypes

Updated prototypes

K-Means Clustering – fine points • What is the right number of clusters? • Do I have to use an Euclidean metric? • Is minimizing cluster dispersion the right objective? • Mahalanobis scaling • How to choose the right initial prototypes? • The curse of dimensionality • Calibration with jack-knife or bootstrapping

Distance Metrics y d. E a 1 y - a 2 y a 2 x - a 1 x x

Mahalanobis Scaling Average Standard deviation

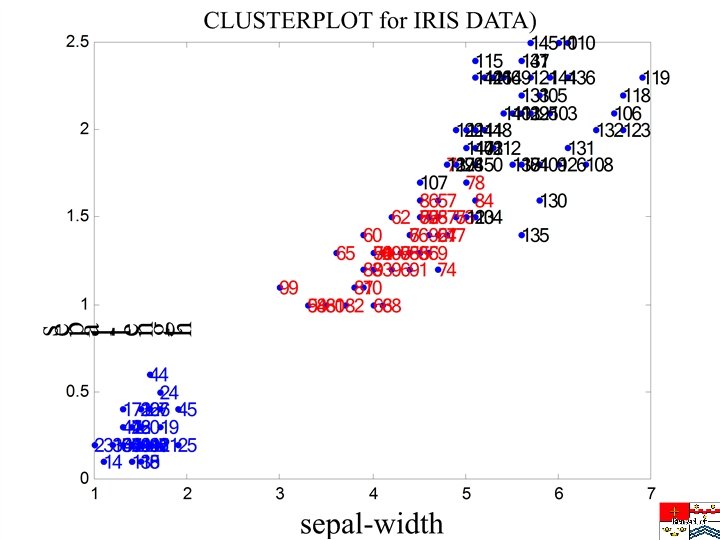
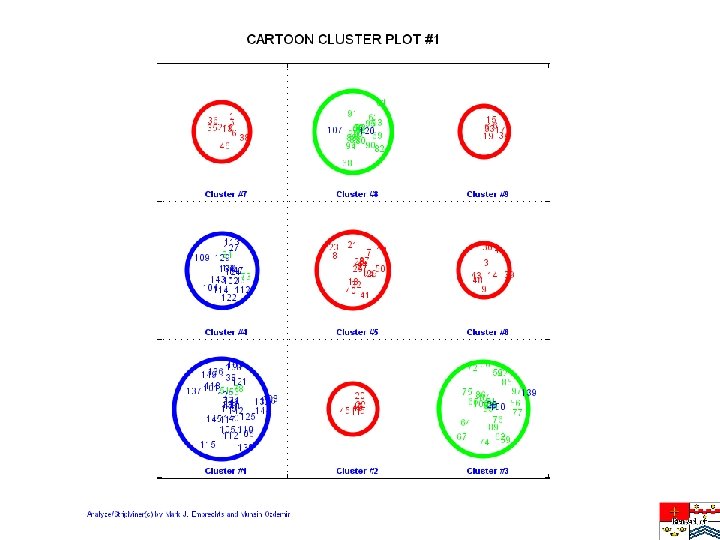
Calibration and Validation • What we are ultimately interested in is not the dispersion - are similar patterns grouped together in the same cluster? - are different patterns a different clusters? - one pattern class can be divided over separate clusters • Are the clusters homogeneous in class? • We generally need more clusters than there are classes • Ordinality versus non-ordinality classes • Cluster calibration • How to define misclassifications? • Misclassification by class and cluster • Confusion matrix • Minority classes • Training set and test set

Fine Points of Clustering with GAs • Use floating point GAs • Do rank-order based selection • Introduce problem-specific mutation and cross-over operators • Formulate the problem so that it is just right for a GA • Introduce a one-iteration K-means gene correction operator • To create Stripminer user’s guide in readme. txt: svm 10 > readme. txt

Strip. Miner Script for Clustering • The file num_eg. txt contains number of clusters • Prototypes will be written in protos. txt • Erase protos. txt before doing a new clustering • If protos. txt is present the code does a calibration • The confusion matrix is in confusion. txt • Generally it is a good idea to scale data first (option -3) • Response field has to be a class number, or 0, or -999

Strip. Miner Genetic Algorithm

Confusion Matrices for 3 and 7 clusters K-means 3 7 GA

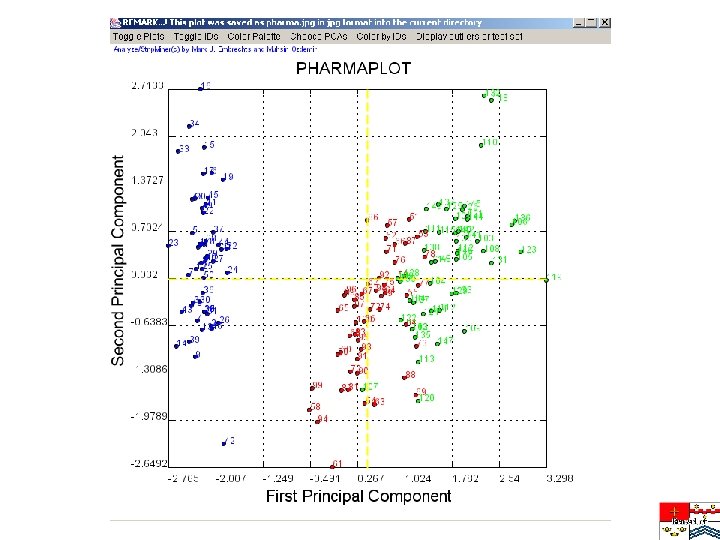
PRINCIPAL COMPONENT ANALYSIS SCRIPT • num_eg. txt contains the number of PCAs • usually data are first Mahalinobis scales, classes remain 1, 2 and 2 • use multiple classes on PCA plot

Confusion matrix Specificity = 50/80 Sensitivity = 150/160

Script for ROC Curve
 – SVM (Support Vector Machines)")
Strip. Miner. TM • Modeling – ANN (Neural Networks) – SVM (Support Vector Machines) – PLS (Partial-Least Squares) – GA-based regression clustering – PCA regression – Local Learning – Outlier Detection (GAMOL) • Learning Modes – Bootstrapping – Bagging – Boosting – Leave-one-out cross-validation • Feature Selection – Sensitivity Analysis – Genetic Algorithms – Correlation GA (GAFEAT) – Method specific • Data Processing – Interface with RECON – Different Scaling Modes – Outlier detection/data cleansing • Visualization – Correlation Plots – 2 -D Sensitivity Plots – Outlier Visualization Plots – Different Scaling Options – Cluster Ranking Plots – Standard ROC curves – Continuous ROC curves • Code Specifics – Tight Classic C-code (< 15000 lines) – Script-Based Shell Program – Runs on all Platforms – Ultra Fast – Use: Trans. Scan – GE - KODAK Doppler broadening Macro-Economics Analysis
- Slides: 27