The Potential Impact of Climate Change on Agricultural


/National Center for")

 Kc Ks")

 where ETo is the Penman-Monteith reference or potential evapotranspiration, D is")
: Tdp = Tmin + Kcorr")
 RFD = (RAINFALL – ETo) RFD < 0 MEANS THERE IS")
 Ky = Yield response factor")
 ETcadj = Kc Ks ETo Average Kc = 1. 0 Based")
 Alfalfa 1. 1 Onion 1. 1 Sunflower Banana 1. 2")

 RO = C R R = monthly rainfall C = monthly")
 Si+1 = Ri – ETcadj, i – ROi + Si If")


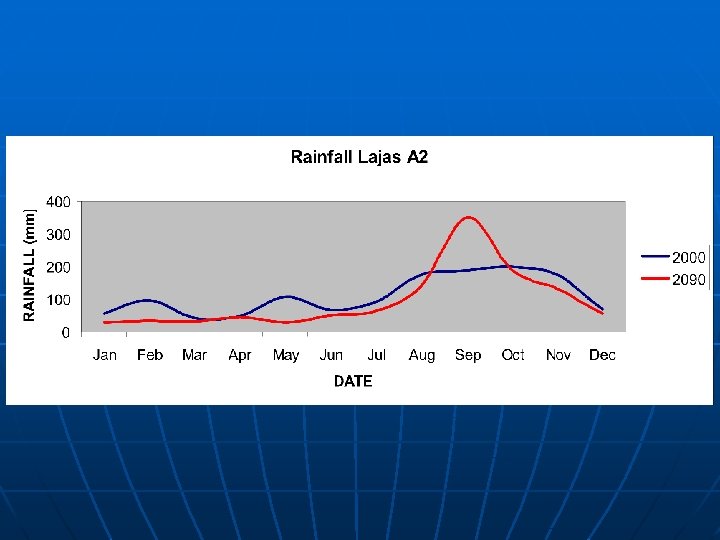
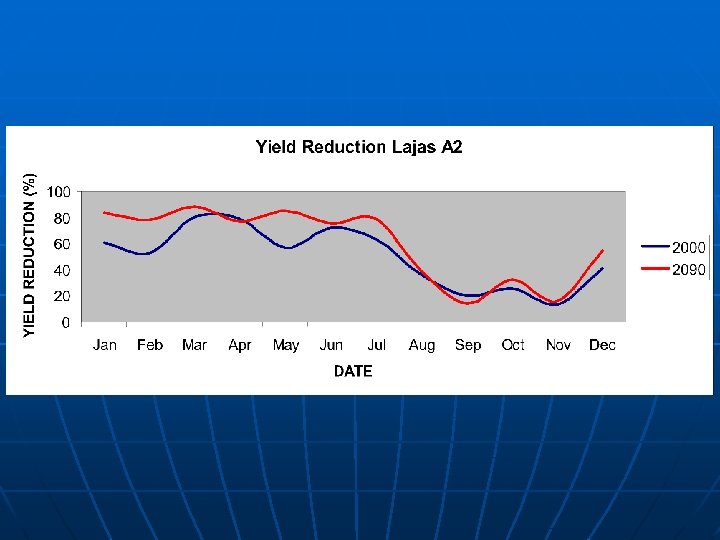
 for Lajas Scenario A 2")

 for Lajas Scenario A 2")


 by Month at Lajas, PR")


- Slides: 63
The Potential Impact of Climate Change on Agricultural in Puerto Rico Dr. Eric W. Harmsen Associate Professor, Dept. of Agricultural and Biosystems Engineering email: eharmsen@uprm. com USDA TSTAR
What might Puerto Rico’s agriculture look like in the future?
One Possible Scenario • Fewer, but more intense tropical storms will cause increased soil erosion, reduce surface water quality and fill our reservoirs with sediment. • Flooding of fields will increase during the wet season, resulting in the loss of crops. • During the dry season, evapotranspiration increases lead to drier soils, which produces crop stress and reduced yields. • Crop water requirements will increase during certain months of the year, therefore the agricultural sector’s demand for water will increase, which may result in water conflicts between different sectors of society. http: //academic. uprm. edu/abe/PRAGWATER
Agenda • Downscaling GCM data • Estimation of Potential ET and rainfall • Penman-Monteith method • Rainfall Deficit (or Excess) • Yield Reduction • Limitations of Climate Modeling • Results Summary • Conclusions and Recommendations • • Example Calculation of Net Irrigation Requirement
Objective The purpose of this study was to estimate evapotranspiration and rainfall deficit (or excess) under climate change conditions for three locations in western Puerto Rico: Adjuntas, Mayagüez and Lajas. Estimates of future crop yields are also provided.
Statistical and Dynamic Downscaling
WHAT IF? n What if questions are routinely addressed in engineering. • What if the dam fails? • What if the wind velocity reaches 150 mph? n What if the climate changes in certain ways, how might agriculture be affected?
METHODS The GCM data were obtained from the Department of Energy (DOE)/National Center for Atmospheric Research (NCAR) Parallel Climate Model (PCM). The scenarios considered were the Intergovernmental Panel on Climate Change (IPCC) a 2 (mid-high CO 2 emission) and b 1 (low CO 2 emission).
Study Area Table 1. Latitude, elevation, average rainfall, average temperature, NOAA Climate Division and distance to the coast for the three study locations. Location Latitude (decimal degree) Elevatio n (m) Annual Rainfall (mm) Adjuntas NOAA Distance Climate to Coast Division (km) Tmean (o. C) Tmin (o. C) Tmax (o. C) 18. 18 549 1871 21. 6 15. 2 27. 9 6 22 Mayaguez 18. 33 20 1744 25. 7 19. 8 30. 5 4 3 Lajas 18. 00 27 1143 25. 3 18. 8 31. 7 2 10
Evapotranspiration (ET) Kc Ks
Comparison of ETo from three different methods
Potential Evapotranspiration (ETo) where ETo is the Penman-Monteith reference or potential evapotranspiration, D is slope of the vapor pressure curve, Rn is net radiation, G is soil heat flux density, g is psychrometric constant, T is mean daily air temperature at 2 -m height, u 2 is wind speed at 2 -m height, es is the saturated vapor pressure and ea is the actual vapor pressure.
Missing Parameters in the Penman. Monteith Equation • ea(Tdp): Tdp = Tmin + Kcorr (Harmsen et al. , 2002) • u 2: Historical averages for NOAA Climate Divisions (Harmsen et al. , 2002) • Rnet: Hargreaves radiation equation • G: Allen et al. , 1998
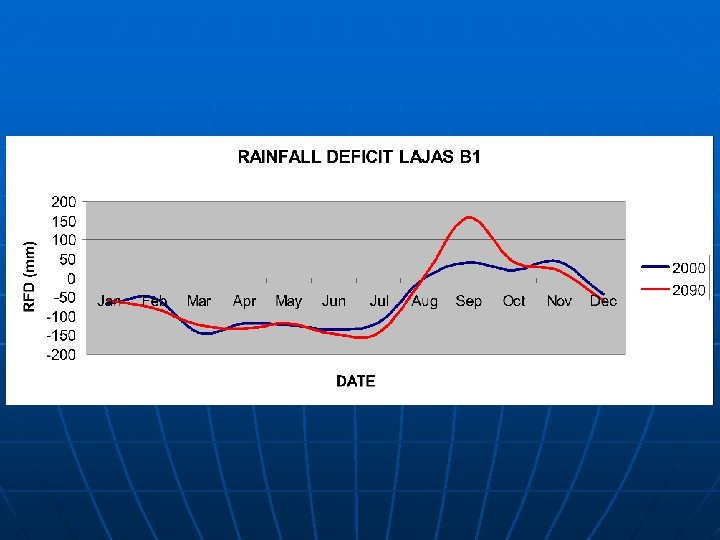
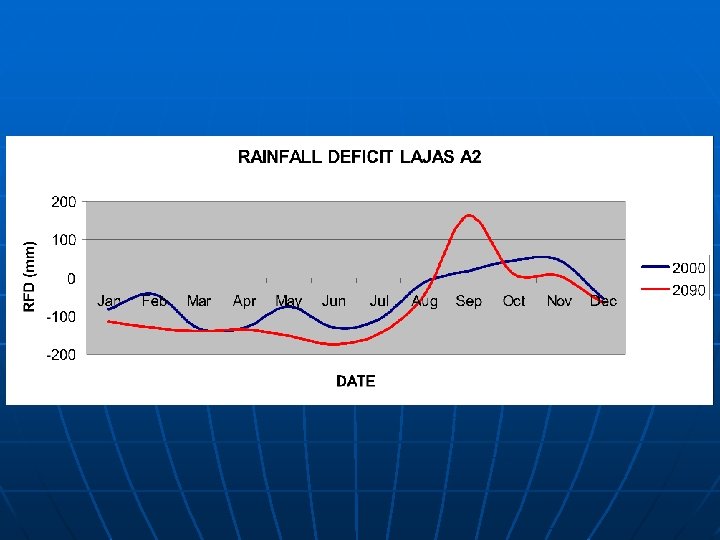
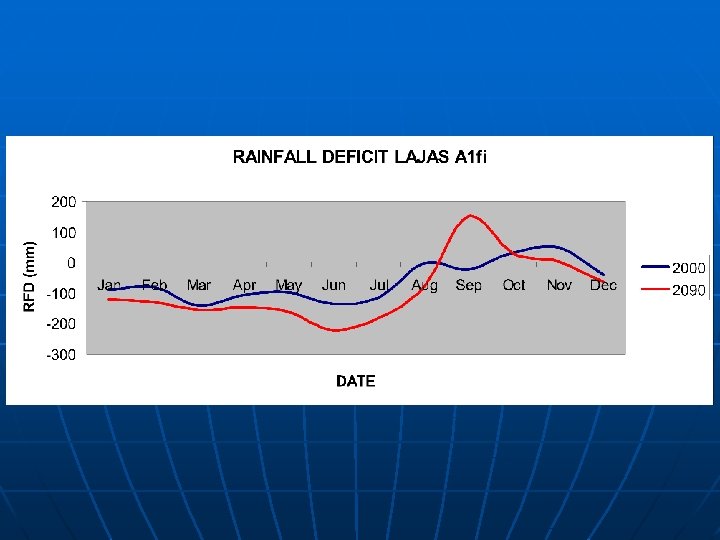
RAINFALL DEFICIT (RFD) RFD = (RAINFALL – ETo) RFD < 0 MEANS THERE IS A DEFICIT RFD > 0 MEANS THERE IS AN EXCESS
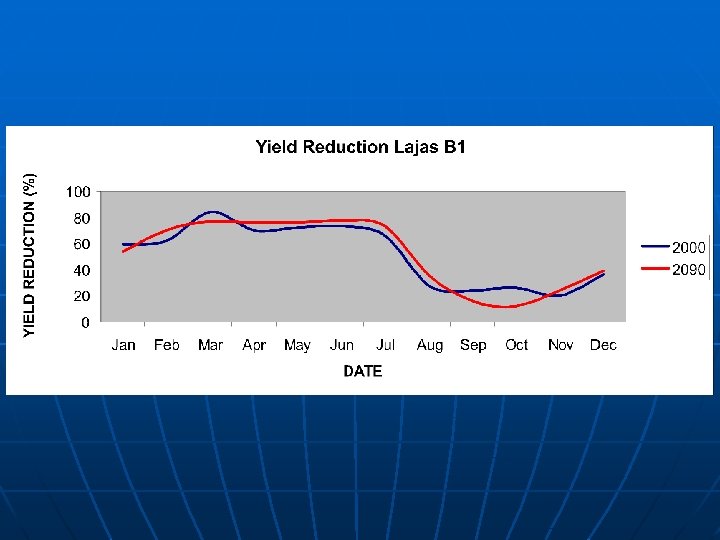
Yield Moisture Stress Relationship YR = Yield reduction (%) Ky = Yield response factor ETcadj = Adjusted (actual) crop ET ETc = Kc ETo = potential or reference ET
Actual Evapotranspiration (ET) ETcadj = Kc Ks ETo Average Kc = 1. 0 Based on 140 crops (Allen et al. , 1998) Kc = crop coefficient Ks = crop water stress factor RAW = readily available water TAW = Totally available water
YIELD RESPONSE FACTOR (Ky) Alfalfa 1. 1 Onion 1. 1 Sunflower Banana 1. 2 -1. 35 Peas 1. 15 Tomato 1. 05 Beans 1. 15 Pepper 1. 1 Watermelon 1. 1 Cabbage 0. 95 Potato 1. 1 Winter wheat 1. 05 Citrus 1. 1 -1. 3 Safflower 0. 8 Cotton 0. 85 Sorghum 0. 9 Grape 0. 85 Soybean 0. 85 Groundnet 0. 70 Spring Wheat 1. 15 Maize 1. 25 Sugarbeet 1. 0 Onion 1. 1 Sugarcane 1. 2 0. 95
WATER BALANCE Si+1 = Ri – ETcadj, i – ROi – Rechi + Si Si+1 is the depth of soil water in the beginning of month i+1 Si is the depth of soil water in the profile at the beginning of month i Ri = rainfall during month i ETi = Actual evapotranspiration during month i ROi = Surface runoff during month i Rechi = percolation or aquifer recharge during month i
Surface Runoff (RO) RO = C R R = monthly rainfall C = monthly runoff coefficient = 0. 3 Long term values of Runoff Coefficient Añasco Watershed C = 0. 33 Guanajibo Watershed C = 0. 2
Aquifer Recharge (Rech) Si+1 = Ri – ETcadj, i – ROi + Si If Si+1 ≤FC then Rech = 0 If Si+1 > FC then Rech = Si+1 – FC and Si+1 = FC FC = Soil Field Capacity or Soil Water Holding Capacity
AIR TEMPERATURE RESULTS
Have we seen a warming trend in the Caribbean? 28 53 1 14 5 Source: Ramirez-Beltran et al. , 2007
Lajas, PR SLOPE IS NOT STATISTICALLY SIGNIFICANT
Adjuntas, PR SLOPE IS STATISTICALLY SIGNIFICANT AT THE 5% LEVEL
Mayagüez, PR SLOPE IS STATISTICALLY SIGNIFICANT AT THE 5% LEVEL
Downscaled Minimum, Mean and Maximum Air Temperature (o. C) for Lajas Scenario A 2
RAINFALL RESULTS
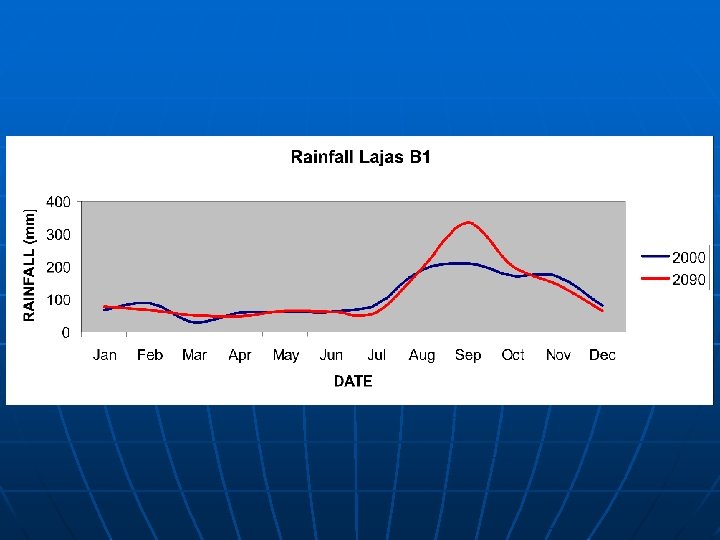
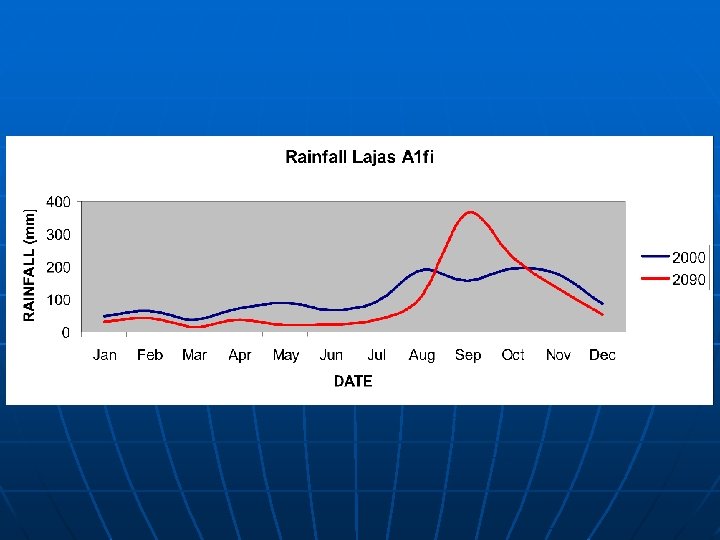
Downscaled Rainfall (mm) for Lajas Scenario A 2
Downscaled Rainfall at Lajas for Scenario A 2 February and September
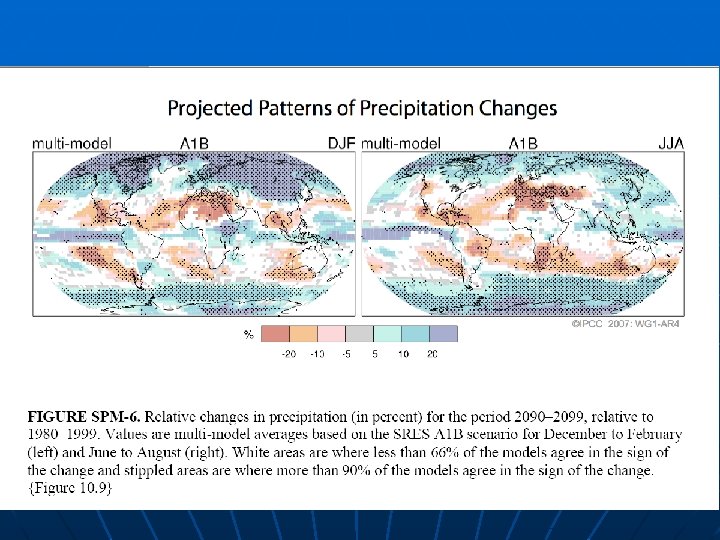
IPPC Report, Feb. 2007 n “Based on a range of models, it is likely that future tropical cyclones (typhoons and hurricanes) will become more intense, with larger peak wind speeds and more heavy precipitation associated with ongoing increases of tropical SSTs. ”
Daily Reference Evapotranspiration (ETo) by Month at Lajas, PR
RAINFALL DEFICIT RESULTS
Relative Change in Rainfall Deficit
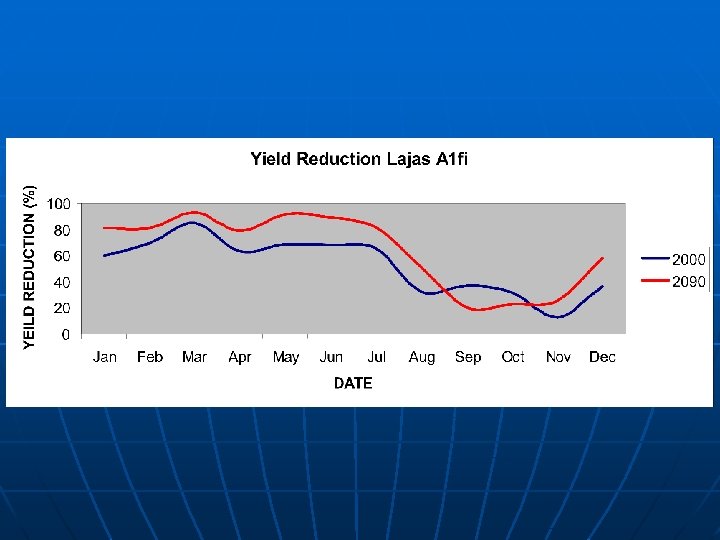
CROP YIELD RESULTS
Disclaimer n n “Global and regional climate models have not demonstrated skill at predicting climate change and variability on multidecadal time scales. ” “Beyond some time period, our ability to provide reliable quantitative and detailed projections of climate must deteriorate to a level that no longer provides useful information to policymakers. ” (Nov. 17, 2006, Roger Pielke Sr. Weblog, http: //climatesci. atmos. colostate. edu)
Some sources of uncertainty in climate modeling • Aerosol effect on clouds and precipitation Radiative Forcing • Direct/diffuse solar irradiance change due to aerosols • Diffuse radiation feedback with the terrestrial biosphere • The cloud versus aerosol feedback on diffuse radiation changes • Role of aerosols on radiative energy redistribution • Biological effect of increased CO 2 (e. g. , stomatal resistance) • Land use changes • Economic factors
SUMMARY • Historical data for Cuba, Haiti, Dominican Republic and Puerto Rico showed increasing trends in air temperature. • Historical data from Adjuntas and Mayagüez indicated significant increasing trend in air temperature • Historical data from Lajas did not indicate a significant trend in air temperature. The historical temperature data at Lajas may have been influenced by land cover/land use around the weather station. • Future increases were predicted in air temperatures for Adjuntas, Mayagüez and Lajas downscaled from the DOE/NCAR PCM model.
SUMMARY-Cont. ·The annual predicted rainfall showed a slight decrease · Rainfall in September increased for all locations and all scenarios. · Rainfall decreased in most months (except September) · The rainfall results from this study were in general agreement with the results reported in the IPCC Feb. 2007 Report
SUMMARY-Cont. · Rainfall excess increased during September for all locations and all scenarios (between 2000 and 2090). ·The largest increase in rainfall excess occurred for Adjuntas for scenario A 1 fi (312 mm) · The largest change in rainfall deficit occurred in Mayagüez for scenario A 2 (-72 mm)
SUMMARY-Cont. · Significant Yield Reduction can be expected during the months that receive less rainfall · Yields improved during September for most scenarios and locations.
Conclusions and Recommendations n n With increasing rainfall deficits during the dry months, the agricultural sector’s demand for water will increase, which may lead to conflicts in water use. The results indicate that the wettest month (September) will become significantly wetter. The excess water can possibly be captured in reservoirs to offset the higher irrigation requirements during the drier months.
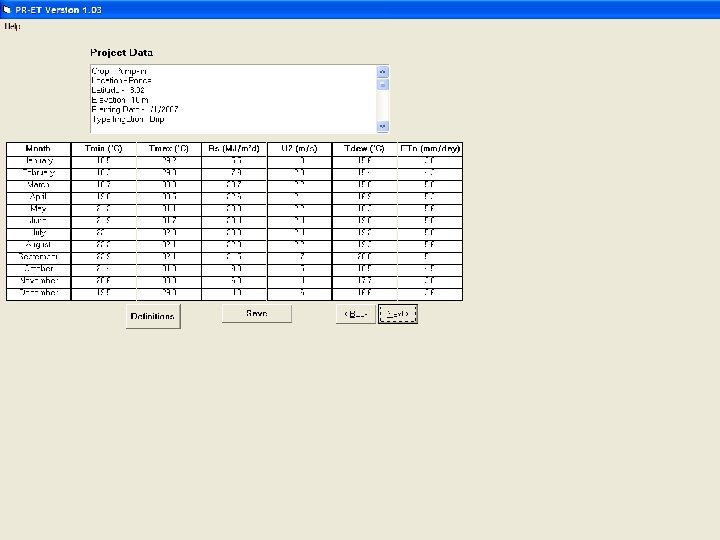
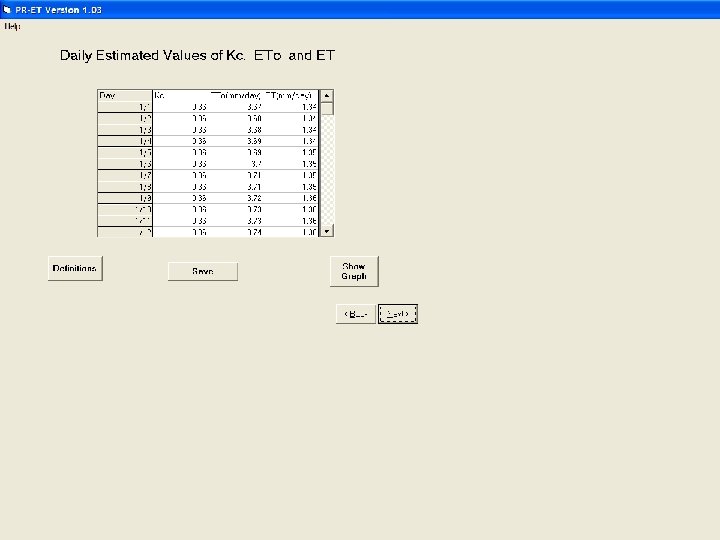
Example Problem Estimating Crop Water Requirements and Net Irrigation Requirement n In this example input data for Ponce, PR were used. Daily evapotranspiration will be determined for a calabaza crop starting on January 1 st, 2007.
http: //academic. uprm. edu/abe/PRAGWATER/
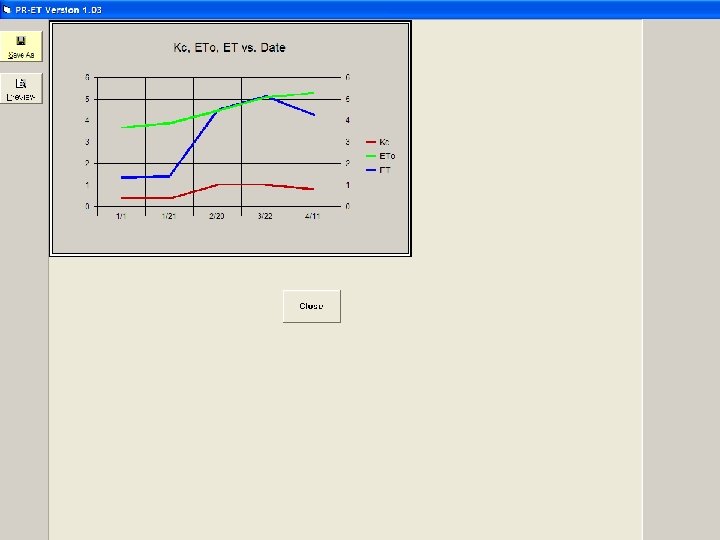
Net Irrigation Requirement
zero
Acknowledgements Norman L. Miller, Atmosphere and Ocean Sciences Group, Earth Sciences Division, Berkeley National Laboratory. Nicole J. Schlegel, Department of Earth and Planetary Science, University of California, Berkeley Jorge E. Gonzalez, Santa Clara University I would like to thank the NASA-EPSCo. R and USDATSTAR projects for their financial support.