Climate and Climate Change Climate Overview Climate classified


- Slides: 43

Climate and Climate Change

Climate Overview • Climate classified largely in terms of – Temperature & Precipitation (vs. evaporation)

Koppen Climate Classification Groups • A. Topical Moist: no winter • B. Dry: Potential evapotranspiration > precipitation • C. Moist Mid-Latitude with mild winter • D. Moist Mid Latitude with severe winter • E. Polar: cold, T<10 o. C • H. Highland Global map

More classification detail Af Tropical rain forest Am Tropical monsoon Aw Tropical wet and dry BW Arid desert BS Semi-arid Cfa Humid subtropical Cfb Cfc Marine Cs Mediterranean dry summer Cw Dry winter Dfa humid continental long hot summer Dfb humid continental long cool summer Dfc subpolar cool short summer Dw Dry winter ET polar tundra EF Polar ice cap H Highland

What is Climate CHANGE? • Climate change - A significant shift in the mean state and event frequency of the atmosphere. • Climate change is a normal component of the Earth’s natural variability. • Climate change occurs on all time and space scales. • A plethora of evidence exists that indicates the climate of the Earth has changed.

Determining the Past Climate Paleoclimatology - the study of past climates. • Past 100 -200 years (weather observations) • Must use indirect climate measures, proxies, to examine further into the past. Some proxies: - Tree rings (1, 000+ years before present BP) - Trapped pollen (10, 000+ years BP) - Glacial ice cores (100, 000+ years BP) - Ocean sediment cores (1 Million+ years BP) - Geology (1 Billion+ years BP)

Ice Core from Vostok, Antarctica During last ice age (>18, 000 years ago) Temps 6 o. C colder CO 2 levels 30% lower CH 4 levels 50% lower H 2 O levels were lower than current interglacial. What caused what?

Most Recent Ice Aguado and Burt, Fig 16 -4 Extend of continental glaciers 18, 000 years BP. Sea level was 100 -125 m lower than present. Bering land bridge between Siberia and Alaska.

SST 18, 000 years BP 18, 000 BP Ahrens, Fig 13. 2 Much cooler over the North Atlantic Ocean currents were undoubtedly different. Today

Temperatures Since Last Ice Age Glacial advance Glacial retreat Apline advance Rapid melt Ahrens, Fig 13. 3 Rapid warming occurred at end of Younger-Dryas period. Ice cores indicate that Ice Age conditions ended in 3 years!

Climate Changes Affect Mankind Viking colonization in Greenland Viking settlements lost in Greenland Ahrens, Fig 13. 4 Temperatures for eastern Europe during the last 1200 years.

Evidence of Climate Change 0. 6 o. C warming past century Ahrens, Fig 13. 5 Surface temperatures based on meteorological observations. Is the warming of the past century due to human activities?

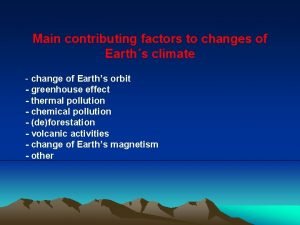
Causes of Climate Change • Atmospheric Composition - Anything that changes the radiative properties of the atmosphere (volcanic aerosols, carbon dioxide). • Astronomical - Anything that alters the amount or distribution of solar energy intercepted by the Earth (solar variations, orbital variations). • Earth’s Surface - Anything that alters the flow of energy at the Earth's surface or changes its distribution (desertification, continental drift).

Causes of Climate Change Astronomical Composition Surface

Milankovitch Theory of Ice Ages • Attempts to explain ice ages by variations in orbital parameters • Three cycles: Eccentricity (100, 000 yrs) Tilt (41, 000 yrs) Precession (23, 000 yrs) • Changes the latitudinal and seasonal distributions of solar radiation.

Milankovitch Theory of Ice Ages • Ice ages occur when there is less radiation in summer to melt snow. • Partially agrees with observations, but many questions unanswered. What caused the onset of the first Ice Age?

Long-Term Climate Change NA E-A SA Af 180 M BP India Aus Ant NA Af SA Today E-A India Aus Ant Ahrens, Fig 13. 6 250 million years ago, the world’s landmasses were joined together and formed a super continent termed Pangea. As today’s continents drifted apart, they moved into different latitude bands. This altered prevailing winds and ocean currents.

Long-Term Climate Change • Circumpolar ocean current formed around Antarctica 4055 MY ago once Antarctica and Australia separated. • This prevented warm air from warmer latitudes to penetrate into Antarctica. • Absence of warm air accelerated growth of the Antarctic ice sheet. http: //www. ace. mmu. ac. uk/eae/Climate_Change/Older/Continental_Drift. html

Our changing climate • Our climate is changing. • In particular, surface temperatures are increasing. => 1998 or 2005 is the warmest year in the past 400 years, and perhaps much longer

Global mean temperatures are rising faster with time Warmest 12 years: 1998, 2005, 2003, 2002, 2004, 2006, 2001, 1997, 1995, 1999, 1990, 2000 Period 25 50 100 150 Rate 0. 177 0. 052 0. 128 0. 026 0. 074 0. 018 0. 045 0. 012 Years /decade From K. Trenberth IPCC

Our changing climate • Arctic is warming faster than most other regions, largely as predicted by climate models • This raises questions about ice melt and sea level rise • Western US may warm and dry significantly (8 o. F in 50100 years? )

Our changing climate: Key Questions • Climate modelers have predicted the Earth’s surface will warm because of manmade greenhouse gas (GHG) emissions • So how much of the warming is manmade? • How serious are the problems this is creating? • What, if anything, can and should we do?

The Natural Greenhouse Effect: clear sky O 3 8% Carbon Dioxide 26% CH 4 N 2 0 6% Water Vapor 60% Clouds also have a greenhouse effect Kiehl and Trenberth 1997

Our changing climate: Increasing CO 2 concentrations • 2 most important greenhouse gases: H 2 O, CO 2 • Man is modifying the CO 2 concentrations via burning fossil fuels • CO 2 concentrations are higher than any time in the last 400, 000 years (NOAA site). – Amounts are now beyond the range of natural variations experienced over the past 700, 000 years • Predictions are for CO 2 concentrations to continue increasing to 1. 5 to 3 times present values by 2100 (NOAA site)

Changing CO 2 concentrations • CO 2 concentrations have varied naturally by a factor of 2 over the past few hundred thousand years • Fossil fuel burning since the industrial revolution has created a sharp increase in CO 2 concentrations • CO 2 concentrations are now higher than at any time in past few hundred thousand years • And concentrations are increasing faster with time Last 4 Ice Age cycles: 400, 000 years Man made You are here See http: //epa. gov/climatechange/science/recentac. html

Changing atmospheric composition: CO 2 Mauna Loa, Hawaii Data from Climate Monitoring and Diagnostics Lab. , NOAA. Data prior to 1974 from C. Keeling, Scripps Inst. Oceanogr.

Increasing CO 2 concentrations • How high will they go? • How warm will it get? ? ? You are going to be here Last 4 Ice Age cycles: 400, 000 years Man made You are here Ice age CO 2 range See http: //epa. gov/climatechange/science/futureac. html

Our changing climate: Can we predict it? • Yes, but with uncertainty. • Models do seem to be getting better From Hansen, J. , Mki. Sato, R. Ruedy, K. Lo, D. W. Lea, and M. Medina-Elizade 2006. Global temperature change. Proc. Natl. Acad. Sci. 103, 1428814293, doi: 10. 1073/pnas. 0606 291103.

GLOBAL Energy Flow Thru Atmosphere

Global Atmo Energy Balance In a stable climate, Solar Energy IN = IR Energy OUT IR Out Ahrens, Fig. 2. 14 Solar in

Global Atmo Energy Imbalance Increasing GHG concentrations decrease Energy out So Energy IN > Energy OUT and the Earth warms IR Out is reduced Ahrens, Fig. 2. 14 Solar in Atmosphere

Change in IR Emission to Space • Notice that because of Earth’s greenhouse gases, 91% (=64/70) [195/235 = 83%] of the IR emitted to space comes from the atmosphere and only 9% (=6/70) [40/235 = 17%] comes from the surface • When GHG’s are added to the atmosphere, the altitude of IR emission to space rises • In the troposphere, air temperature decreases with altitude • So the temperature of the emission to space decreases • So the energy emission to space decreases because the emission energy decreases with decreasing temperature

Change in IR Emission to Space BEFORE GHG increase IN=OUT AFTER GHG increase Altitude IR emission to space NHAltitude of IR 3. IR emission to space decreases because of colder emission temperature SH Ahrens, Fig. 2. 21 emission to space Temperature of IR emission to space Temperature 1. Altitude of IR emission to space rises 2. Temperature of IR emission to space decreases

Change in IR Emission to Space (cont’d) AFTER GHG increase IN>OUT Eventual solution IN=OUT 6. IR emission to space increases until it matches the original IR emission before GHG increases 3. IR emission to space decreases because of colder emission temperature SH Ahrens, Fig. 2. 21 Temperature 1. Altitude of IR emission to space rises 2. Temperature of IR emission to space decreases SH Ahrens, Fig. 2. 21 4. Atmosphere warms until… 5. Temperature of IR Temperature emission to space increase to original temperature

Complexity of Climate System The climate system involves numerous, interrelated components.

Closer Look at Climate System

Climate Feedback Mechanisms

Positive and Negative Feedbacks • Assume that the Earth is warming. - Warming leads to more evaporation from oceans, which increases water vapor in atmosphere. -More water vapor increases absorption of IR, which strengthens the greenhouse effect. -This raises temperatures further, which leads to more evaporation, more water vapor, warming… “Runaway Greenhouse Effect” Positive Feedback Mechanism

Positive and Negative Feedbacks • Again assume that the Earth is warming. - Suppose as the atmosphere warms and moistens, more low clouds form. - More low clouds reflect more solar radiation, which decreases solar heating at the surface. - This slows the warming, which would counteract a runaway greenhouse effect on Earth. Negative Feedback Mechanism

Positive and Negative Feedbacks • Atmosphere has a numerous checks and balances that counteract climate changes. • All feedback mechanisms operate simultaneously. • All feedback mechanisms work in both directions. • The dominant effect is difficult to predict. • Cause and effect is very difficult to prove at the “beyond a shadow of a doubt” level.

Key Points: Climate Change • Proxy data are used to infer the past climate. • Data show that the Earth’s Climate Has changed in the past Is changing now And will continue to change • Key question is determining whether recent changes are due to natural causes or man.

Key Points: Climate Change • The climate system is very complex. Contains hundreds of feedback mechanisms All feedbacks are not totally understood. • Three general climate change mechanisms: Astronomical Atmospheric composition Earth’s surface

Assignment for Next Lecture • Topic - Anthropogenic Climate Change • Reading - Ahrens, p 391 -399 • Problems - 14. 12, 14. 15, 14. 16, 14. 19 • NOVA: “What’s Up with the Weather? ”
 Climate change 2014 mitigation of climate change
 Explain how köppen’s climate system classified climates.
 Climate change meaning
 Atmosphere
 Chapter 13 atmosphere and climate change
 Physical change examples
 Absolute change and relative change formula
 Difference between chemical and physical change
 Change in supply and change in quantity supplied
 Physical change
 Rocks change due to temperature and pressure change
 Whats a chemical change
 First order change adalah
 Onomatopoeia
 Ifrs 6
 Simile personification metaphor alliteration
 How are organisms classified into domains and kingdoms
 Classification of vowels
 Matter is classified as
 Army unauthorized disclosure training
 How are sports injuries classified and managed
 Climate change paragraph
 Karnataka state action plan on climate change
 Climate types brainpop
 Unit 9 climate change
 Conclusion of climate change
 Youreuropemap.com
 Conclusion of climate change
 Mathematics of climate change
 Globalization definition ap world history
 Climate change mitigation
 Pc 414
 Conclusion of climate change
 Factors of climate change
 Human causes of climate change
 Drawing a conceptual framework
 Uk climate change
 Climate change interview
 Factors that affect climate change
 Conclusion of climate change
 Conclusion of climate change
 Climate change causing droughts
 Climate change hypothesis
 Project eddie climate change


