Terra Station and Depositional Environments SPWLA Topical Conference


- Slides: 48

Terra. Station and Depositional Environments SPWLA Topical Conference on Interpretation of Depositional Environments Using Borehole Data, Taos NM Oct 29 th-Nov 2, 2000 TERRASCIENCES

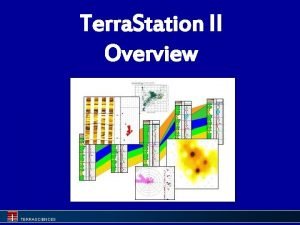
What is the Terra. Station? n n n A tool for aiding in visualization and analysis. A FULLY integrated geological and petrophysical software system. Available under Windows 95/98/NT/2000. Also available on UNIX - Solaris, IRIX, Linux. Optional Open. Works and Geo. Frame based system available for Solaris platforms. (TM) TERRASCIENCES

Depositional Environment Applications of the Terra. Station Data Visualization tools n Data Interpretation tools n Facies Identification n Facies Prediction n Sequence Stratigraphy n Facies Correlation n TERRASCIENCES

Data Used by Terra. Station n n n n Log data Core analysis data Bore hole images and dipmeter data Core and other photographs Lithology and facies indicators Descriptions Geological classifications Well completion data Markers - tops, boundaries, etc TERRASCIENCES

Visualization tools Integrating all the various down hole data in an interactive display using IMAGELog TERRASCIENCES

Curve Data - shading, line styles, colors, grids are all user controlled TERRASCIENCES

CMR/NMR distributions CMR T 2 distribution data allowing the spectra of the T 2 data to be observed. CMR data can be reprocessed with different T 2 cutoff. TERRASCIENCES

Color coded tracks n n Continuous color coding of curve data. Log or linear scale. User defined color maps. Highly effective for well to well correlation This example shows a resistivity curve shaded by values from a GR log. TERRASCIENCES

Variable density logs (VDL) Ideal for CMR, AIT, ADN, RAB data displays. User definable color maps. TERRASCIENCES

Core data and engineering info n Well History – DST, perf zones, RFT – cored intervals – sidewall cores – casing shoes, liners – plugs, fish TERRASCIENCES

Geologic classification displays n n Geological Information User definable classifications TERRASCIENCES

Core, SEM, thin section and other photos TERRASCIENCES

Borehole Imaging Data FMI data showing detailed sedimentary structure. TERRASCIENCES

Here we see the same set of FMI data, one track showing a 2 D projection view of the data, the other showing a “pseudo core” or 3 D transparent view. TERRASCIENCES

Using Images to Identify Sedimentary Features. Cross bedding Brecciated carbonate Note: the ability to display truncated dips. TERRASCIENCES

Picks can be made in true or apparent dip. Dip and azimuth data may be shown using tadpole plots, rose diagrams, stereonets, and various other displays. TERRASCIENCES

FMI image with sand count derived from the image data displayed in the lithology track. TERRASCIENCES

Facies Curve Need to create a numerically encoded facies curve in areas of good data control. This is used to obtain ‘typical’ log responses for each facies. TERRASCIENCES

Analysis tools Ways to display, analyze and predict patterns in the data …. TERRASCIENCES

Histograms … Display facies specific histograms of various curves. May allow facies to be identified by curve responses. TERRASCIENCES

Histograms …. A and B are both sands. Note the much higher GR response of the B sand, perhaps indicating a different depositional environment. A B TERRASCIENCES

Bar graphs TERRASCIENCES

Crossplots and regression analysis Crossplotting to observe log responses in facies in both single and multiple well displays. Investigate facies relationships to log data to build predictive equations. TERRASCIENCES

Transition probability Facies 4 may transition to facies 3 or 1. 4 Facies 3 always overlays facies 4. 3 We can compute the probability of switching from one facies to another. Giving some idea of the relationship of the facies distribution in the well. 4 1 2 3 4 1 TERRASCIENCES

Transition Probability Analyze facies curve for relationships between consecutive facies. Provides facies, or other categorization, occurrence control in simulations. TERRASCIENCES

Fourier Analysis - cyclicity Analyze frequency spectrum of data for the presence of cyclicity. TERRASCIENCES

Fourier Analysis - cyclicity Generate playback harmonic curves. Possibly indicative of climate controlled deposition or fault movement generating regular pulses of material into basins. TERRASCIENCES

Principal Component Analysis n Condenses information from several wireline logs into one or two components. Discriminant Function Analysis n Use “type” responses to classify the well as belonging to one or another category. TERRASCIENCES

Principal Component Analysis Individual cross plots of GR, NPHI, DT, RHOB, K, U, and Th were not particularly helpful in differentiating facies response. TERRASCIENCES

Principal Component Analysis Crossplot of the 1 st and 2 nd principal component scores based on the 7 input curves helps in identifying more of the facies. TERRASCIENCES

Neural networks* - a departure from traditional statistical methods n n Prediction of electrofacies in non cored intervals using log data. Advantage - Does not require a mathematical model describing the predictive relationship. Terra. Station allows NNLAP* direct access to its well files. Making integration of data between the two systems very easy. *provided in conjunction with Petroleum Software Technologies TERRASCIENCES

Organic Geochemistry from Wireline Logs Uses a standard set of wireline logs. n Computes TOC, S 1, S 2, S 3 and others. n Provides information as to likely environment of deposition of source rock. n Provide more information for basin wide shale correlation. n TERRASCIENCES

Sample van Krevelen Diagram Categorizes source rocks into type I, II, or III. Depositional environment is related to kerogen type. TERRASCIENCES

Inter-well surface correlation n Connecting facies boundaries. Examining facies units shape and continuity in cross section. n Mapping the extents of facies units. n TERRASCIENCES

Inter-well surface correlation Correlating with a regular curve display can be made much easier by …. . TERRASCIENCES

Inter-well surface correlation … applying a color coding to the curve. This allows for faster, more confident surface correlation. TERRASCIENCES

“De sanding” of wells Remove the discontinuous sands from the section. Leaves hemipeligic laterally continuous deposits which can be regionally correlated. Add sands back in to perform local sequence correlations. TERRASCIENCES

BEFORE AFTER TERRASCIENCES

Desanding. . . First correlate the basin-wide shale events. TERRASCIENCES

Desanding Then put the sands back in and do local sequence correlation. TERRASCIENCES

Mapping methods n n Generating curve response maps from logs. Ratio maps - e. g. sand/shale. Trend residual maps - locating anomalies reefs, channel sands, etc. Curve profile maps. TERRASCIENCES

Curve response maps Mapping of raw or derived log data for a specific unit. TERRASCIENCES

Trend residual maps Take a map of any value. For example a structure of the top of an overlying shale. TERRASCIENCES

Trend residual maps Compute an appropriate trend surface. TERRASCIENCES

Trend residual maps Subtract the structure grid from the trend surface grid. In this example, a channel sand appears as positive residuals due to the sand body causing differential compaction of the overlying shale. TERRASCIENCES

Curve profile maps Displays the relationship of units in relation to spatial location of the wells. TERRASCIENCES

TERRASCIENCES Contacts: TERRASCIENCES, Inc 5629 FM 1960 West, Suite 312, Houston, TX 77069 Tel: (281) 893 5117 TERRASCIENCES Ltd. Palace Chambers, 41 London Road, Stroud, Glouc. , UK GL 5 2 AJ Tel: +44 (01453) 767683 email: sales@terrasciences. com www. terrasciences. com TERRASCIENCES

And …. TERRASCIENCES, Inc 7800 S. Elati Street, Suite 300, Littleton, CO 80120 Tel: (303) 794 5511 Fax: (303) 794 7755 email: sales@terrasciences. com www. terrasciences. com TERRASCIENCES
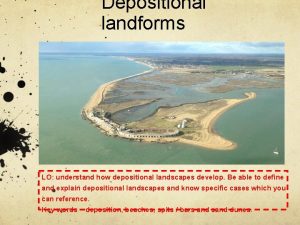
 Sand dunes landforms
 Weathering
 Erosional vs depositional
 Depositional feature of sea waves
 Facies marine
 Terrastation
 Terrastation
 Terra station firefox
 Terra station explorer
 How to use terra station
 International business and globalisation
 Example of external environment in school
 Example of model-based agent
 Interrelationship between micro and macro environment
 International business chapter 5
 International business environments and operations
 Exercise in hot and cold environments
 International business environments and operations
 Cold cream definition in pharmacy
 Medication administration 1 pretest
 Six rights of medication administration
 Disadvantages of virtualization
 Environment means
 Chapter 13 natural environments of europe
 Peng cui tsinghua
 Psychologically informed environments
 Psychologically informed environments
 Creating supportive environments smoking
 High quality supportive environments
 Chapter 13 natural environments of europe
 Designing constructivist learning environments
 Chapter 7 natural environments of north america
 Why are cold environments under threat
 Ans0361i
 Define marketing environment
 Implations
 Story openers
 The marketing environment
 Diverse learning environments survey
 Enabling environments eyfs
 Diverse learning environments survey
 Guidelines for writing a literature review
 Dosage form types
 Topical definition
 Topical syllabus
 Topical scope
 Topical dosage forms
 Topical syllabus example
 Translate picture
