Ten Surprising Performance Tactics Chris Lawson We All
![Extended Hints (cont’d) Here is simple Select [List Of Fields] From Vi_Data_Rgaf Xvi_Md_Tbl Abo_Aoot_Obj Extended Hints (cont’d) Here is simple Select [List Of Fields] From Vi_Data_Rgaf Xvi_Md_Tbl Abo_Aoot_Obj](https://slidetodoc.com/presentation_image_h2/bfeeb0cc733bf28637c44f532fe12659/image-64.jpg)

- Slides: 84

Ten Surprising Performance Tactics Chris Lawson

We All Knew About That! • • • Ever surprised by simplicity of new perf technique? What other techniques have I missed? Key trait Oracle performance analyst is humility. Good ideas often originate in heads of junior DBAs. It's fun exploring techniques that others have used.

Did You Really Know That? • Some of the ideas discussed here will likely be oldhat to many readers. • Ten recent performance tuning “discoveries. ” • Some techniques are trivial to use, whereas others require multiple steps. • Everyone will find at least a few "nuggets. ”

Housekeeping Notes • All code listings in this paper have been simplified. Different (and simpler) names used. • In white paper, see links to research by other DBAs. Don’t stress to copy the scripts—they’re in the white paper.

Tip 1: Optimizer Exec Plan: Same or Different? This one really surprised me—does it surprise you? Q 1: If optimizer lists same steps, is it same plan? Q 2: What if it gives the same plan hash value?

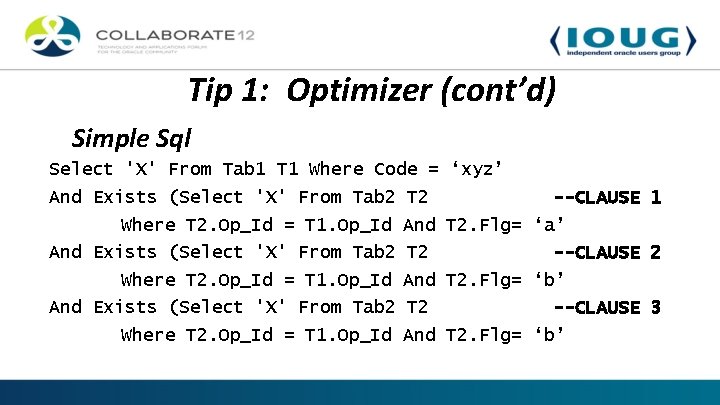
Tip 1: Optimizer (cont’d) Simple Sql Select 'X' From Tab 1 T 1 Where Code = ‘xyz’ And Exists (Select 'X' From Tab 2 T 2 --CLAUSE 1 Where T 2. Op_Id = T 1. Op_Id And T 2. Flg= ‘a’ And Exists (Select 'X' From Tab 2 T 2 --CLAUSE 2 Where T 2. Op_Id = T 1. Op_Id And T 2. Flg= ‘b’ And Exists (Select 'X' From Tab 2 T 2 --CLAUSE 3 Where T 2. Op_Id = T 1. Op_Id And T 2. Flg= ‘b’

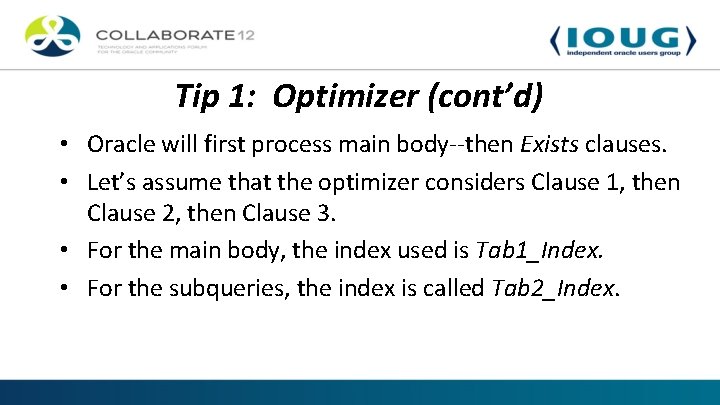
Tip 1: Optimizer (cont’d) • Oracle will first process main body--then Exists clauses. • Let’s assume that the optimizer considers Clause 1, then Clause 2, then Clause 3. • For the main body, the index used is Tab 1_Index. • For the subqueries, the index is called Tab 2_Index.

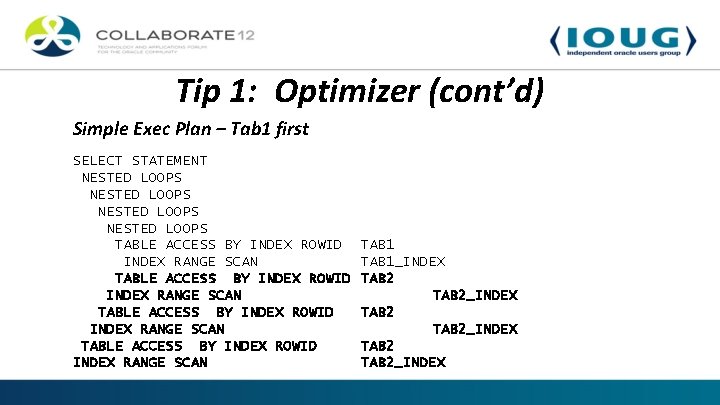
Tip 1: Optimizer (cont’d) Simple Exec Plan – Tab 1 first SELECT STATEMENT NESTED LOOPS TABLE ACCESS BY INDEX ROWID INDEX RANGE SCAN TAB 1_INDEX TAB 2_INDEX TAB 2_INDEX

Tip 1: Optimizer (cont’d) The key: Each clause uses Tab 2 • In my case, it was critical for Clause 2 be considered first. because it drastically reduces the result set. • That information cannot be gleaned from exec plan. • You cannot tell the order that the clauses are considered. • No matter the order Oracle applies the subqueries, the plan will look exactly the same.

Tip 1: Optimizer (cont’d) • I thought at first that I was making some mistake. • If I just looked at other columns in Plan_Table, I would detect a difference in the execution plans? • Not so--Plan Hash Value (PHV) is identical in each case • I suppose this is consistent in a fashion, since the plan details displayed are indeed identical in each case.

Tip 1: Optimizer (summary) • Admittedly, having same PHV for different actions is rare. • Other DBAs have done considerable research on the subject of plan hash values. • Turns out there are many cases where different optimizer action yields the same PHV. White paper has links to other research on this subject.

Tip 2: “A Little Too Active? ” • For busy systems, it’s nice to quickly spot occasional queries that are running more than a few seconds. • For example, when a user omits search criteria. • Note that AWR reports may not be too useful. Q: Why is this missed in AWR?

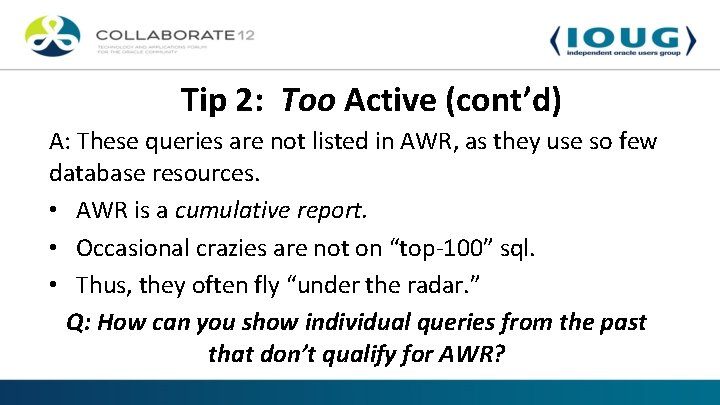
Tip 2: Too Active (cont’d) A: These queries are not listed in AWR, as they use so few database resources. • AWR is a cumulative report. • Occasional crazies are not on “top-100” sql. • Thus, they often fly “under the radar. ” Q: How can you show individual queries from the past that don’t qualify for AWR?

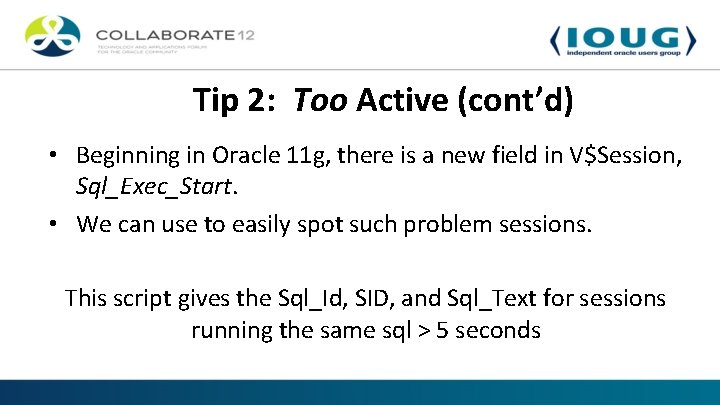
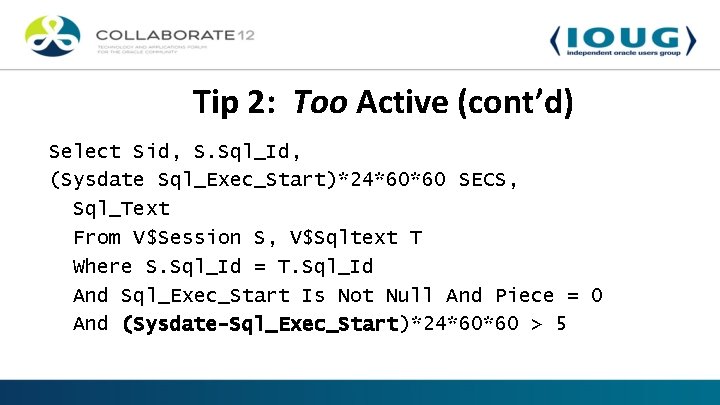
Tip 2: Too Active (cont’d) • Beginning in Oracle 11 g, there is a new field in V$Session, Sql_Exec_Start. • We can use to easily spot such problem sessions. This script gives the Sql_Id, SID, and Sql_Text for sessions running the same sql > 5 seconds

Tip 2: Too Active (cont’d) Select Sid, S. Sql_Id, (Sysdate Sql_Exec_Start)*24*60*60 SECS, Sql_Text From V$Session S, V$Sqltext T Where S. Sql_Id = T. Sql_Id And Sql_Exec_Start Is Not Null And Piece = 0 And (Sysdate-Sql_Exec_Start)*24*60*60 > 5

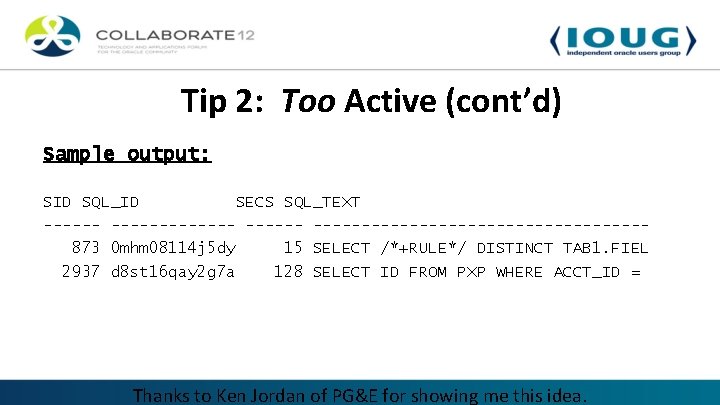
Tip 2: Too Active (cont’d) Sample output: SID SQL_ID SECS SQL_TEXT ------------------------873 0 mhm 08114 j 5 dy 15 SELECT /*+RULE*/ DISTINCT TAB 1. FIEL 2937 d 8 st 16 qay 2 g 7 a 128 SELECT ID FROM PXP WHERE ACCT_ID = Thanks to Ken Jordan of PG&E for showing me this idea.

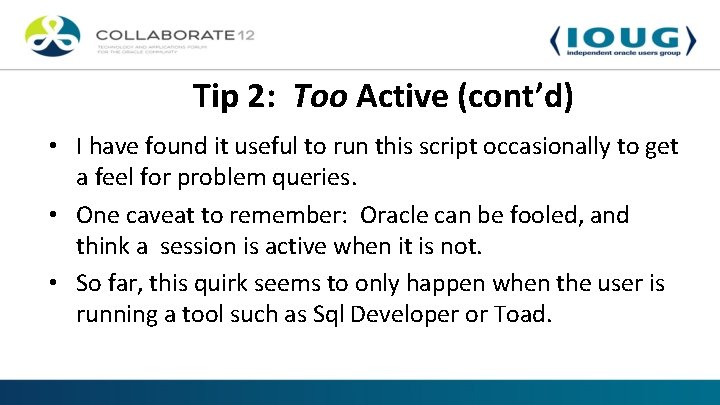
Tip 2: Too Active (cont’d) • I have found it useful to run this script occasionally to get a feel for problem queries. • One caveat to remember: Oracle can be fooled, and think a session is active when it is not. • So far, this quirk seems to only happen when the user is running a tool such as Sql Developer or Toad.

Tip 2: Too Active (summary) • We use this script as a basis for terminating “crazy” queries that have run > 5 minutes • But the question still lingers, “Why does Oracle think a session is still active? ”

Tip 3: Dba_Hist Tables: All Are Equal* • Dba_Hist tables great for getting root of performance issues. • About 126 tables in Oracle 11 g—something for all! Q: What are your favorite/most useful Dba_Hist tables? * But Some Are More Equal than Others)

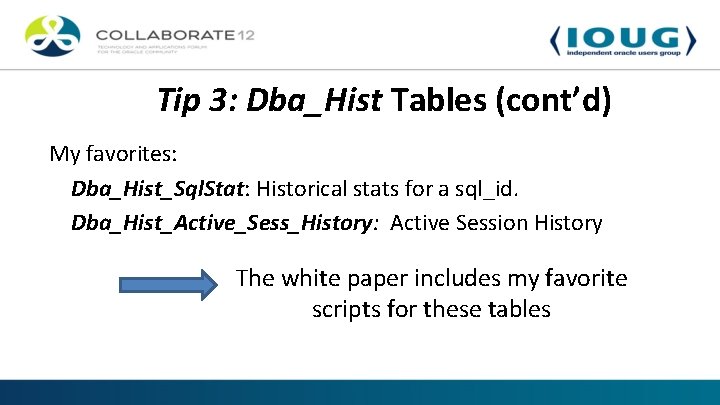
Tip 3: Dba_Hist Tables (cont’d) My favorites: Dba_Hist_Sql. Stat: Historical stats for a sql_id. Dba_Hist_Active_Sess_History: Active Session History The white paper includes my favorite scripts for these tables

Tip 3: Dba_Hist Tables (cont’d) • Oft-missed key: The Dba_Hist tables do not contain all the sql that ran in the past. • For some, only the biggest resource consumers are included. • The criteria is controlled by the parameter Topnsql, via the package Dbms_Workload_Repository. • You can see the current settings by querying Dba_Hist_Wr_Control.

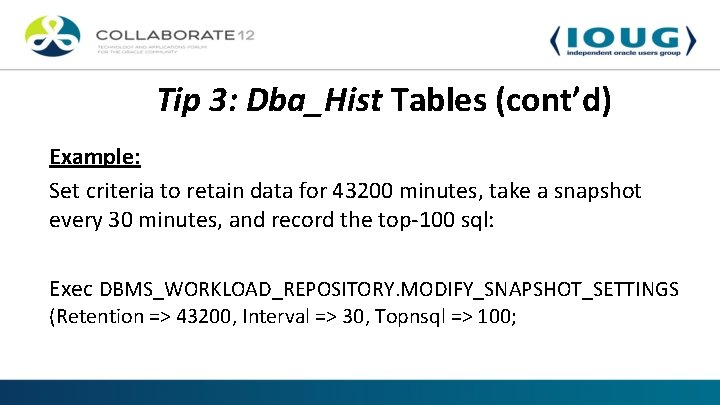
Tip 3: Dba_Hist Tables (cont’d) Example: Set criteria to retain data for 43200 minutes, take a snapshot every 30 minutes, and record the top-100 sql: Exec DBMS_WORKLOAD_REPOSITORY. MODIFY_SNAPSHOT_SETTINGS (Retention => 43200, Interval => 30, Topnsql => 100;

Tip 3: Dba_Hist Tables (cont’d) • The point: The method of sql inclusion is not the same across all the Dba_Hist tables. • Inconsistent? Seems so, but no. • Here's why: Some tables store metrics for Sql that in total, exceed certain thresholds for that period. Like Dba_Hist_Sql. Stat

Tip 3: Dba_Hist Tables (summary) • • The ASH tables don't work that way. They have sql that are caught at a certain time. ASH doesn’t know anything about overall runtime. ASH tables may catch fast sql, even if the cumulative runtime is quite small. Some sql can appear in some Dba_Hist tables, but not others!

Tip 4: Watch Adaptive Cursor Sharing • This tricky feature is new for Oracle 11 g. • Purpose: Consider multiple execution plans for a given sql, and use past runtime statistics to choose best plan. • Optimizer takes into account current and past bind variables.

Tip 4: Adaptive Cursor (cont’d) • Not “one size fits all” cursor sharing. • Instead--Optimizer is given freedom to switch execution plans, given “solid empirical evidence” to do so. Optimizer may switch plans-even though stats same!

Tip 4: Adaptive Cursor (cont’d) Cursor may be set BIND-SENSITIVE: • Optimizer peeks bind variable, stores selectivity of the predicate, and stores runtime metrics for that predicate. • So optimizer builds-up data for future evaluations. • Optimizer decides if exec plan change should be considered. • If ready for stage 2, the cursor is marked Bind-aware.

Tip 4: Adaptive Cursor (cont’d) If cursor set to BIND-AWARE • Optimizer compares selectivity of new bind with stored bind. • If they differ greatly, optimizer will generate new execution plan, for potential use in the future. • Over time, the optimizer will thus build up a set of selectivity/execution plans from which to choose.

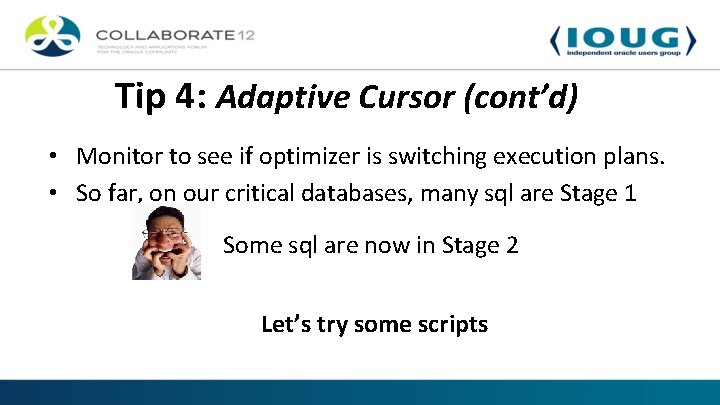
Tip 4: Adaptive Cursor (cont’d) • Monitor to see if optimizer is switching execution plans. • So far, on our critical databases, many sql are Stage 1 Some sql are now in Stage 2 Let’s try some scripts

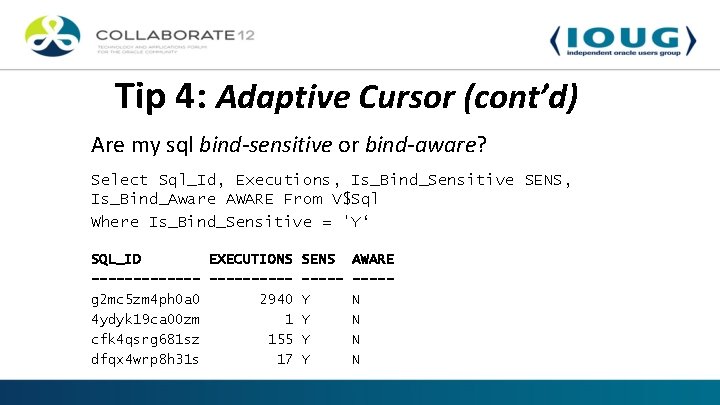
Tip 4: Adaptive Cursor (cont’d) Are my sql bind-sensitive or bind-aware? Select Sql_Id, Executions, Is_Bind_Sensitive SENS, Is_Bind_Aware AWARE From V$Sql Where Is_Bind_Sensitive = 'Y‘ SQL_ID EXECUTIONS SENS AWARE ------- -----g 2 mc 5 zm 4 ph 0 a 0 2940 Y N 4 ydyk 19 ca 00 zm 1 Y N cfk 4 qsrg 681 sz 155 Y N dfqx 4 wrp 8 h 31 s 17 Y N

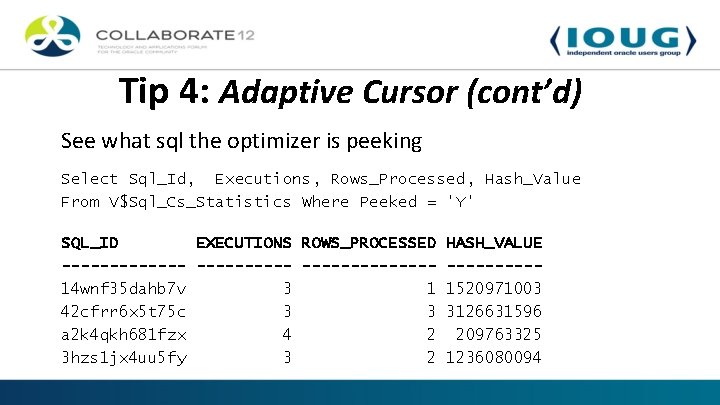
Tip 4: Adaptive Cursor (cont’d) See what sql the optimizer is peeking Select Sql_Id, Executions, Rows_Processed, Hash_Value From V$Sql_Cs_Statistics Where Peeked = 'Y' SQL_ID EXECUTIONS ROWS_PROCESSED HASH_VALUE --------------14 wnf 35 dahb 7 v 3 1 1520971003 42 cfrr 6 x 5 t 75 c 3 3 3126631596 a 2 k 4 qkh 681 fzx 4 2 209763325 3 hzs 1 jx 4 uu 5 fy 3 2 1236080094

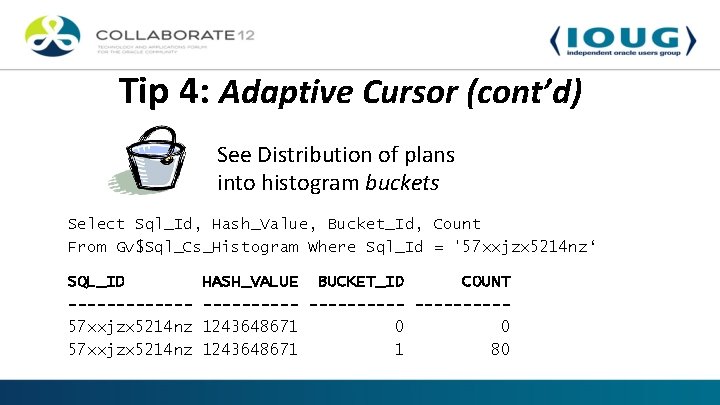
Tip 4: Adaptive Cursor (cont’d) See Distribution of plans into histogram buckets Select Sql_Id, Hash_Value, Bucket_Id, Count From Gv$Sql_Cs_Histogram Where Sql_Id = '57 xxjzx 5214 nz‘ SQL_ID ------57 xxjzx 5214 nz HASH_VALUE BUCKET_ID COUNT ----------1243648671 0 0 1243648671 1 80

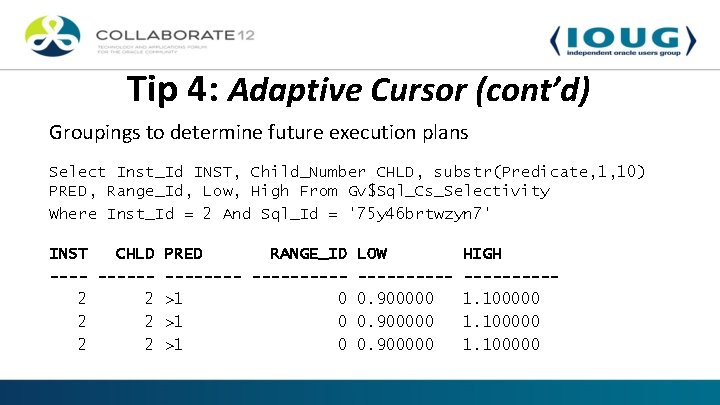
Tip 4: Adaptive Cursor (cont’d) Groupings to determine future execution plans Select Inst_Id INST, Child_Number CHLD, substr(Predicate, 1, 10) PRED, Range_Id, Low, High From Gv$Sql_Cs_Selectivity Where Inst_Id = 2 And Sql_Id = '75 y 46 brtwzyn 7' INST CHLD PRED RANGE_ID LOW -----------2 2 >1 0 0. 900000 HIGH -----1. 100000

Tip 4: Adaptive Cursor (summary) • Suggest DBA determine whether execution plan changes are being controlled by this new feature. • Despite similarity in names, note that this feature is not controlled by the parameter, Cursor_Sharing. • Adaptive cursor sharing is active no matter what the setting of that parameter.

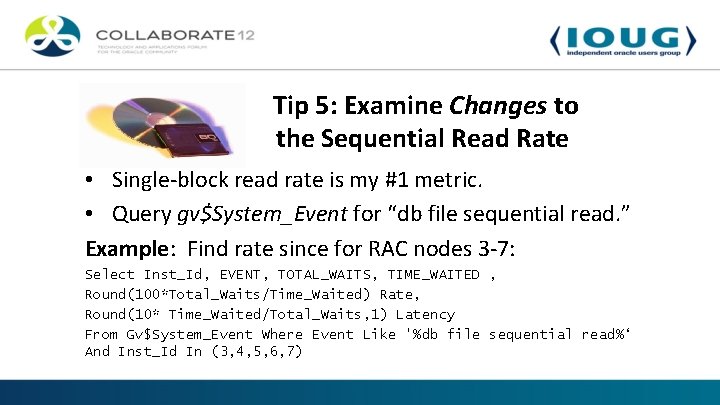
Tip 5: Examine Changes to the Sequential Read Rate • Single-block read rate is my #1 metric. • Query gv$System_Event for “db file sequential read. ” Example: Find rate since for RAC nodes 3 -7: Select Inst_Id, EVENT, TOTAL_WAITS, TIME_WAITED , Round(100*Total_Waits/Time_Waited) Rate, Round(10* Time_Waited/Total_Waits, 1) Latency From Gv$System_Event Where Event Like '%db file sequential read%‘ And Inst_Id In (3, 4, 5, 6, 7)

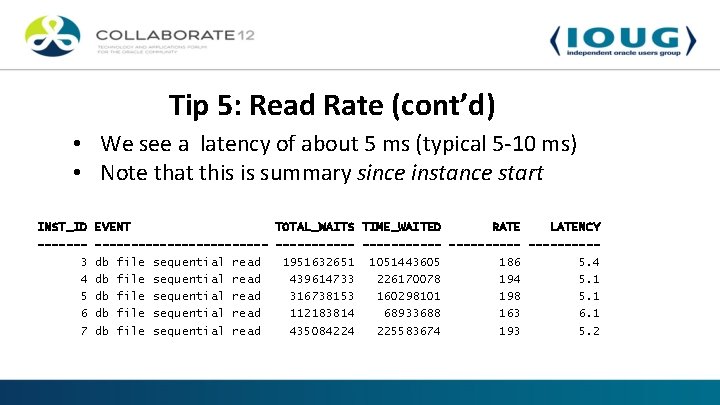
Tip 5: Read Rate (cont’d) • We see a latency of about 5 ms (typical 5 -10 ms) • Note that this is summary since instance start INST_ID ------3 4 5 6 7 EVENT TOTAL_WAITS TIME_WAITED RATE LATENCY ------------ -----db file sequential read 1951632651 1051443605 186 5. 4 db file sequential read 439614733 226170078 194 5. 1 db file sequential read 316738153 160298101 198 5. 1 db file sequential read 112183814 68933688 163 6. 1 db file sequential read 435084224 225583674 193 5. 2

Tip 5: Read Rate (cont’d) • What if the disk rate is changing during peaks? • Could check AWR reports for each time period—but will take a while. • Instead, use Dba_Hist_Filestatxs. • This has cumulative disk i/o information, sorted by snap.

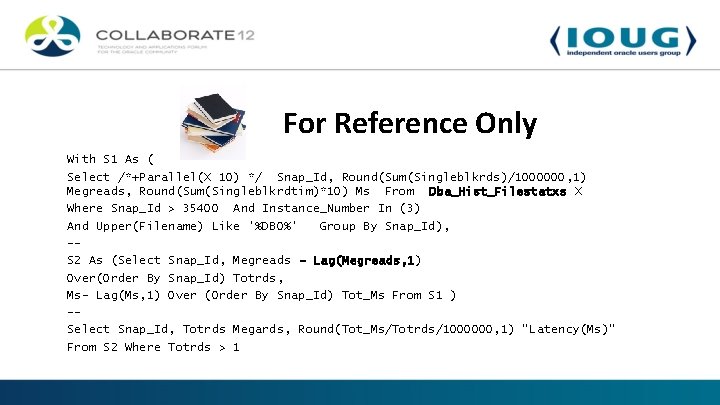
For Reference Only With S 1 As ( Select /*+Parallel(X 10) */ Snap_Id, Round(Sum(Singleblkrds)/1000000, 1) Megreads, Round(Sum(Singleblkrdtim)*10) Ms From Dba_Hist_Filestatxs X Where Snap_Id > 35400 And Instance_Number In (3) And Upper(Filename) Like '%DB 0%' Group By Snap_Id), -S 2 As (Select Snap_Id, Megreads - Lag(Megreads, 1) Over(Order By Snap_Id) Totrds, Ms- Lag(Ms, 1) Over (Order By Snap_Id) Tot_Ms From S 1 ) -Select Snap_Id, Totrds Megards, Round(Tot_Ms/Totrds/1000000, 1) "Latency(Ms)" From S 2 Where Totrds > 1

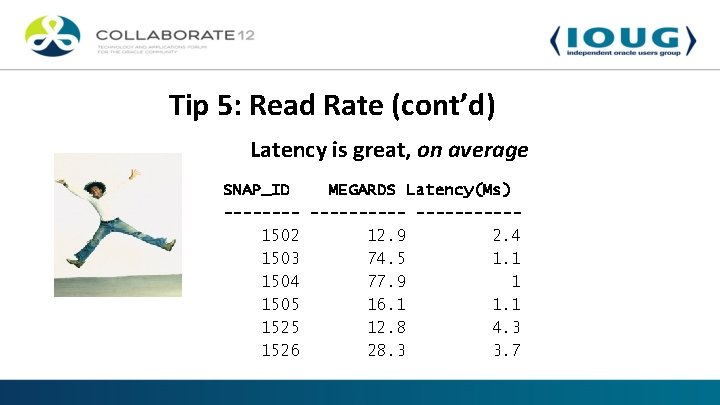
Tip 5: Read Rate (cont’d) Latency is great, on average SNAP_ID MEGARDS Latency(Ms) ----------1502 12. 9 2. 4 1503 74. 5 1. 1 1504 77. 9 1 1505 16. 1 1525 12. 8 4. 3 1526 28. 3 3. 7

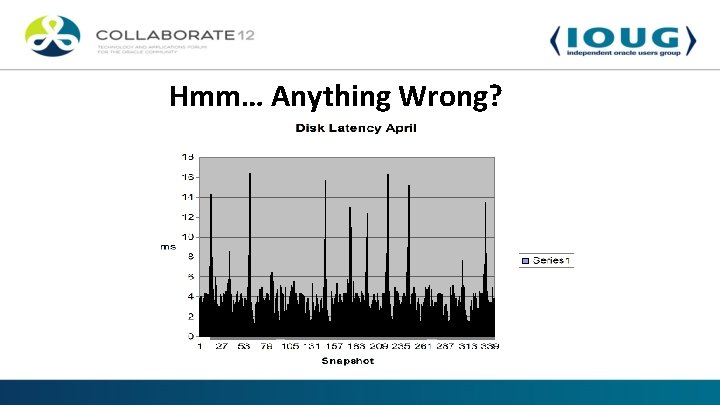
Hmm… Anything Wrong?

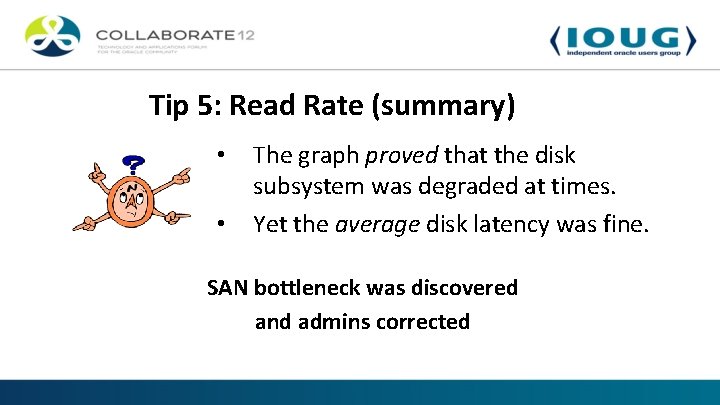
Tip 5: Read Rate (summary) • • The graph proved that the disk subsystem was degraded at times. Yet the average disk latency was fine. SAN bottleneck was discovered and admins corrected

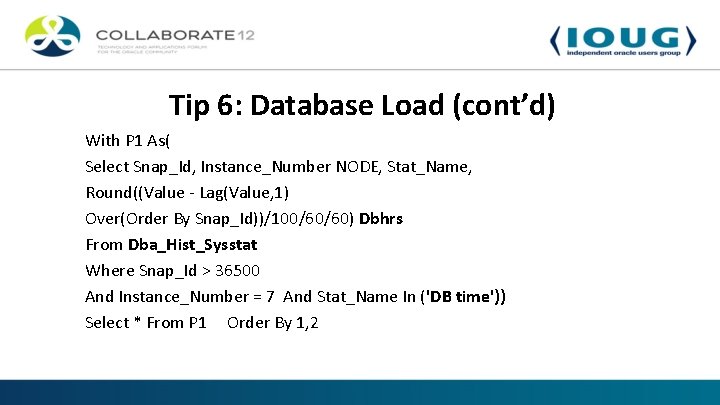
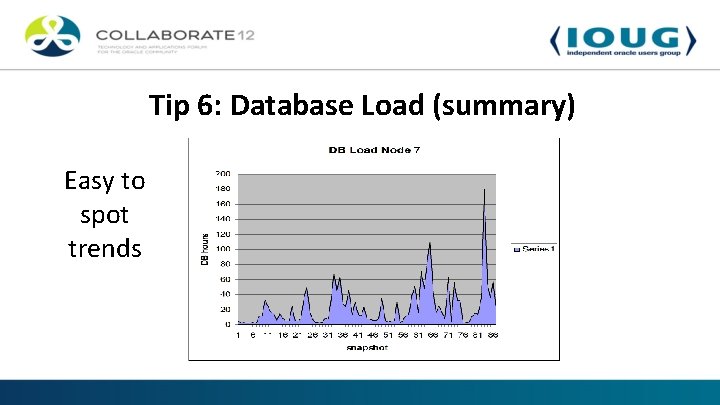
Tip 6: Examine Historical Database Load • Occasionally check for overall load on a node. • Why? Spot unwelcome patterns. • We use “lag” function, since the table holds cumulative statistics. Here’s how:

Tip 6: Database Load (cont’d) With P 1 As( Select Snap_Id, Instance_Number NODE, Stat_Name, Round((Value - Lag(Value, 1) Over(Order By Snap_Id))/100/60/60) Dbhrs From Dba_Hist_Sysstat Where Snap_Id > 36500 And Instance_Number = 7 And Stat_Name In ('DB time')) Select * From P 1 Order By 1, 2

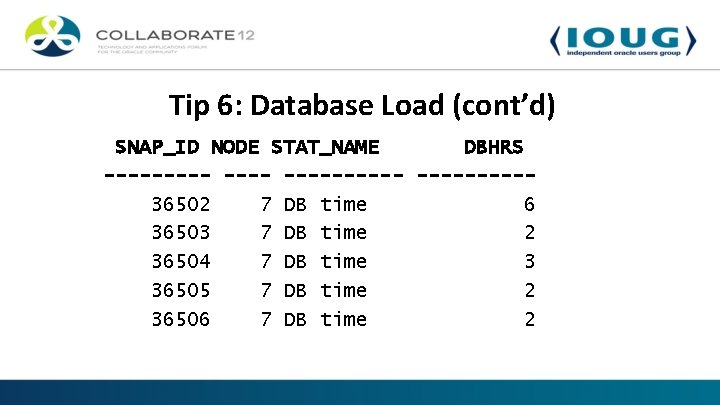
Tip 6: Database Load (cont’d) SNAP_ID NODE STAT_NAME DBHRS ----------36502 7 DB time 6 36503 7 DB time 2 36504 7 DB time 3 36505 7 DB time 2 36506 7 DB time 2

Tip 6: Database Load (summary) Easy to spot trends

Tip 7: Consider Sql Profiles • My favorite: Stored outlines. Many in production. Q: What’s the big “plus” of stored outlines? • Forced to try profile--query could not use outline. • Profile worked the first time, and corrected plan.

Tip 7: Sql Profiles (cont’d) • Sql profiles use an interesting method • They have the luxury of expending enormous amounts of cpu trying different plan options. • Same optimizer that gave crummy execution plan in the first place—but they can spend a lot more time

Tip 7: Sql Profiles (cont’d) • Sql profile is not actually an execution plan. • It’s a set of sql hints, stored in the data dictionary, ready to be applied the next time the sql is run. • Similar to stored outlines, but hints are different. A different type of hint

Tip 7: Sql Profiles (cont’d) • Subtle difference between outlines and profiles. • Outline uses sql hints that tend to preserve certain steps in an execution plan (e. g. , “full” or “index. ”) • Profiles use hints that give the optimizer extra information that it normally would not have. • Hints like: Opt_Estimate or Scale_Rows

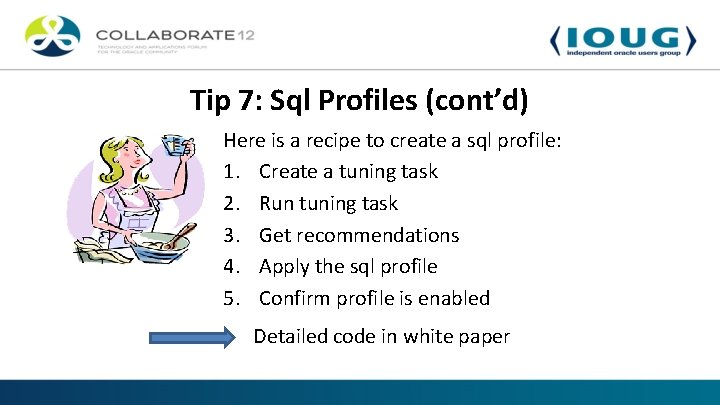
Tip 7: Sql Profiles (cont’d) Here is a recipe to create a sql profile: 1. Create a tuning task 2. Run tuning task 3. Get recommendations 4. Apply the sql profile 5. Confirm profile is enabled Detailed code in white paper

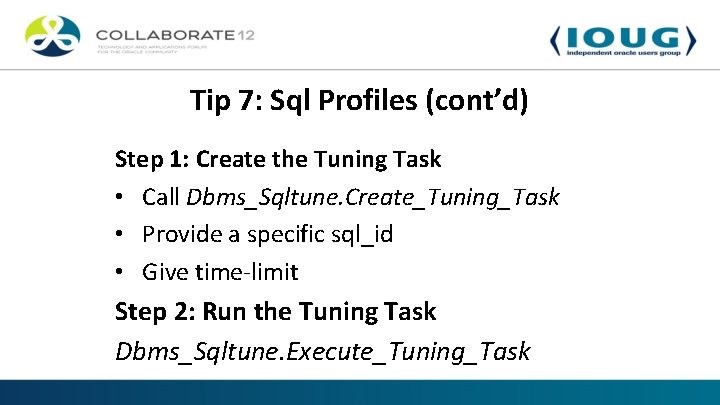
Tip 7: Sql Profiles (cont’d) Step 1: Create the Tuning Task • Call Dbms_Sqltune. Create_Tuning_Task • Provide a specific sql_id • Give time-limit Step 2: Run the Tuning Task Dbms_Sqltune. Execute_Tuning_Task

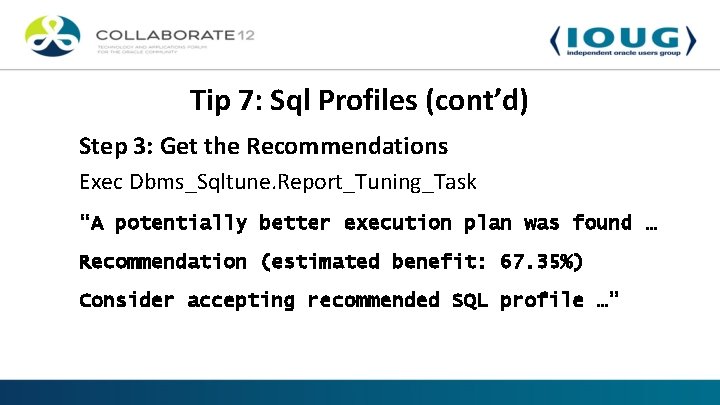
Tip 7: Sql Profiles (cont’d) Step 3: Get the Recommendations Exec Dbms_Sqltune. Report_Tuning_Task “A potentially better execution plan was found … Recommendation (estimated benefit: 67. 35%) Consider accepting recommended SQL profile …”

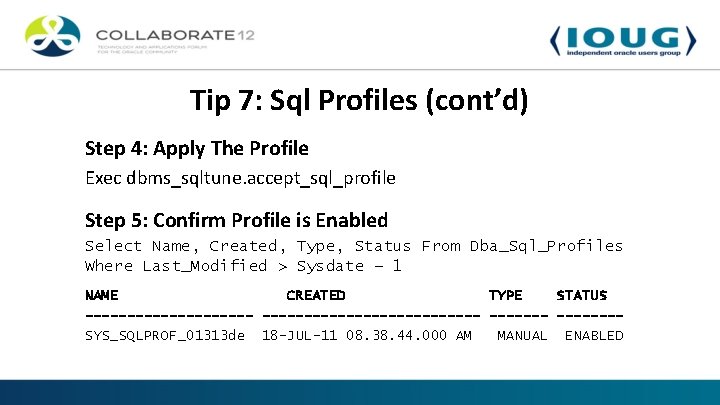
Tip 7: Sql Profiles (cont’d) Step 4: Apply The Profile Exec dbms_sqltune. accept_sql_profile Step 5: Confirm Profile is Enabled Select Name, Created, Type, Status From Dba_Sql_Profiles Where Last_Modified > Sysdate – 1 NAME CREATED TYPE STATUS --------------------------SYS_SQLPROF_01313 de 18 -JUL-11 08. 38. 44. 000 AM MANUAL ENABLED

Tip 7: Sql Profiles (cont’d) Behind The Scenes • What in the world is Oracle doing with a sql profile? • What kinds of sql hints are being applied? • You can see the hints by joining Sys. Sqlobj$Data Od, Sys. Sqlobj$ What do the hints look like?

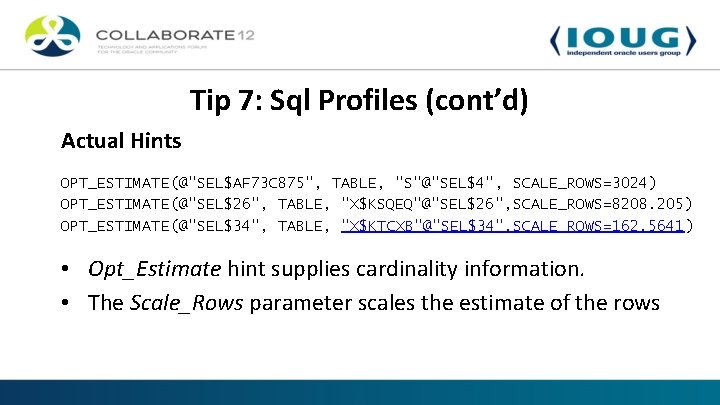
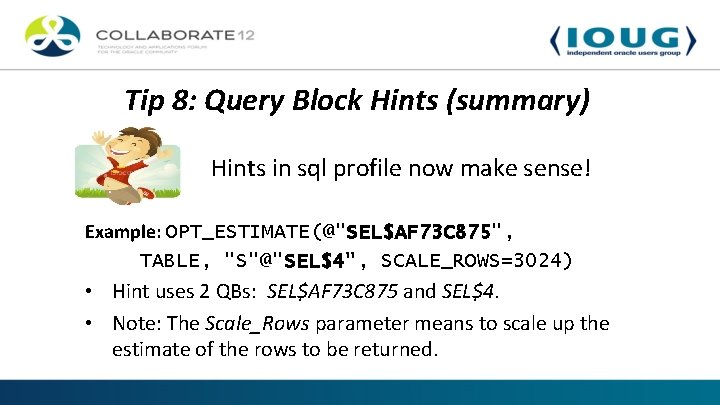
Tip 7: Sql Profiles (cont’d) Actual Hints OPT_ESTIMATE(@"SEL$AF 73 C 875", TABLE, "S"@"SEL$4", SCALE_ROWS=3024) OPT_ESTIMATE(@"SEL$26", TABLE, "X$KSQEQ"@"SEL$26", SCALE_ROWS=8208. 205) OPT_ESTIMATE(@"SEL$34", TABLE, "X$KTCXB"@"SEL$34", SCALE_ROWS=162. 5641) • Opt_Estimate hint supplies cardinality information. • The Scale_Rows parameter scales the estimate of the rows

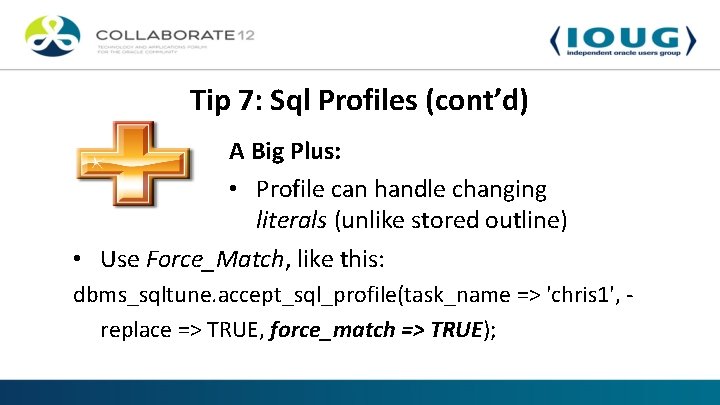
Tip 7: Sql Profiles (cont’d) A Big Plus: • Profile can handle changing literals (unlike stored outline) • Use Force_Match, like this: dbms_sqltune. accept_sql_profile(task_name => 'chris 1', replace => TRUE, force_match => TRUE);

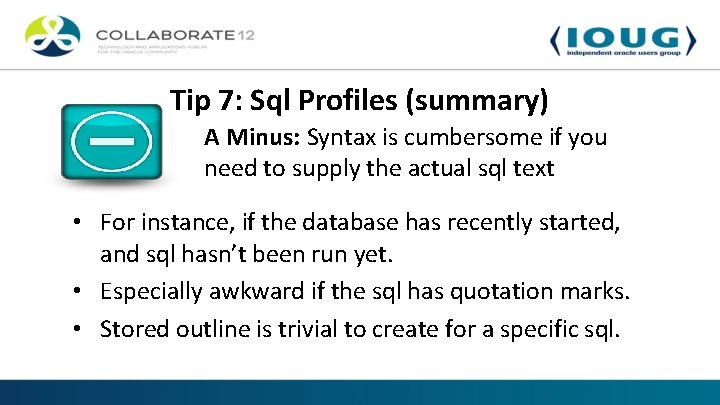
Tip 7: Sql Profiles (summary) A Minus: Syntax is cumbersome if you need to supply the actual sql text • For instance, if the database has recently started, and sql hasn’t been run yet. • Especially awkward if the sql has quotation marks. • Stored outline is trivial to create for a specific sql.

Tip 8: Recognize Query Block Hints • Query block identifies area of sql code, e. g. , subquery. • QBs can be used so a hint just applies to certain part. • Used behind-the-scenes in outlines and sql profiles. Let’s see what they look like

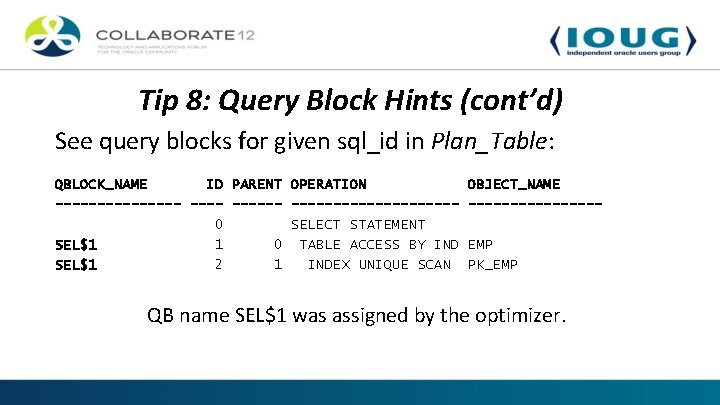
Tip 8: Query Block Hints (cont’d) See query blocks for given sql_id in Plan_Table: QBLOCK_NAME ID PARENT OPERATION OBJECT_NAME -------- ----------0 SELECT STATEMENT SEL$1 1 0 TABLE ACCESS BY IND EMP SEL$1 2 1 INDEX UNIQUE SCAN PK_EMP QB name SEL$1 was assigned by the optimizer.

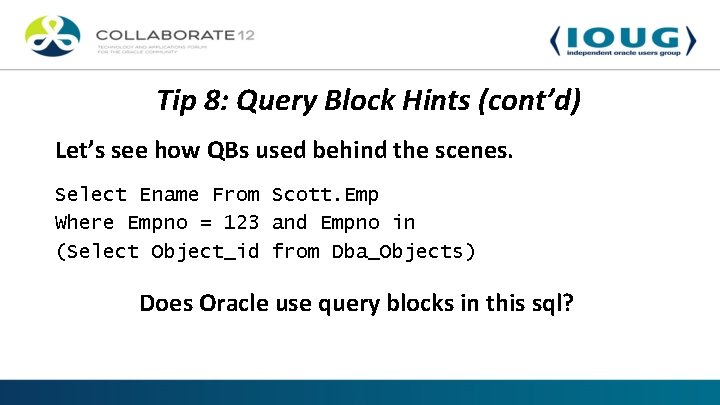
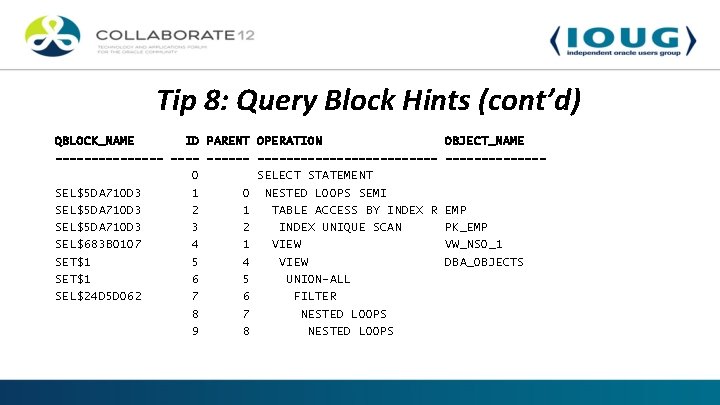
Tip 8: Query Block Hints (cont’d) Let’s see how QBs used behind the scenes. Select Ename From Scott. Emp Where Empno = 123 and Empno in (Select Object_id from Dba_Objects) Does Oracle use query blocks in this sql?

Tip 8: Query Block Hints (cont’d) QBLOCK_NAME ID PARENT OPERATION OBJECT_NAME -------- -------------0 SELECT STATEMENT SEL$5 DA 710 D 3 1 0 NESTED LOOPS SEMI SEL$5 DA 710 D 3 2 1 TABLE ACCESS BY INDEX R EMP SEL$5 DA 710 D 3 3 2 INDEX UNIQUE SCAN PK_EMP SEL$683 B 0107 4 1 VIEW VW_NSO_1 SET$1 5 4 VIEW DBA_OBJECTS SET$1 6 5 UNION-ALL SEL$24 D 5 D 062 7 6 FILTER 8 7 NESTED LOOPS 9 8 NESTED LOOPS

Tip 8: Query Block Hints (summary) Hints in sql profile now make sense! Example: OPT_ESTIMATE(@"SEL$AF 73 C 875", TABLE, "S"@"SEL$4", SCALE_ROWS=3024) • Hint uses 2 QBs: SEL$AF 73 C 875 and SEL$4. • Note: The Scale_Rows parameter means to scale up the estimate of the rows to be returned.

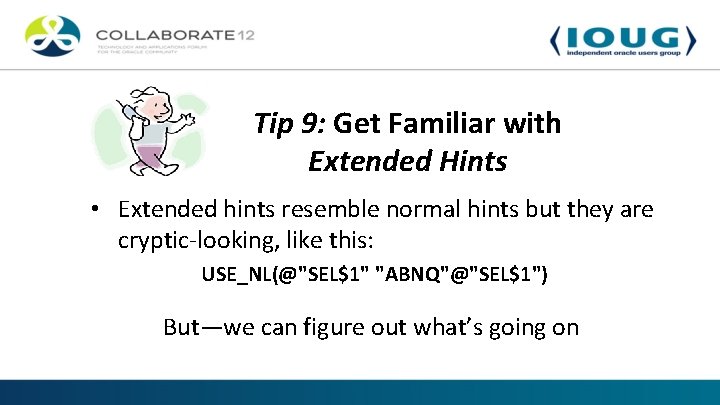
Tip 9: Get Familiar with Extended Hints • Extended hints resemble normal hints but they are cryptic-looking, like this: USE_NL(@"SEL$1" "ABNQ"@"SEL$1") But—we can figure out what’s going on
![Extended Hints contd Here is simple Select List Of Fields From ViDataRgaf XviMdTbl AboAootObj Extended Hints (cont’d) Here is simple Select [List Of Fields] From Vi_Data_Rgaf Xvi_Md_Tbl Abo_Aoot_Obj](https://slidetodoc.com/presentation_image_h2/bfeeb0cc733bf28637c44f532fe12659/image-64.jpg)
Extended Hints (cont’d) Here is simple Select [List Of Fields] From Vi_Data_Rgaf Xvi_Md_Tbl Abo_Aoot_Obj Vmti_Md_Cco_Tbl Where * * * V 1 d, Xbl, Abo, Rq 4 With a stored outline, what hints does Oracle use?

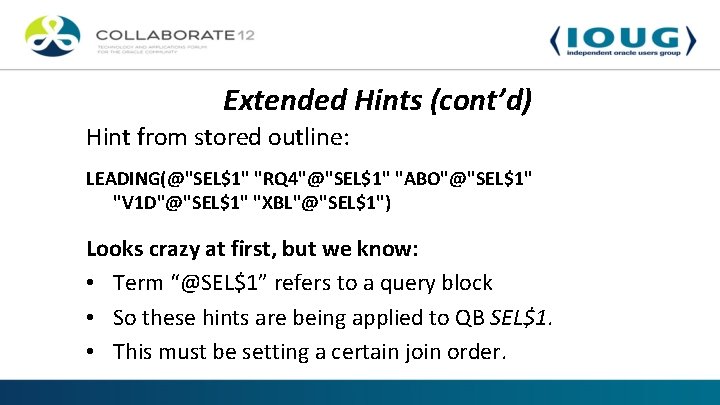
Extended Hints (cont’d) Hint from stored outline: LEADING(@"SEL$1" "RQ 4"@"SEL$1" "ABO"@"SEL$1" "V 1 D"@"SEL$1" "XBL"@"SEL$1") Looks crazy at first, but we know: • Term “@SEL$1” refers to a query block • So these hints are being applied to QB SEL$1. • This must be setting a certain join order.

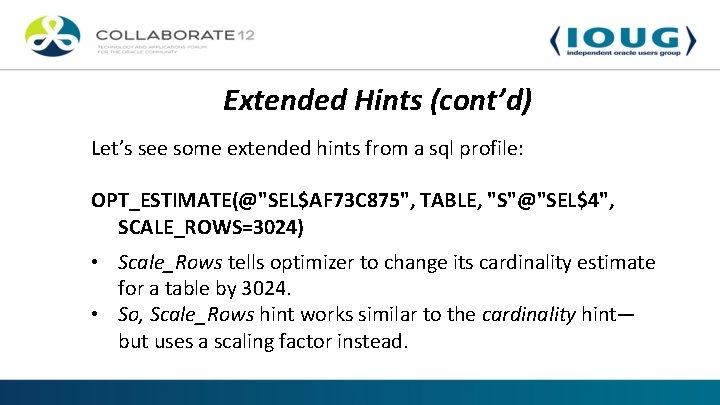
Extended Hints (cont’d) Let’s see some extended hints from a sql profile: OPT_ESTIMATE(@"SEL$AF 73 C 875", TABLE, "S"@"SEL$4", SCALE_ROWS=3024) • Scale_Rows tells optimizer to change its cardinality estimate for a table by 3024. • So, Scale_Rows hint works similar to the cardinality hint— but uses a scaling factor instead.

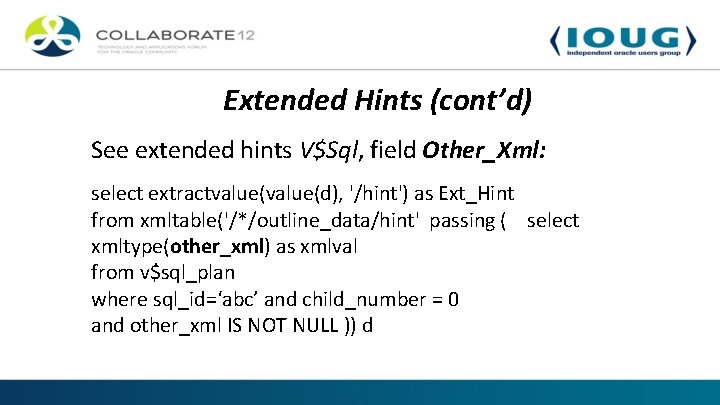
Extended Hints (cont’d) See extended hints V$Sql, field Other_Xml: select extractvalue(d), '/hint') as Ext_Hint from xmltable('/*/outline_data/hint' passing ( select xmltype(other_xml) as xmlval from v$sql_plan where sql_id=‘abc’ and child_number = 0 and other_xml IS NOT NULL )) d

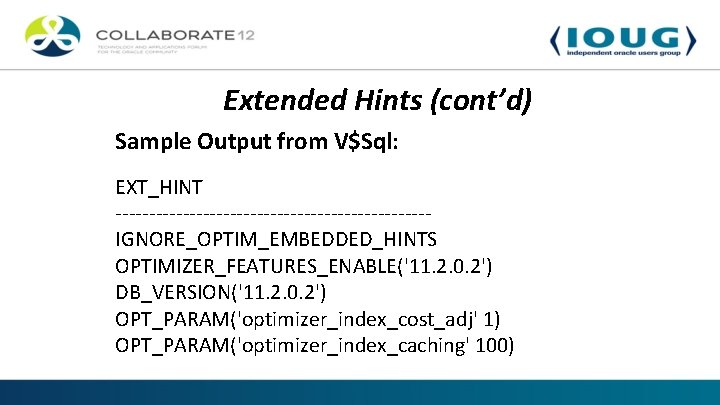
Extended Hints (cont’d) Sample Output from V$Sql: EXT_HINT -----------------------IGNORE_OPTIM_EMBEDDED_HINTS OPTIMIZER_FEATURES_ENABLE('11. 2. 0. 2') DB_VERSION('11. 2. 0. 2') OPT_PARAM('optimizer_index_cost_adj' 1) OPT_PARAM('optimizer_index_caching' 100)

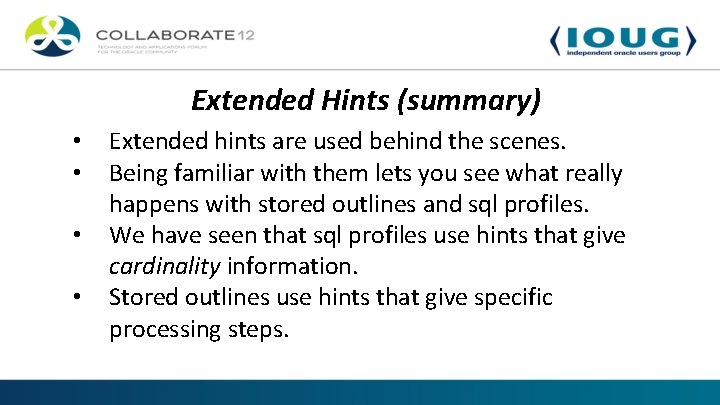
Extended Hints (summary) • • Extended hints are used behind the scenes. Being familiar with them lets you see what really happens with stored outlines and sql profiles. We have seen that sql profiles use hints that give cardinality information. Stored outlines use hints that give specific processing steps.

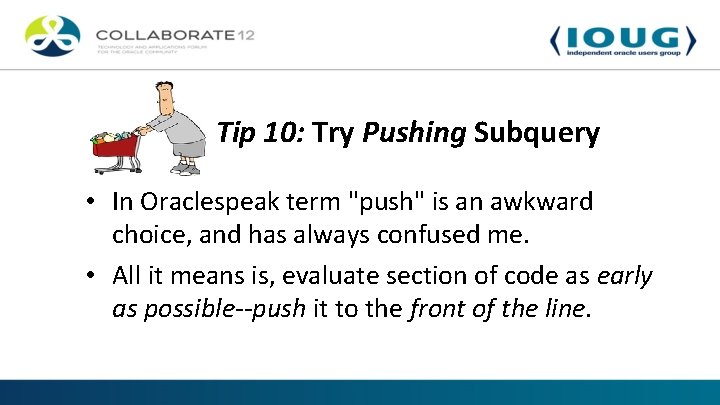
Tip 10: Try Pushing Subquery • In Oraclespeak term "push" is an awkward choice, and has always confused me. • All it means is, evaluate section of code as early as possible--push it to the front of the line.

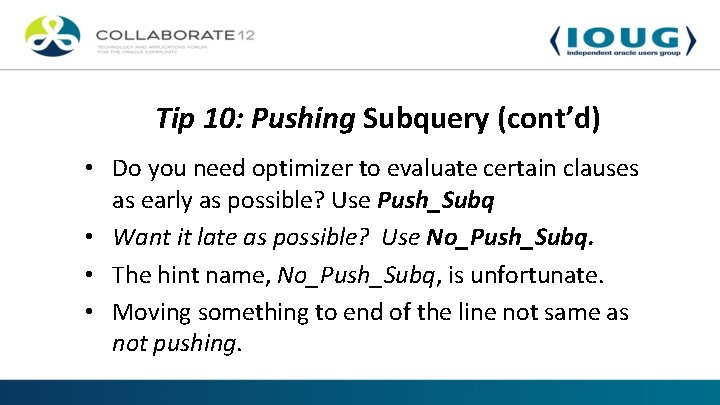
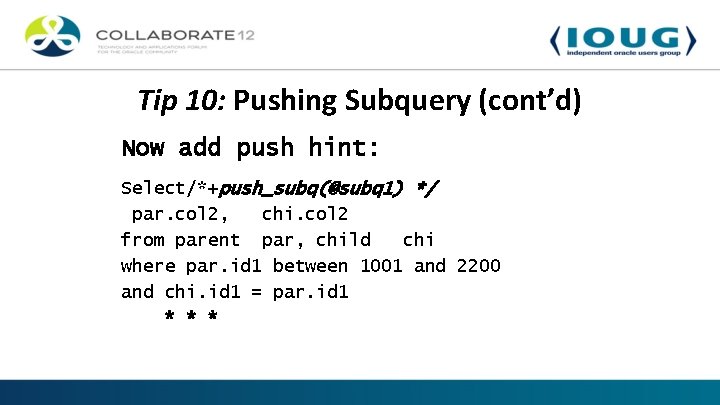
Tip 10: Pushing Subquery (cont’d) • Do you need optimizer to evaluate certain clauses as early as possible? Use Push_Subq • Want it late as possible? Use No_Push_Subq. • The hint name, No_Push_Subq, is unfortunate. • Moving something to end of the line not same as not pushing.

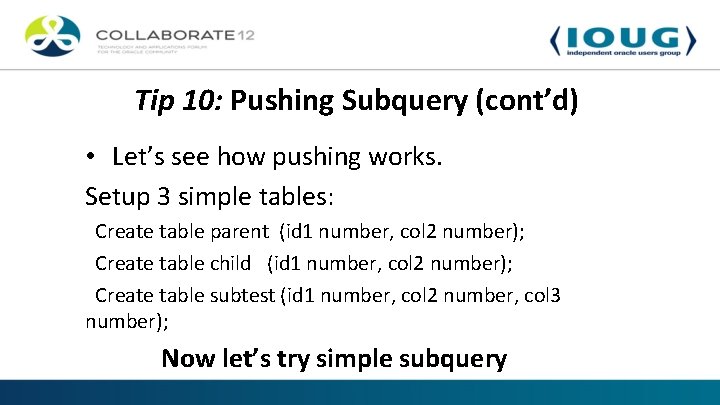
Tip 10: Pushing Subquery (cont’d) • Let’s see how pushing works. Setup 3 simple tables: Create table parent (id 1 number, col 2 number); Create table child (id 1 number, col 2 number); Create table subtest (id 1 number, col 2 number, col 3 number); Now let’s try simple subquery

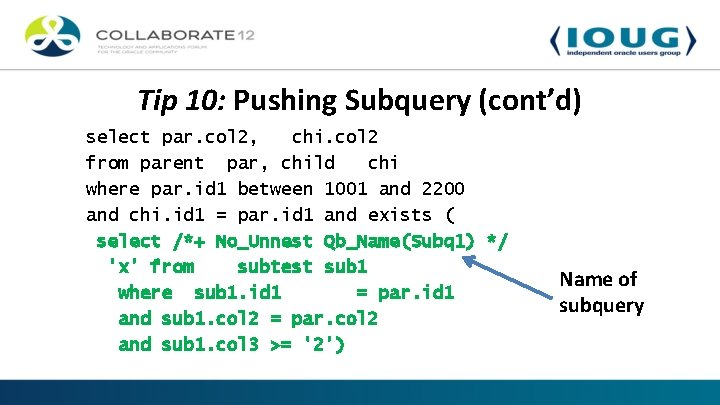
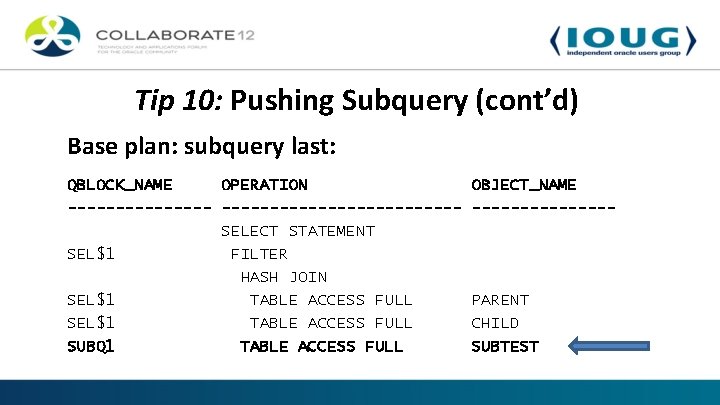
Tip 10: Pushing Subquery (cont’d) select par. col 2, chi. col 2 from parent par, child chi where par. id 1 between 1001 and 2200 and chi. id 1 = par. id 1 and exists ( select /*+ No_Unnest Qb_Name(Subq 1) */ 'x' from subtest sub 1 where sub 1. id 1 = par. id 1 and sub 1. col 2 = par. col 2 and sub 1. col 3 >= '2') Name of subquery

Tip 10: Pushing Subquery (cont’d) Base plan: subquery last: QBLOCK_NAME OPERATION --------------------SELECT STATEMENT SEL$1 FILTER HASH JOIN SEL$1 TABLE ACCESS FULL SUBQ 1 TABLE ACCESS FULL OBJECT_NAME -------- PARENT CHILD SUBTEST

Tip 10: Pushing Subquery (cont’d) Now add push hint: Select/*+push_subq(@subq 1) */ par. col 2, chi. col 2 from parent par, child chi where par. id 1 between 1001 and 2200 and chi. id 1 = par. id 1 * * *

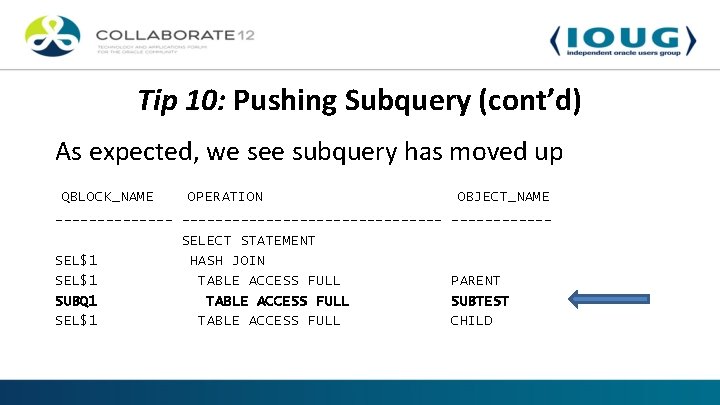
Tip 10: Pushing Subquery (cont’d) As expected, we see subquery has moved up QBLOCK_NAME OPERATION ----------------------SELECT STATEMENT SEL$1 HASH JOIN SEL$1 TABLE ACCESS FULL SUBQ 1 TABLE ACCESS FULL SEL$1 TABLE ACCESS FULL OBJECT_NAME ------ PARENT SUBTEST CHILD

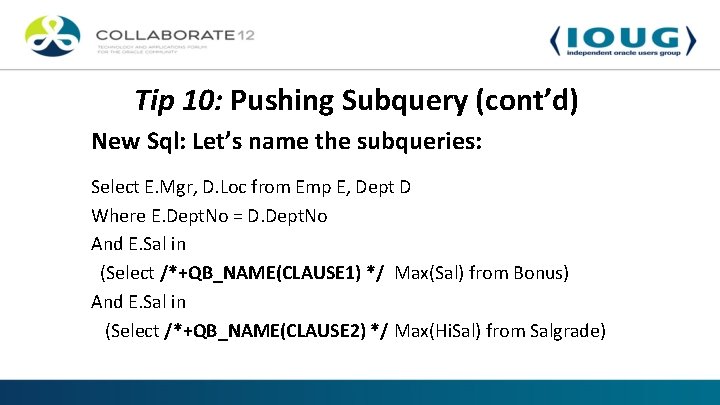
Tip 10: Pushing Subquery (cont’d) New Sql: Let’s name the subqueries: Select E. Mgr, D. Loc from Emp E, Dept D Where E. Dept. No = D. Dept. No And E. Sal in (Select /*+QB_NAME(CLAUSE 1) */ Max(Sal) from Bonus) And E. Sal in (Select /*+QB_NAME(CLAUSE 2) */ Max(Hi. Sal) from Salgrade)

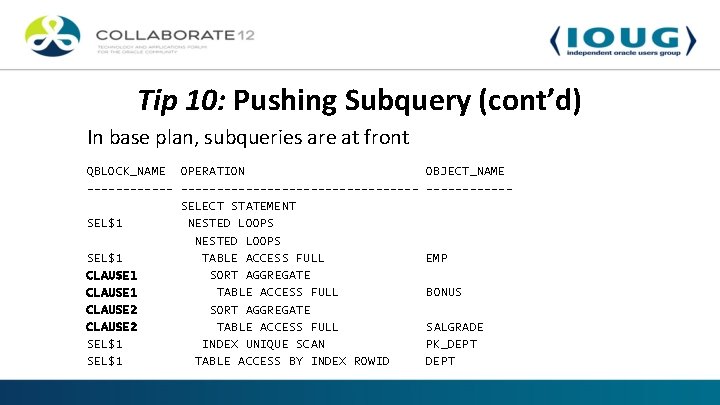
Tip 10: Pushing Subquery (cont’d) In base plan, subqueries are at front QBLOCK_NAME OPERATION ----------------------SELECT STATEMENT SEL$1 NESTED LOOPS SEL$1 TABLE ACCESS FULL CLAUSE 1 SORT AGGREGATE CLAUSE 1 TABLE ACCESS FULL CLAUSE 2 SORT AGGREGATE CLAUSE 2 TABLE ACCESS FULL SEL$1 INDEX UNIQUE SCAN SEL$1 TABLE ACCESS BY INDEX ROWID OBJECT_NAME ------ EMP BONUS SALGRADE PK_DEPT

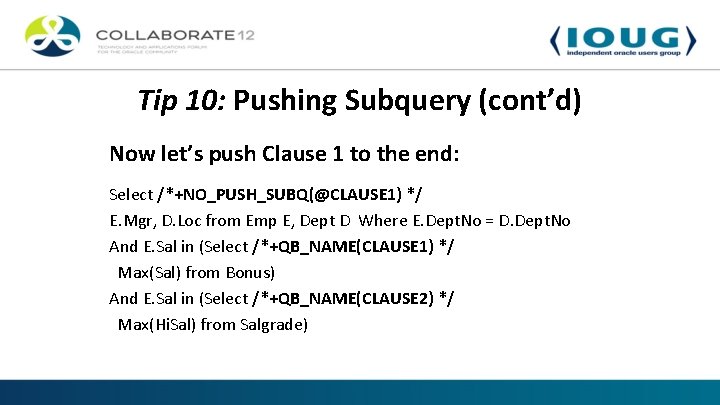
Tip 10: Pushing Subquery (cont’d) Now let’s push Clause 1 to the end: Select /*+NO_PUSH_SUBQ(@CLAUSE 1) */ E. Mgr, D. Loc from Emp E, Dept D Where E. Dept. No = D. Dept. No And E. Sal in (Select /*+QB_NAME(CLAUSE 1) */ Max(Sal) from Bonus) And E. Sal in (Select /*+QB_NAME(CLAUSE 2) */ Max(Hi. Sal) from Salgrade)

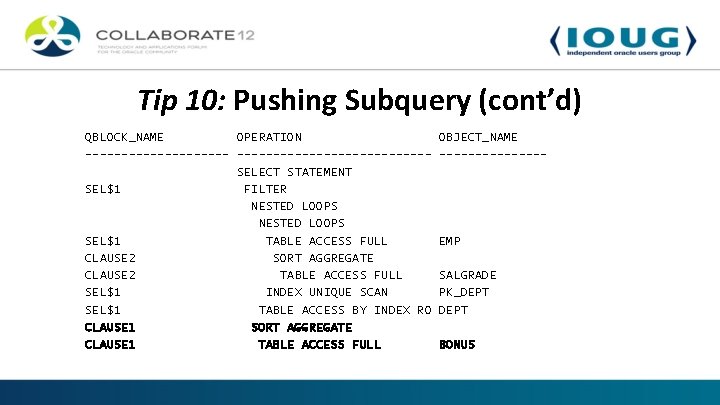
Tip 10: Pushing Subquery (cont’d) QBLOCK_NAME OPERATION --------------------------SELECT STATEMENT SEL$1 FILTER NESTED LOOPS SEL$1 TABLE ACCESS FULL CLAUSE 2 SORT AGGREGATE CLAUSE 2 TABLE ACCESS FULL SEL$1 INDEX UNIQUE SCAN SEL$1 TABLE ACCESS BY INDEX RO CLAUSE 1 SORT AGGREGATE CLAUSE 1 TABLE ACCESS FULL OBJECT_NAME -------- EMP SALGRADE PK_DEPT BONUS

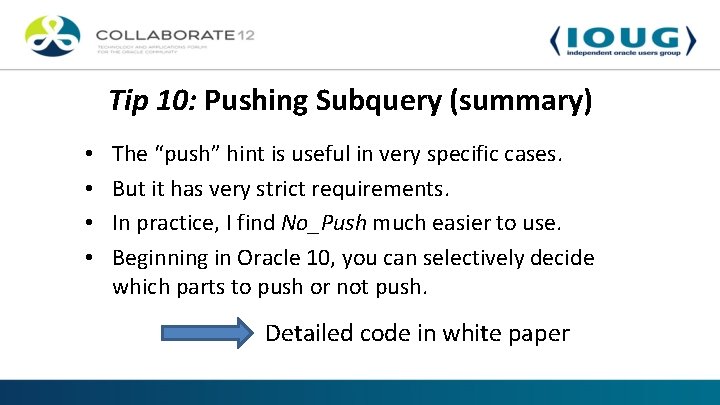
Tip 10: Pushing Subquery (summary) • • The “push” hint is useful in very specific cases. But it has very strict requirements. In practice, I find No_Push much easier to use. Beginning in Oracle 10, you can selectively decide which parts to push or not push. Detailed code in white paper

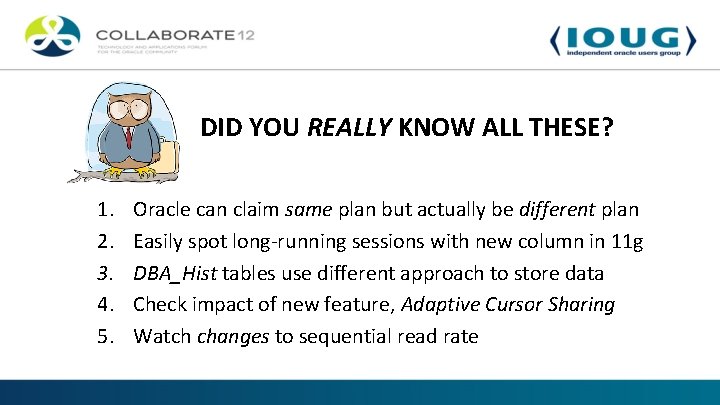
DID YOU REALLY KNOW ALL THESE? 1. 2. 3. 4. 5. Oracle can claim same plan but actually be different plan Easily spot long-running sessions with new column in 11 g DBA_Hist tables use different approach to store data Check impact of new feature, Adaptive Cursor Sharing Watch changes to sequential read rate

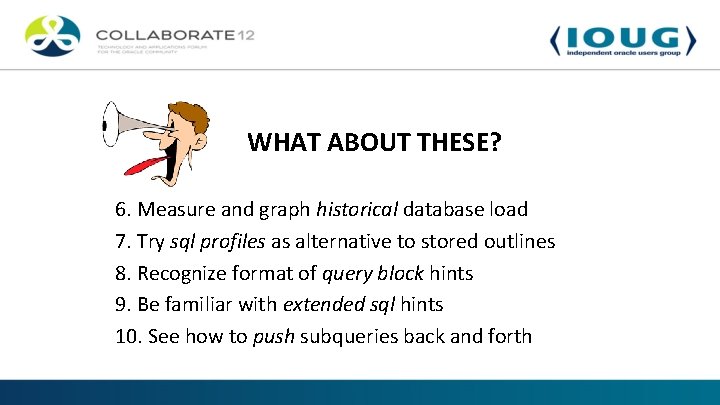
WHAT ABOUT THESE? 6. Measure and graph historical database load 7. Try sql profiles as alternative to stored outlines 8. Recognize format of query block hints 9. Be familiar with extended sql hints 10. See how to push subqueries back and forth

Sharing Tips • • • Sharing ideas is a hallmark of a top DBA. We all should be open to sharing our best ideas, and be open to learning from others. I hope to hear from you soon! Chris@Oracle. Magician. com