Systems Analysis and Design with UML System Analysis


 Implementation Analysis (New System) (System Specification) Design (System")


 Questionnaires")


")


 2. BPI (Business Process Improvement)")


 – Paths of execution through")


")
")


")


")


 Actor Type Description Simple")
 Use-Case Type Description")


 = UUCP * TCF")
 If the sum of (number of Efactors E 1 through")
 • Now it’s time to compute effort • Let F")


 Pekerjaan Man-Month Budget Total Planning 1 2 5000. 000 10. 000")
 Product Total LMS 10. 000 Teleconference 2. 000 Chatting 4. 000")


- Slides: 151
Systems Analysis and Design with UML: System Analysis
Contents 1. Introduction 2. Project Planning 3. System Analysis 4. System Design 5. System Implementation
3. SYSTEM ANALYSIS
Learning Objectives 1. Understand how to create a requirements definition 2. Become familiar with requirements analysis techniques 3. Understand when to use each requirements analysis technique 4. Understand how to gather requirements using interviews, JAD sessions, questionnaires, document analysis, and observation 5. Understand when to use each requirements-gathering technique 6. Understand the business process modeling
SDLC and Deliverables Planning (System Proposal) Implementation Analysis (New System) (System Specification) Design (System Specification)
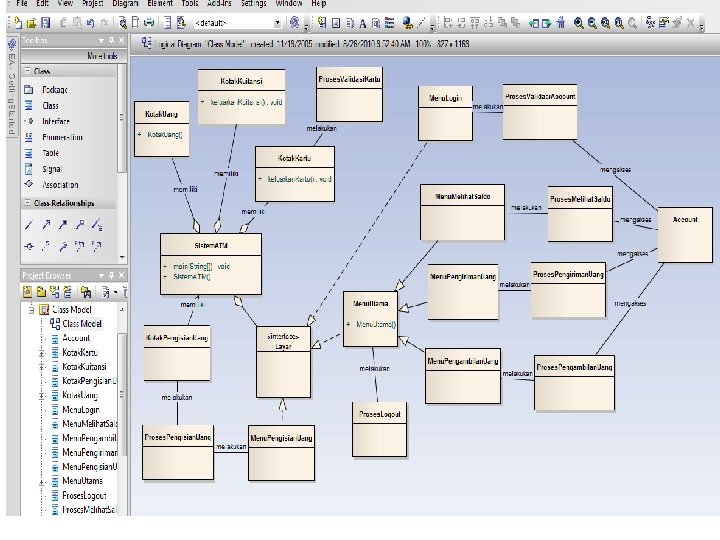
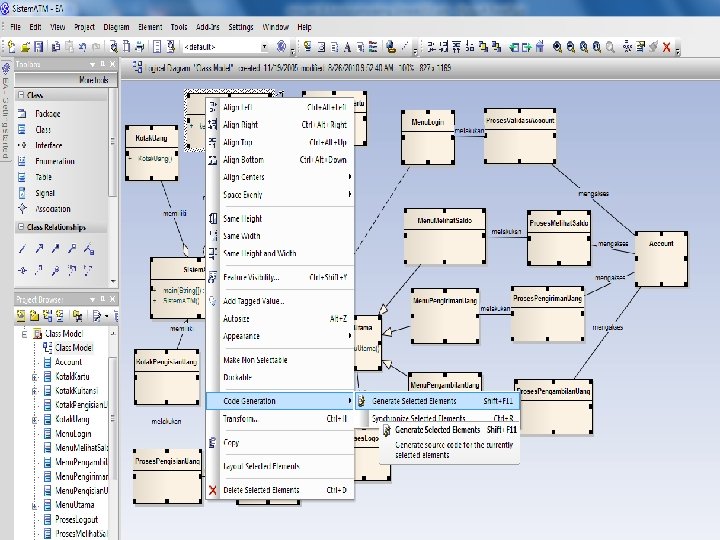
System Analysis and Design with UML 1. System Analysis 1. Business Process Identification § 2. Use Case Diagram Business Process Modeling § 3. Activity Diagram or Business Process Modeling Notation (BPMN) Business Process Realization § Sequence Diagram (Buat untuk setiap use case dengan menggunakan pola Boundary-Control-Entity) 2. System Design 1. Program Design 1. 2. 3. Class Diagram (Gabungkan Boundary-Control-Entity Class dan susun story dari sistem yang dibangun) Package Diagram (Gabungan class yang sesuai, boleh menggunakan pola B-C-E) Deployment Diagram (arsitektur software dari sistem yang dibangun) User Interface Design (Buat UI design dari Boundary Class) Entity-Relationship Model (Buat ER diagram dari Entity Class)
Requirement Gathering
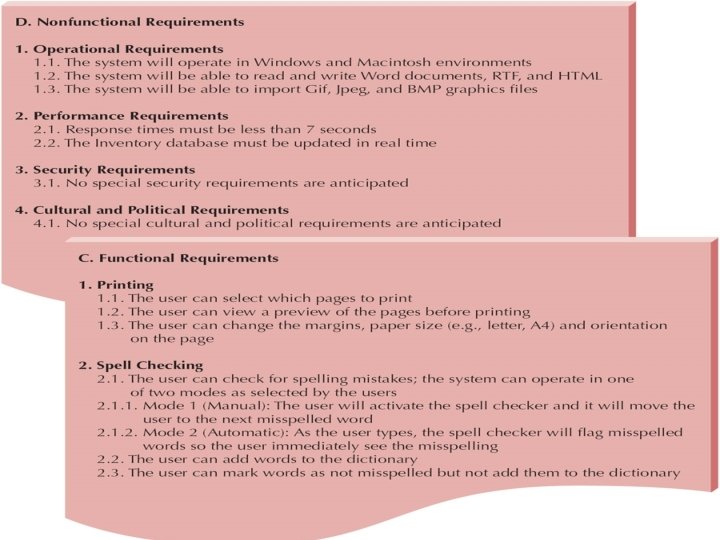
What is a Requirement • Business Requirement – Statement of what the system must do – Focus on what the system must do, not how to do it • There are 2 kinds of requirements 1. Functional 2. Nonfunctional
Functional Requirement • Defines the functions of the system must carry out • Specifies the process that must be performed • Examples: – Diagrams: • Activity Diagrams • Use Case Diagrams – Problem Statements: • Must search for inventory • Must perform these calculations • Must produce a specific report
Nonfunctional Requirements Deals with how the system behaves: 1. Operational – Physical/technical environment 2. Performance – Speed and reliability 3. Security – Who can use the system 4. Cultural & Political – Company policies, legal issues
Requirement Gathering Methods 1. 2. 3. 4. 5. Interviews Joint Application Design (JAD) Questionnaires Document Analysis Observation
1. Interviews
Interviews • Most commonly used technique • Very natural – If you need to know something, you ask someone • Five basic steps: 1. 2. 3. 4. 5. Selecting interviewees Designing interview questions Preparing for the interview Conducting the interview Post-interview follow-up
2. Joint Application Development (JAD)
JAD Key Ideas • Allows project managers, users, and developers to work together • May reduce scope creep by 50% • Avoids requirements being too specific or too vague
JAD Meeting Room JPEG Figure 5 -5 Goes Here
The JAD Session • • • Include 10 to 20 users Tend to last 5 to 10 days over a three week period Prepare questions as with interviews Formal agenda and groundrules Facilitator activities – – – Stay neutral Keep session on track Help with technical terms and jargon Record group input Help resolve issues • Post-session follow-up
3. Questionaires
Questionnaire Steps 1. Selecting participants – Using samples of the population 2. Designing the questionnaire – More important than interview questions – Prioritize questions to grab attention – Distinguish between • Fact-oriented questions (specific answers) • Opinion questions (agree – disagree scale) – Test the questionnaire on colleagues
Questionnaire Steps 3. Administering the questionnaire – – – Need to get good response rate Explain its importance & how it will be used Give expected response date Follow up on late returns Have supervisors follow up Promise to report results 4. Questionnaire follow-up – Send results to participants
4. Document Analysis
Document Analysis • Provides clues about the "formal" existing As. Is system • Typical documents – Forms – Reports – Policy manuals • Look for user additions to forms • Look for unused form elements • Do document analysis before interviews
5. Observation
Observation • Users/managers often don’t remember everything they do • Validates info gathered in other ways • Behaviors change when people are watched • Keep low profile, don’t change the process • Careful not to ignore periodic activities – Weekly … Monthly … Annual
Selecting the Appropriate Techniques Interviews JAD Type of Information As-Is Improve. To-Be Depth of Information High Breadth of Information Low Integration of Info. Low Questionnaires Observation As-Is Medium Low Medium High Low Low User Medium Involvement High Low Low Cost Low. Medium As-Is Improve. To-Be Document Analysis Low Low. Medium
Business Process Analysis
Business Process Analysis Steps
Business Process Analysis Strategies 1. BPA (Business Process Automation) 2. BPI (Business Process Improvement) 3. BPR (Business Process Reengineering)
Business Process Automation • Makes almost no changes to business processes – Just makes them more efficient • Improves efficiency by automating the business processes • Least impact on users – They do the same things, just more efficiently
Business Process Improvement • Goal is to improve the business processes • Change what the users do, not just how efficiently they do it • Changes to business process must be decided first • Decisions to change the business processes cannot be made by the analyst
Business Process Reengineering “Fundamental rethinking and radical redesign of business processes to achieve dramatic improvements…” • Throw away everything • Start with a blank page • Appealing, but very expensive and risky
Strategy Comparation Business Process Automation Business Process Improvement Business Process Reeingineering Potential Business Value Low-Moderate High Project Cost Low-Moderate High Breadth of Analysis Narrow-Moderate Very Broad Risk Low-Moderate Very High
Business Process Identification
System Analysis and Design with UML 1. System Analysis 1. Business Process Identification § 2. Use Case Diagram Business Process Modeling § 3. Activity Diagram or Business Process Modeling Notation (BPMN) Business Process Realization § Sequence Diagram (Buat untuk setiap use case dengan menggunakan pola Boundary-Control-Entity) 2. System Design 1. Program Design 1. 2. 3. Class Diagram (Gabungkan Boundary-Control-Entity Class dan susun story dari sistem yang dibangun) Package Diagram (Gabungan class yang sesuai, boleh menggunakan pola B-C-E) Deployment Diagram (arsitektur software dari sistem yang dibangun) User Interface Design (Buat UI design dari Boundary Class) Entity-Relationship Model (Buat ER diagram dari Entity Class)
Use Case Diagram
Use Case • A formal way of representing how a business interacts with its environment • The discrete activities performed by the user • Use cases are logical models that describe the activities of a system • Used to document the As-Is system, or to develop the To-Be system
Use Case Diagrams • Summarized into a single picture • All of the use cases for the part of the system being modeled • Use Case Diagram tells what the system will do • Good for communicating with users
Use Case Diagram Syntax • Actor – person or system that derives benefit from and is external to the subject • Use Case • • – Represents a major piece of system functionality Association Relationship Include Relationship Extend Relationship Generalization Relationship <<includes>> <<extends>>
Use Case • A major piece of system functionality Use Case • Can extend other Use Cases • Placed inside system boundary • Labeled with descriptive verb - noun phrase
System Boundary • Includes the name of the system inside or on top • Represents the scope of the system • Actors are outside the scope of the system
Actor • A person or another system that interacts with the current system • A role, not a specific user • Provides input, receives output, or both actor Actor/Role
Association Relationship • Links actor and the Use Case • Shows two-way communication – If one-way, arrows are used • * is for "multiplicity of the Association" * *
Extends Relationship • Extends Use Case to include Optional behavior • Arrow points from the extension Use Case to the base Use Case extend Make Pmt Arrangements extend Make Appointment
Include Relationship • Include one Use Case from within another • Arrow points from base Use Case to the included Use Case include Record Availability include Manage Schedule
Generalization Relationship • A specialized Use Case to a more generalized Use Case • Arrow points from specialized to general Use Case Make Old Appointment Make Appointment
Use Case Diagram for Appointment System
Use Case Diagram with Specialized Actor
Sample Use Case
Extend and Include Relationships
Business Process Modeling
System Analysis and Design with UML 1. System Analysis 1. Business Process Identification § 2. Use Case Diagram Business Process Modeling § 3. Activity Diagram or Business Process Modeling Notation (BPMN) Business Process Realization § Sequence Diagram (Buat untuk setiap use case dengan menggunakan pola Boundary-Control-Entity) 2. System Design 1. Program Design 1. 2. 3. Class Diagram (Gabungkan Boundary-Control-Entity Class dan susun story dari sistem yang dibangun) Package Diagram (Gabungan class yang sesuai, boleh menggunakan pola B-C-E) Deployment Diagram (arsitektur software dari sistem yang dibangun) User Interface Design (Buat UI design dari Boundary Class) Entity-Relationship Model (Buat ER diagram dari Entity Class)
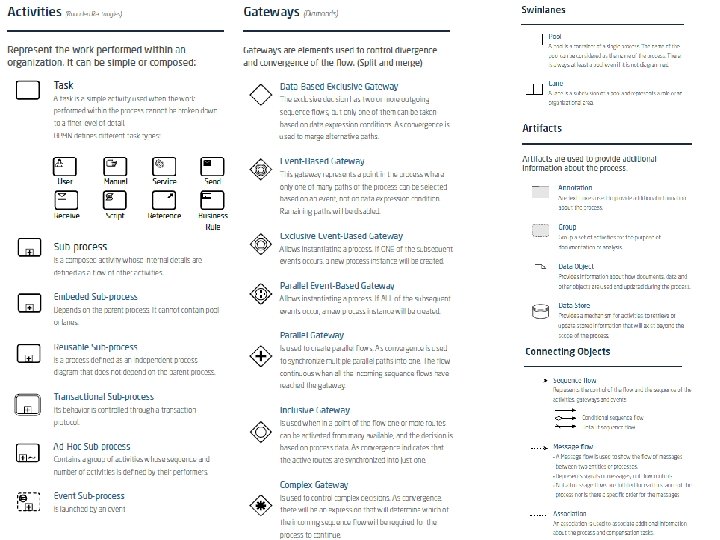
Business Process Modeling with Activity Diagrams Elements of an Activity Diagram Guidelines for Creating Activity Diagrams
BPM With Activity Diagrams • A number of activities support a business process across several departments • Activity diagrams model the behavior in a business process
Actions and Activities • Performed for a specific business reason • Names begin with a verb and end with a noun – “Make Appointment” • Each activity normally associated with a use case
Object Nodes • Activity and Actions usually modify objects • Object nodes model these objects • Objects represent a flow of information from between activities or actions
Control & Object Flows • Control Flows (solid line) – Paths of execution through the business process – Can only be attached to actions or activities • Object Flows (dashed line) – Model the flow of objects through a business process – Show actual objects entering and exiting the system – An object is on one end, an action or activity is on the other end
Control Nodes 1. 2. 3. 4. 5. 6. 7. Initial – Only one, at top left Final Activity – Stop the process Final Flow – Stop this flow only Decision – Guarded test conditions Merge – Following decisions Fork – Split parallel execution Join – Join parallel execution
Swimlanes • The business process may be broken into persons of responsibility • Identify this with swimlanes
Activity Diagram Example
Creating Activity Diagrams 1. Set the context or scope of the activity being modeled 2. Identify the activities and control/object flows between activities 3. Identify any decisions made 4. Look for opportunities for parallelism 5. Draw the diagram
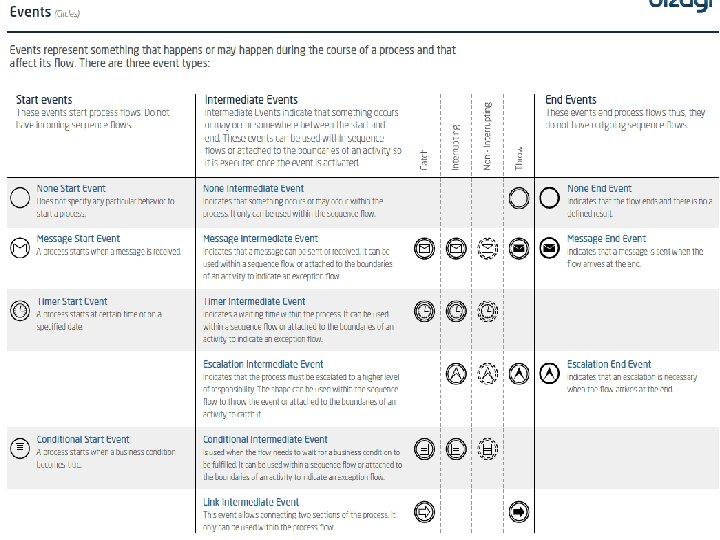
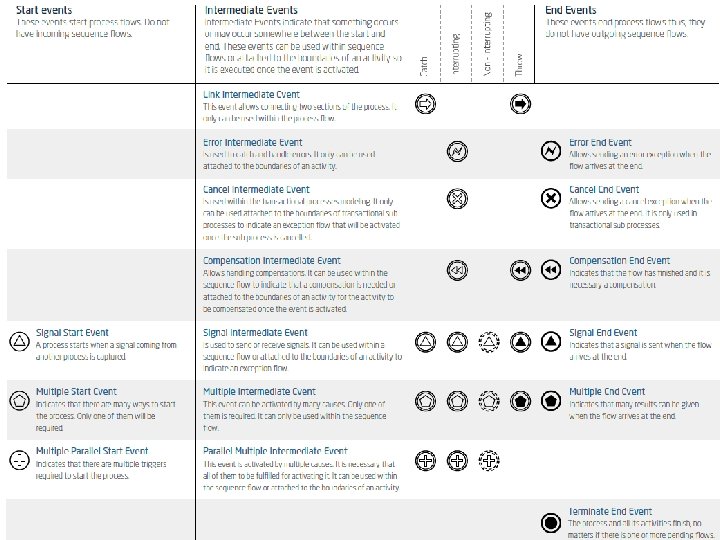
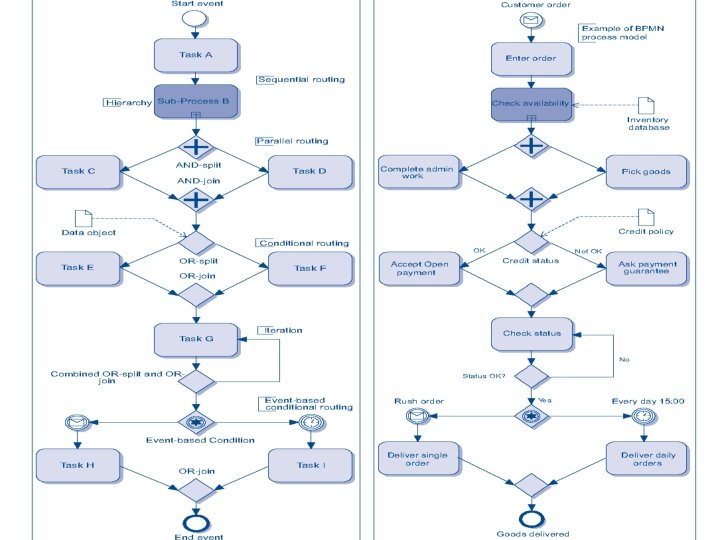
Business Process Modeling with BPMN
Credit Application
Purchase Request
Shipment Process of a Hardware Retailer
The Pizza Collaboration
Order Fulfillment and Procurement
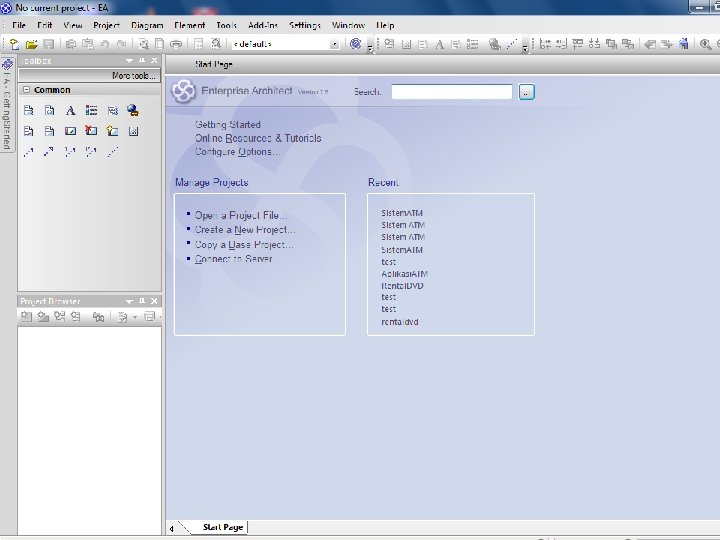
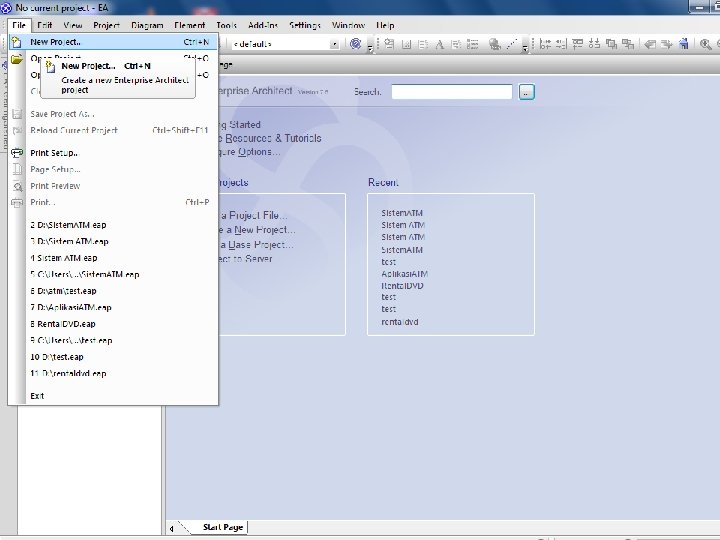
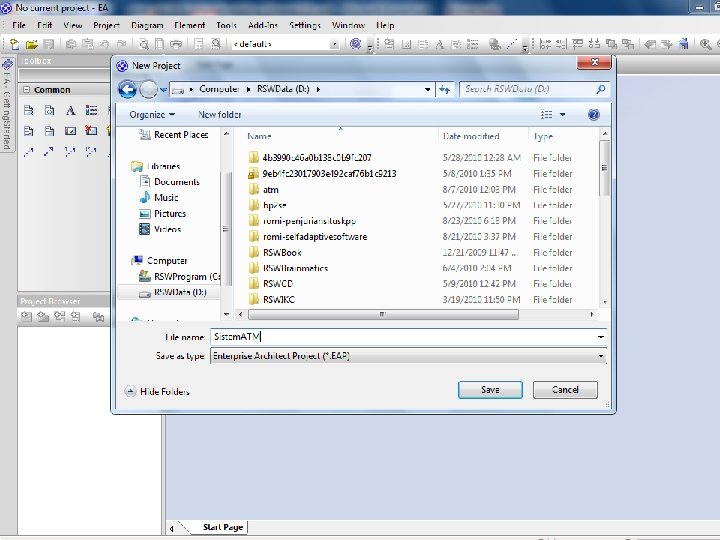
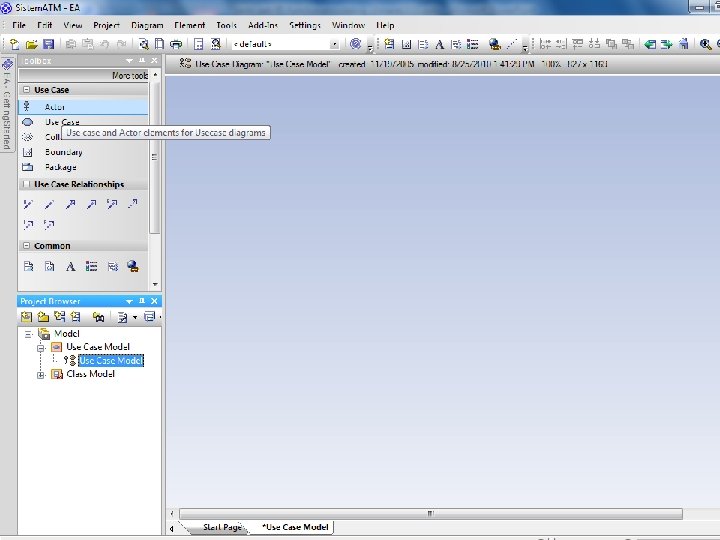
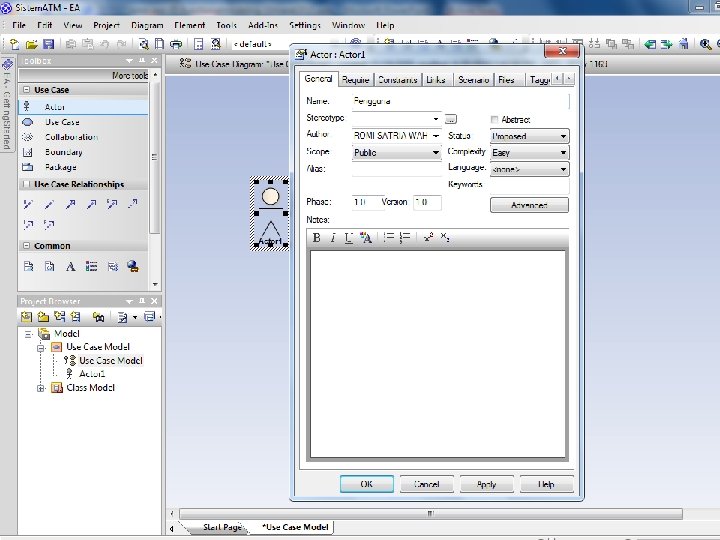
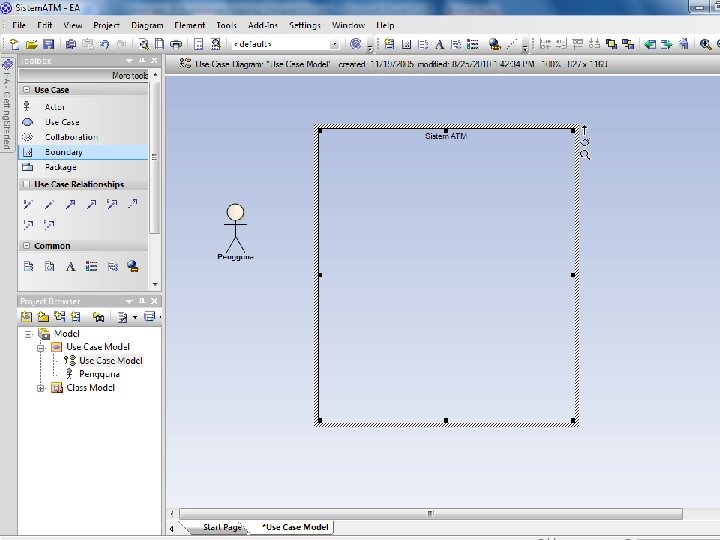
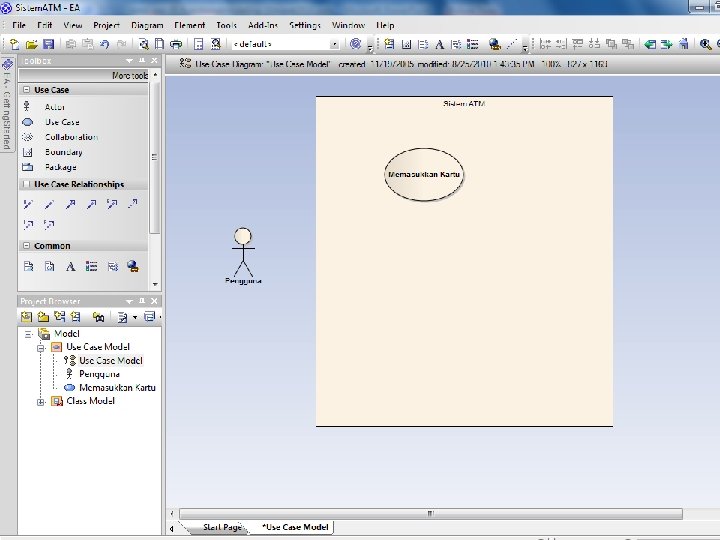
Studi Kasus: ATM System
ATM System
User Interface Design Layar Kotak Uang Kotak Kartu Kotak Kuitansi
Masukkan PIN: Kotak Uang Kotak Kartu Kotak Kuitansi
Menu Utama 1. Melihat Saldo 2. Mengirim Uang 3. Mengambil Uang 4. Logout Kotak Uang Kotak Kartu Kotak Kuitansi
Menu Melihat Saldo 1. Saldo anda adalah …. Kotak Uang Kotak Kartu Kotak Kuitansi
Menu Mengirim Uang 1. No Account Penerima: Kotak Uang Kotak Kartu Kotak Kuitansi
Menu Mengirim Uang 1. Jumlah uang yang dikirim: Kotak Uang Kotak Kartu Kotak Kuitansi
Menu Mengirim Uang 1. Uang berhasil terkirim Kotak Uang Kotak Kartu Kotak Kuitansi
Menu Mengambil Uang 1. Jumlah uang yang diambil: Kotak Uang Kotak Kartu Kotak Kuitansi
Menu Mengambil Uang berhasil diambil Kotak Uang Kotak Kartu Kotak Kuitansi
Activity Diagram (Business Process)
Activity Diagram with Partition (Business Process)
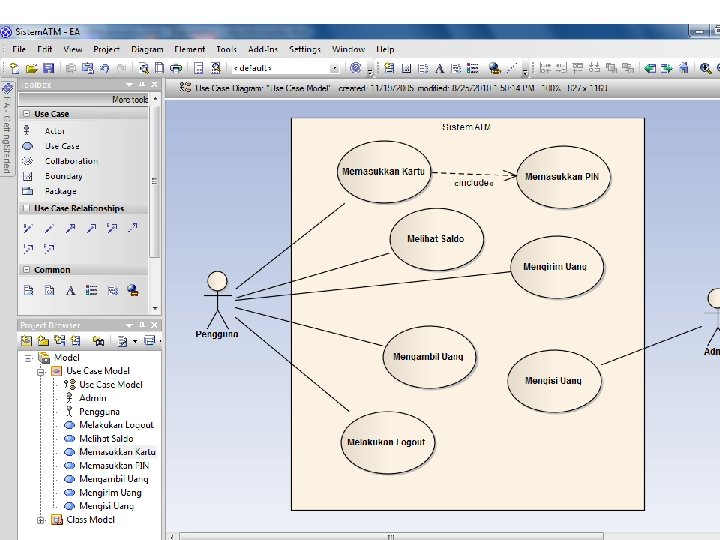
Use Case Diagram
Use Case Diagram (Multi Actors)
Exercise: Business Process Modeling Lihat kembali System Request yang sudah anda buat, lengkapi diagram tersebut dengan dua diagram UML di bawah: 1. Use Case Diagram 2. Activity Diagram
Business Process Realization
System Analysis and Design with UML 1. System Analysis 1. Business Process Identification § 2. Use Case Diagram Business Process Modeling § 3. Activity Diagram or Business Process Modeling Notation (BPMN) Business Process Realization § Sequence Diagram (Buat untuk setiap use case dengan menggunakan pola Boundary-Control-Entity) 2. System Design 1. Program Design 1. 2. 3. Class Diagram (Gabungkan Boundary-Control-Entity Class dan susun story dari sistem yang dibangun) Package Diagram (Gabungan class yang sesuai, boleh menggunakan pola B-C-E) Deployment Diagram (arsitektur software dari sistem yang dibangun) User Interface Design (Buat UI design dari Boundary Class) Entity-Relationship Model (Buat ER diagram dari Entity Class)
Sequence Diagram
Sequence Diagrams • Illustrate the objects that participate in a use case • Show the messages that pass between objects for a particular use-case over time
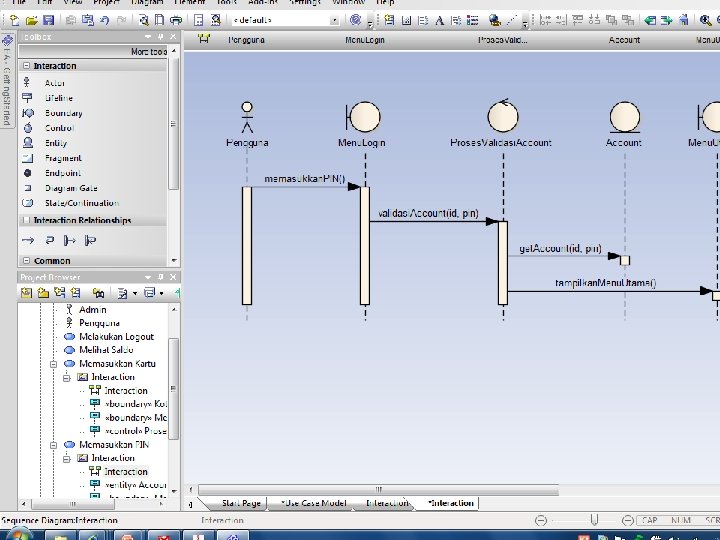
Sequence Diagram Syntax AN ACTOR AN OBJECT an. Object: a. Class A LIFELINE A FOCUS OF CONTROL A MESSAGE OBJECT DESTRUCTION a. Message() x
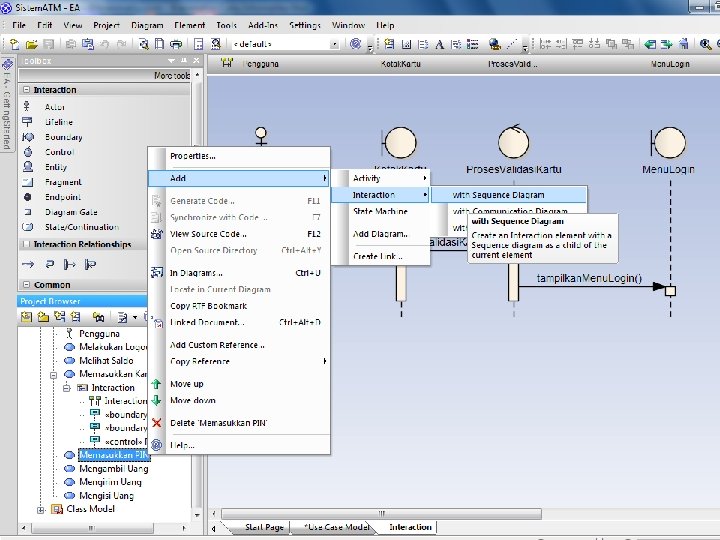
Sequence Diagram 1. Susun Sequence Diagram untuk setiap Use Case yang dibuat 2. Mulai dari menarik Actor yang ada di Use Case Diagram, lanjutkan dengan membuat sequence detail dari berjalannya Use Catatan: Objek dari Lifeline di Sequence Diagram akan menjadi kandidat Class
Jenis Class 1. Boundary Class: 1. Class yang berinteraksi dengan aktor langsung (user interface) 2. Form, input, UI ini masuk di sini 2. Control Class: 1. Class yang berhubungan dengan pemrosesan, penghitungan, kalkulasi, komputasi, query, dst 3. Entity Class: 1. Class yang berhubungan dengan data, penyimpanan data/file
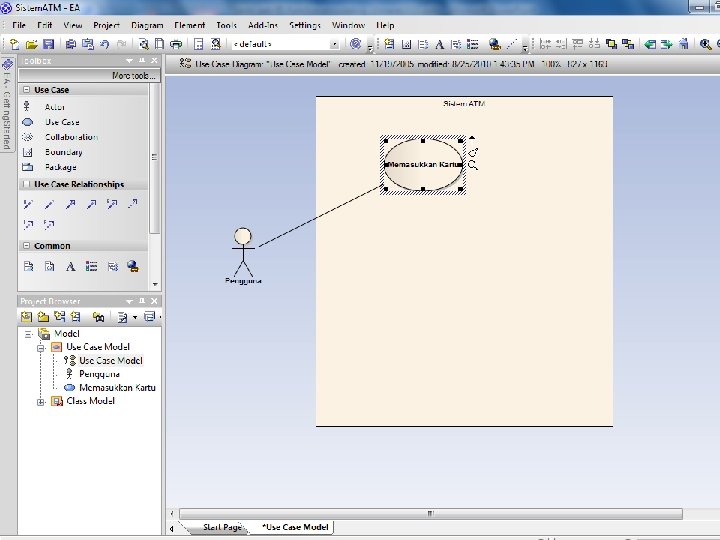
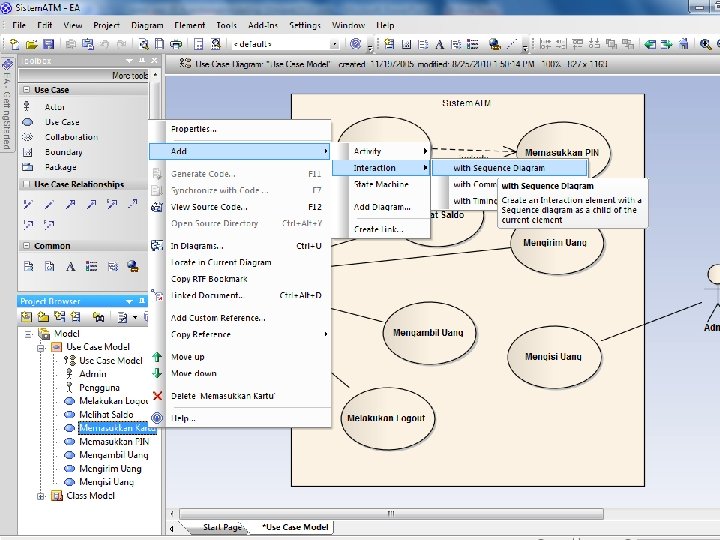
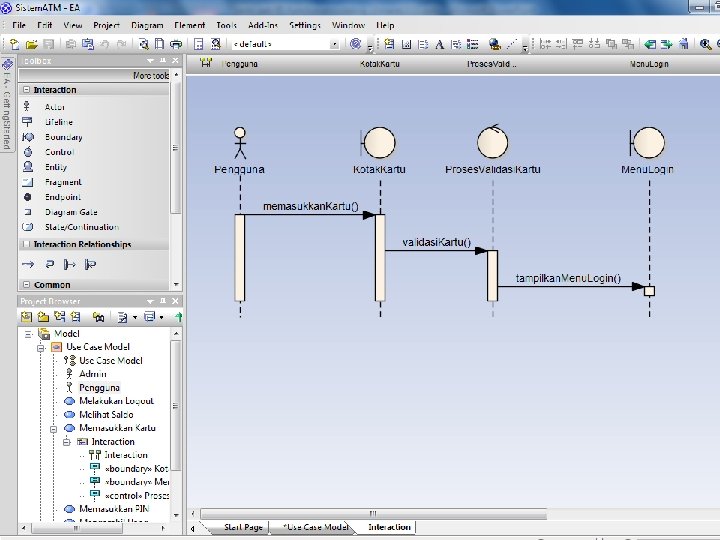
Sequence Diagram: Memasukkan Kartu
Sequence Diagram: Memasukkan PIN
Sequence Diagram: Melihat Saldo
Sequence Diagram: Mengirim Uang
Sequence Diagram: Mengambil Uang
Sequence Diagram: Melakukan Logout
Exercise: Sequence Diagram 1. Lihat kembali System Request, Use Case Diagram, dan Activity Diagram yang sudah anda buat 2. Lengkapi diagram tersebut dengan Sequence Diagram pada setiap Use Case yang dibuat
Collaboration Diagram
Collaboration Diagrams • Essentially an object diagram that shows – Message passing relationships – Instead associations • Emphasize – The flow of messages among objects – Rather than timing and ordering of messages
Collaboration Diagram Syntax AN ACTOR AN OBJECT an. Object: a. Class AN ASSOCIATION A MESSAGE a. Message()
Example Collaboration Diagram
State Machine Diagram
Behavioral State Machines • Some objects may change states often • Some may change state and never change back – Patient: new current former • This is seen in the cells of the CRUD matrix
Behavioral State Machines • The behavioral state machine is a dynamic model that shows this • The behavioral state machine shows – The different states of an object – The events • That cause the object to change from one state to another
Components of Statechart Diagrams • States – Determined by the values of the attributes • Events – Changes the state of an object – e. g. changes the values of attributes
Components of Statechart Diagrams • Transitions – Movement of an object from one state to another – Often has a guard condition • Actions – Atomic process, takes "zero time" • Activities – Non-atomic, take a long time, can be started and stopped
Statechart Diagram Syntax A STATE a. State AN INITIAL STATE A FINAL STATE AN EVENT A TRANSITION an. Event
Example Behavioral State Machine Diagram
Building Behavioral State Machine Diagrams • Set the context • Identify – Initial state – Final state – All stable states • Determine the order in which the object will pass through stable states • Identify the events, actions, and guard conditions associated with the transitions • Validate the diagram
Estimating Project Size with Use Case Points
Use Case Points • Alternative to Function Point Approach • Classify actors and use cases as: 1. Simple 2. Average 3. Complex (Gustav Karner, 1993)
Actor and Use Case Weighting Tables Unadjusted Actor Weighting (UAW) Actor Type Description Simple Weighting Factor External System with welldefined API Average External System using a protocol-based interface, e. g. , HTTP, TCT/IP, SQL 1 Comple Human x 3 2
Actor and Use Case Weighting Tables Unadjusted Use Case Weighting (UUCW) Use-Case Type Description Simple Average Complex 1 -3 transactions 4 -7 transactions More than 7 transactions Weighting Factor 5 10 15 Unadjusted Use Case Points (UUCP) = UAW + UUCW
Technical Complexity Factors Factor Number T 1 T 2 Description T 3 T 4 T 5 T 6 T 7 T 8 T 9 End-user online efficiency Complex internal processing Reusability of code Easy to install Ease of use Portability Ease of change Distributed system Response time or throughput performance objectives Weig ht 2. 0 1. 0 0. 5 2. 0 1. 0 Technical Complexity Factor (TCF) = 0. 6 + (0. 01 * TFactor)
Environmental Factors Factor Description Number E 1 Familiarity with system development process in use Weight E 2 0. 5 E 3 E 4 E 5 E 6 E 7 E 8 Application experience 1. 5 Object-oriented experience 1. 0 Lead analyst capability 0. 5 Motivation 1. 0 Requirements stability 2. 0 Part time staff -1. 0 Difficulty of programming language -1. 0 Environmental Factor (EF) = 1. 4 + (-0. 03 * EFactor)
Computing Use Case Points • Adjusted Use Case Points (UCP) = UUCP * TCF * ECF • Effort in Person Hours = UCP * PHM
Person Hour Multiplier (PHM) If the sum of (number of Efactors E 1 through E 6 assigned value < 3) and (number of Efactors E 7 and E 8 assigned value > 3) ≤ 2 PHM = 20 Else If the sum of (number of Efactors E 1 through E 6 assigned value < 3) and (number of Efactors E 7 and E 8 assigned value > 3) = 3 or 4 PHM 28 Else Rethink project; it has too high of a risk for failure
Person Hour Multiplier (PHM) • Now it’s time to compute effort • Let F 1 = Number of E 1 to E 6 that are < 3 • Let F 2 = Number of E 7 and E 8 that are > 3 • If F 1 + F 2 <= 2 PHM = 20 Else if F 1 + F 2 = 3 or 4 PHM = 28 Else Scrap the project
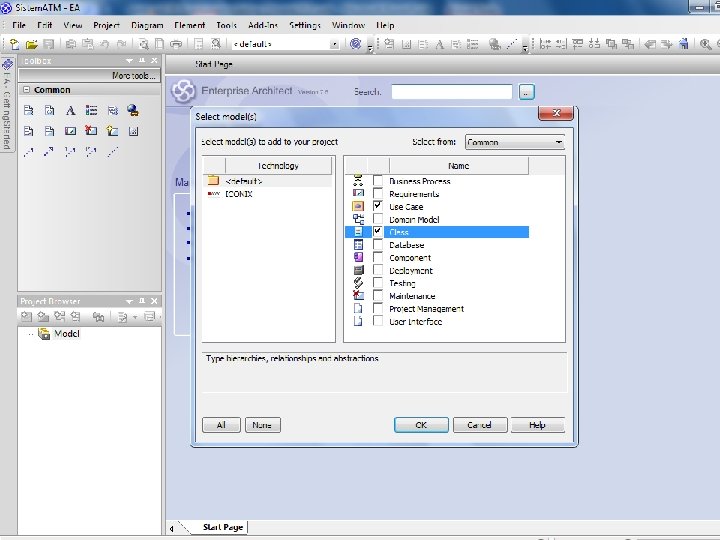
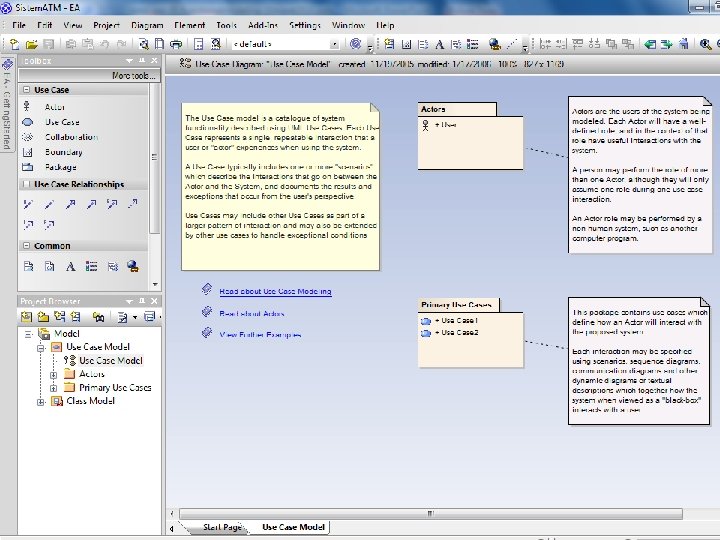
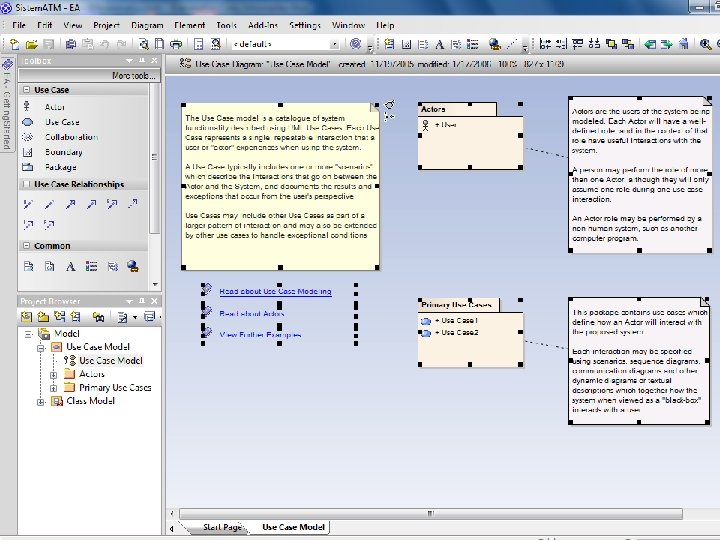
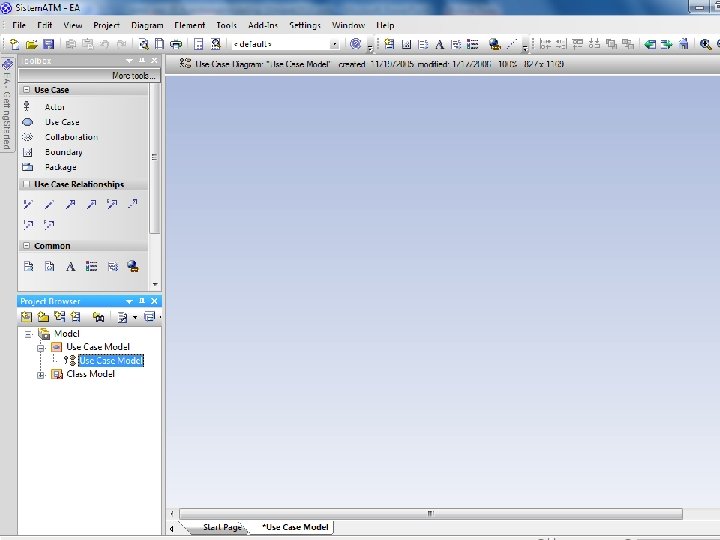
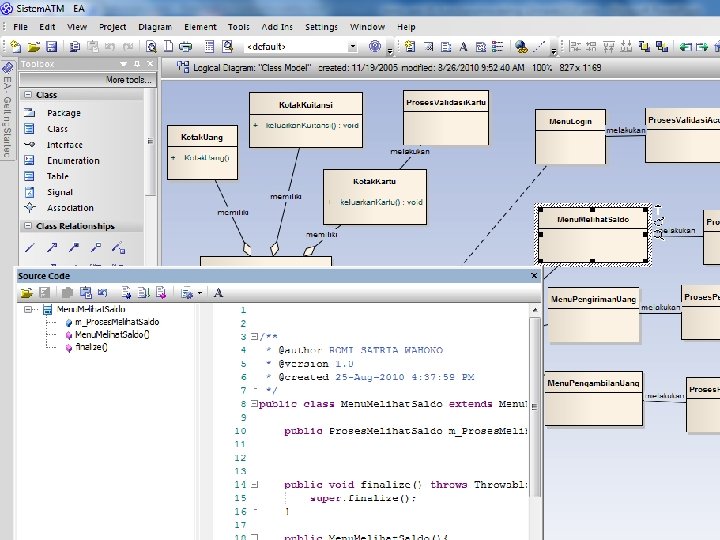
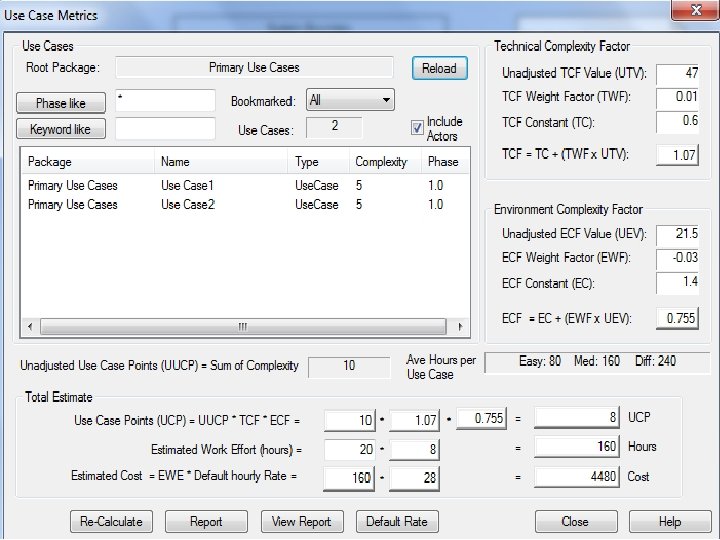
Use Case Points in EA
Effort Estimation from Time Defined TIME 4. 1 PM = 3. 0 PM 1/3 = 3. 0 * PM 1/3 = (4. 1/3) 3 = 2. 5 person-months
Budget (Custom Software) Pekerjaan Man-Month Budget Total Planning 1 2 5000. 000 10. 000 Analysis 2 2 10. 000 20. 000 Design 2 4 4000. 000 32. 000 Implementation 2 5 3000. 000 24. 000 Training 2 1 4000. 000 8000. 000 94. 000
Budget (Generic Software) Product Total LMS 10. 000 Teleconference 2. 000 Chatting 4. 000 e. Library 20. 000
Exercise: Project Size Estimation 1. Lihat kembali Use Case Diagram, dan Sequence Diagram yang telah anda buat 2. Estimasi Project Size, Effort dan Time dengan menggunakan Use Case Point
Referensi 1. Alan Dennis et al, Systems Analysis and Design with UML 4 th Edition, John Wiley and Sons, 2013 2. Kenneth E. Kendall and Julie E Kendall, Systems Analysis and Design 8 th Edition, Prentice Hall, 2010 3. Hassan Gomaa, Software Modeling and Design: UML, Use Cases, Patterns, and Software Architectures, Cambridge University Press, 2011 4. Gary B. Shelly and Harry J. Rosenblatt, Systems Analysis and Design 9 th Edition, Course Technology, 2011 5. Howard Podeswa, UML for the IT Business Analyst 2 nd Edition, Course Technology, 2009 6. Jeffrey A. Hoffer et al, Modern Systems Analysis and Design 6 th Edition, Prentice Hall, 2012