Systems Analysis and Design Alan Dennis Barbara Haley

Systems Analysis and Design Alan Dennis, Barbara Haley Wixom, and Roberta Roth John Wiley & Sons, Inc. Slides by Candace S. Garrod Red Rocks Community College 11 - 1 Power. Point Presentation for Dennis, Wixom, & Roth Systems Analysis and Design, 3 rd Edition Copyright 2006 © John Wiley & Sons, Inc. All rights reserved.

Program Design Chapter 11 11 - 2 Power. Point Presentation for Dennis, Wixom, & Roth Systems Analysis and Design, 3 rd Edition Copyright 2006 © John Wiley & Sons, Inc. All rights reserved.

Key Definitions Program design - creating instructions for the programmers The top-down, modular approach begin with the “big picture” and gradually add detail Program design document – all structure charts and specifications needed by programmers to implement the system 3 Power. Point Presentation for Dennis, Wixom, & Roth Systems Analysis and Design, 3 rd Edition Copyright 2006 © John Wiley & Sons, Inc. All rights reserved.

MOVING FROM LOGICAL TO PHYSICAL PROCESS MODELS Analysis phase – focus on logical processes and data flows Design phase – create physical process models showing “how” the final system will work Physical process models convey the “system view” of the new system 4 Power. Point Presentation for Dennis, Wixom, & Roth Systems Analysis and Design, 3 rd Edition Copyright 2006 © John Wiley & Sons, Inc. All rights reserved.

The Physical Data Flow Diagram The physical DFD contains the same components as the logical DFD, and the same rules apply There are five steps to perform to make the transition to the physical DFD 5 Power. Point Presentation for Dennis, Wixom, & Roth Systems Analysis and Design, 3 rd Edition Copyright 2006 © John Wiley & Sons, Inc. All rights reserved.

Steps to Create the Physical Data Flow Diagram 6 Power. Point Presentation for Dennis, Wixom, & Roth Systems Analysis and Design, 3 rd Edition Copyright 2006 © John Wiley & Sons, Inc. All rights reserved.
 7 Power. Point Presentation for Dennis, Wixom,")
The Physical Data Flow Diagram (The How) 7 Power. Point Presentation for Dennis, Wixom, & Roth Systems Analysis and Design, 3 rd Edition Copyright 2006 © John Wiley & Sons, Inc. All rights reserved.

8 Power. Point Presentation for Dennis, Wixom, & Roth Systems Analysis and Design, 3 rd Edition Copyright 2006 © John Wiley & Sons, Inc. All rights reserved.

9 Power. Point Presentation for Dennis, Wixom, & Roth Systems Analysis and Design, 3 rd Edition Copyright 2006 © John Wiley & Sons, Inc. All rights reserved.

DESIGNING PROGRAMS 10 Power. Point Presentation for Dennis, Wixom, & Roth Systems Analysis and Design, 3 rd Edition Copyright 2006 © John Wiley & Sons, Inc. All rights reserved.

Designing Programs Resist temptation to write code to quickly System quality is enhanced with topdown, modular design Program design document is the final deliverable for this task 11 Power. Point Presentation for Dennis, Wixom, & Roth Systems Analysis and Design, 3 rd Edition Copyright 2006 © John Wiley & Sons, Inc. All rights reserved.

Using a Top-Down Modular Approach 12 Power. Point Presentation for Dennis, Wixom, & Roth Systems Analysis and Design, 3 rd Edition Copyright 2006 © John Wiley & Sons, Inc. All rights reserved.

STRUCTURE CHART 11 - 13 Power. Point Presentation for Dennis, Wixom, & Roth Systems Analysis and Design, 3 rd Edition Copyright 2006 © John Wiley & Sons, Inc. All rights reserved.

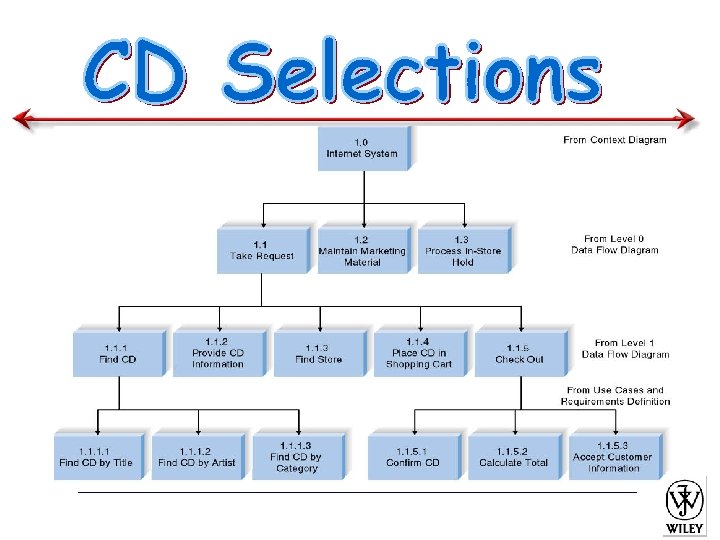
The Structure Chart Important program design technique Shows all components of code in a hierarchical format Sequence Selection Iteration 14 Power. Point Presentation for Dennis, Wixom, & Roth Systems Analysis and Design, 3 rd Edition Copyright 2006 © John Wiley & Sons, Inc. All rights reserved.

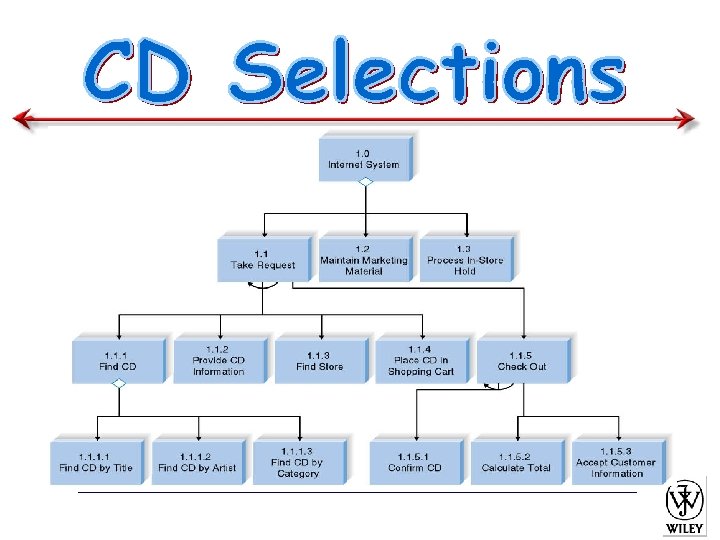
Structure Chart Example 15 Power. Point Presentation for Dennis, Wixom, & Roth Systems Analysis and Design, 3 rd Edition Copyright 2006 © John Wiley & Sons, Inc. All rights reserved.

Structure Chart Elements 16 Power. Point Presentation for Dennis, Wixom, & Roth Systems Analysis and Design, 3 rd Edition Copyright 2006 © John Wiley & Sons, Inc. All rights reserved.

Building the Structure Chart Processes in the DFD tend to represent one module on the structure chart Afferent processes – provide inputs to system Central processes – perform critical system operations Efferent processes – handle system outputs The DFD leveling can correspond to the structure chart hierarchy 17 Power. Point Presentation for Dennis, Wixom, & Roth Systems Analysis and Design, 3 rd Edition Copyright 2006 © John Wiley & Sons, Inc. All rights reserved.

Types of Structure Charts Transaction structure – control module calls subordinate modules, each of which handles a particular transaction Many afferent processes Few efferent processes Higher up levels of structure chart Using inputs to create a new output 18 Power. Point Presentation for Dennis, Wixom, & Roth Systems Analysis and Design, 3 rd Edition Copyright 2006 © John Wiley & Sons, Inc. All rights reserved.

Transaction Structure 19 Power. Point Presentation for Dennis, Wixom, & Roth Systems Analysis and Design, 3 rd Edition Copyright 2006 © John Wiley & Sons, Inc. All rights reserved.

Transform Structure This structure has a control module that calls several subordinate modules in sequence after which something “happens. ” These modules are related because together they form a process that transforms some input into an output. 20 Power. Point Presentation for Dennis, Wixom, & Roth Systems Analysis and Design, 3 rd Edition Copyright 2006 © John Wiley & Sons, Inc. All rights reserved.

Transform versus Transaction Structures 21 Power. Point Presentation for Dennis, Wixom, & Roth Systems Analysis and Design, 3 rd Edition Copyright 2006 © John Wiley & Sons, Inc. All rights reserved.

Steps in Building the Structure Chart 1. Identify top level modules and decompose them into lower levels 2. Add control connections 3. Add couples 4. Review and revise again and again until complete 22 Power. Point Presentation for Dennis, Wixom, & Roth Systems Analysis and Design, 3 rd Edition Copyright 2006 © John Wiley & Sons, Inc. All rights reserved.

25 Power. Point Presentation for Dennis, Wixom, & Roth Systems Analysis and Design, 3 rd Edition Copyright 2006 © John Wiley & Sons, Inc. All rights reserved.

Design Guidelines High quality structure charts result in programs that are modular, reusable and easy to implement. Measures include: Cohesion Coupling Appropriate levels of fan-in and fan-out 26 Power. Point Presentation for Dennis, Wixom, & Roth Systems Analysis and Design, 3 rd Edition Copyright 2006 © John Wiley & Sons, Inc. All rights reserved.
 27 Power. Point Presentation for Dennis,")
Types of Cohesion (GPA = grade point average) 27 Power. Point Presentation for Dennis, Wixom, & Roth Systems Analysis and Design, 3 rd Edition Copyright 2006 © John Wiley & Sons, Inc. All rights reserved.
 28 Power. Point Presentation for Dennis, Wixom,")
Cohesion Decision Tree (Adopted From Page-Jones, 1980) 28 Power. Point Presentation for Dennis, Wixom, & Roth Systems Analysis and Design, 3 rd Edition Copyright 2006 © John Wiley & Sons, Inc. All rights reserved.

Factoring Process of dealing with “low” cohesion Separates tasks into different modules Reduces use of control flags 29 Power. Point Presentation for Dennis, Wixom, & Roth Systems Analysis and Design, 3 rd Edition Copyright 2006 © John Wiley & Sons, Inc. All rights reserved.

Types of Coupling 30 Power. Point Presentation for Dennis, Wixom, & Roth Systems Analysis and Design, 3 rd Edition Copyright 2006 © John Wiley & Sons, Inc. All rights reserved.

Your Turn What, if anything, happens to coupling when you create modules that are more cohesive? What, if anything happens to the cohesiveness of modules when you lower the coupling among them? 31 Power. Point Presentation for Dennis, Wixom, & Roth Systems Analysis and Design, 3 rd Edition Copyright 2006 © John Wiley & Sons, Inc. All rights reserved.

Examples of Fan-in and Fan-out 32 Power. Point Presentation for Dennis, Wixom, & Roth Systems Analysis and Design, 3 rd Edition Copyright 2006 © John Wiley & Sons, Inc. All rights reserved.

Quality Checklist 1. 2. 3. 4. 5. 6. Library modules have been created where ever possible The diagram has a high fan-in structure Control modules have no more than 7 subordinates Each module performs only one function (high cohesion) Modules sparingly share information (loose coupling) Data couples that are passed are actually used by the accepting module 7. Control couples are passed from “low to high” 8. Each module has a reasonable amount of code associated with it 33 Power. Point Presentation for Dennis, Wixom, & Roth Systems Analysis and Design, 3 rd Edition Copyright 2006 © John Wiley & Sons, Inc. All rights reserved.

PROGRAM SPECIFICATION 11 - 34 Power. Point Presentation for Dennis, Wixom, & Roth Systems Analysis and Design, 3 rd Edition Copyright 2006 © John Wiley & Sons, Inc. All rights reserved.

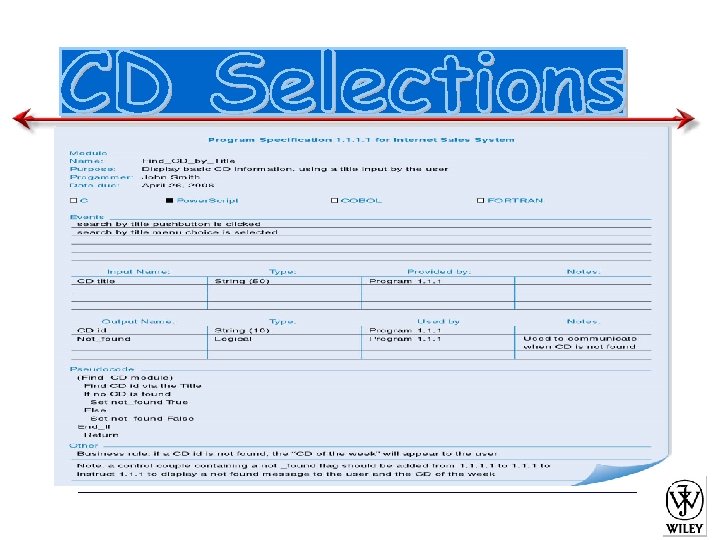
Program Specifications Content No standard approach Include program information Note events that trigger actions List inputs and outputs Include pseudocode Present additional notes and comments 35 Power. Point Presentation for Dennis, Wixom, & Roth Systems Analysis and Design, 3 rd Edition Copyright 2006 © John Wiley & Sons, Inc. All rights reserved.

Program Specification Form 36 Power. Point Presentation for Dennis, Wixom, & Roth Systems Analysis and Design, 3 rd Edition Copyright 2006 © John Wiley & Sons, Inc. All rights reserved.

Pseudocode Example 37 Power. Point Presentation for Dennis, Wixom, & Roth Systems Analysis and Design, 3 rd Edition Copyright 2006 © John Wiley & Sons, Inc. All rights reserved.

Process Description – Analysis and Design 38 Power. Point Presentation for Dennis, Wixom, & Roth Systems Analysis and Design, 3 rd Edition Copyright 2006 © John Wiley & Sons, Inc. All rights reserved.

Summary The structure chart shows all of the functional components needed in the program at a high level. Components of the structure chart show sequence, selection, and iteration Follow design guidelines regarding cohesion, coupling, and fan-in/fan-out. Prepare detailed specifications to programmers including pseudocode to show important programming structures. 40 Power. Point Presentation for Dennis, Wixom, & Roth Systems Analysis and Design, 3 rd Edition Copyright 2006 © John Wiley & Sons, Inc. All rights reserved.

Copyright © 2006 John Wiley & Sons, Inc. All rights reserved. Reproduction or translation of this work beyond that permitted in Section 117 of the 1976 United States Copyright Act without the express written permission of the copyright owner is unlawful. Request for further information should be addressed to the Permissions Department, John Wiley & Sons, Inc. The purchaser may make back-up copies for his/her own use only and not for redistribution or resale. The Publisher assumes no responsibility for errors, omissions, or damages, caused by the use of these programs or from the use of the information contained herein. 41 Power. Point Presentation for Dennis, Wixom, & Roth Systems Analysis and Design, 3 rd Edition Copyright 2006 © John Wiley & Sons, Inc. All rights reserved.
- Slides: 41