Students Please DOWNLOAD this Power Point and then


- Slides: 44

Students: Please DOWNLOAD this Power. Point and then view it in presentation mode to be able to view the animations. For best learning, do not rush through the slides. PHYLOGENY… Photographic images within this Power. Point were obtained from: https: //commons. wikimedia. org/wiki/Category: Images The Evolutionary history of related organisms

Distinguishing Phylogeny vs. Taxonomy – a hierarchical structure of grouping & naming or classifying organisms based on similarities and differences Phylogeny – Depicts the evolutionary relationships of a group of organisms. Phylogenetic trees indicate when/where species diverged from a common ancestor.

Phylogenetic trees show lines of descent The branching patterns that make up a phylogenetic tree are not usually observed directly, rather they are inferred from data Image adapted from: Baum, D. A. and Smith S. D. Tree thinking: an introduction to phylogenetic biology. Roberts, 2013. What does this dead-end branch depict? Try to answer the question before you click again. Make sure you do this each time a question is An extinction asked.

Before we can create phylogenetic trees, we need to ask…

How are organisms classified? Let’s start with a set of species named as follows… �B and C are more closely related to each other than to any other species � A is related to B and C, but not as closely as B and C are related to each other � D, E and F are more closely related to each other than to A, B or C �A �B �C �D �E �F We have evidence that: Let’s start here and learn a simple way to organize the

How are organisms classified? We know: � B and C are closely related BC (B C) Start by grouping the most closely related organisms together. Use parentheses to put them together in a set… …and a comma to show that they share a common ancestor. (B, C)

How are organisms classified? We know: � B and C are closely related � A is related to both B and C, but not as closely as B and C are related to each other A (B, C) (A Now add the next most closely related organism Place this organism next to the first set, add parentheses to group them into a larger set, and a comma to show the common ancestor. (A, (B, C

How are organisms classified? What about the other organisms? �D �E �F � D, E and F are more closely related to each other than to A, B or C. DEF (D E F) If D, E and F are equally related to each other (or you’re not sure!) put them together in a set using parentheses. And separate them with commas to show they share a common ancestry. (D, E, F)

How are organisms classified? Let’s bring this all together. Because the DEF set is more distantly related from the ABC set, we keep the 2 sets separate but put them next to each other. Then we add a final set of parentheses to enclose all of the species as one larger set. Don’t forget the comma, to show the common ancestor between the two sets that make up the larger set. ((A, (B, C)), (D, (A, (B, C)) (D, E, F)

How are organisms classified? One last thing! To show that you have completed the tree, you add a semi colon to the end of the set. ((A, (B, C)), (D, E, F));

How are organisms classified? ((A, (B, C)), (D, E, F)); What you have just made is a phylogenetic tree! Click to see how this can be converted into a phylogenetic tree…

(B, C) Don’t worry about the terms for right now… Present Past

(A, (B, C)) Present Past

(D, E, F) Present Past

((A, (B, C)), (D, E, F)); Present Past

((A, (B, C)), (D, E, F)); Present Past

Some common terminology Nodes indicate common ancestor Branches indicate evolutionary path Descendants (Current taxa) at tips Other terms shown here will be addressed later. Past Present

Now that we’ve seen how trees are put together let’s look at how to interpret them. Past Present

Unless stated otherwise, assume that absolute time is NOT represented A B C D α δ β or after δ? Was α before or after β? Was α before You can’t tell

More terminology A cladogram indicates relatedness only! Sister taxa are most closely related because the MRCA (most recent common ancestor) that they share is more recent than the ones they share with another taxon on this tree Branch length is not always meaningful

Same order – different tree? What’s different? Images via Wikimedia Commons used under Creative Commons Attribution 2. 0 Generic License. These circles show just one difference. There are more. You should identify them. Use the Tree Thinking Article.

Don’t be distracted by morphological similarity Most Recent Common Ancestor (MRCA) Is a lizard more closely related to a frog or a human? Images via Wikimedia Commons used under Creative Commons Attribution 2. 0 Generic License

Assembling a Tree: Practice #2 Let’s practice putting that tree together ourselves, using the set method from earlier in this tutorial Five organisms – How are they related? We know that the human and the mouse are most closely related. So let’s group them together in a set. We’ll do this one with pictures! ( , )

Assembling a Tree: Practice #2 Let’s practice putting that tree together ourselves, using the set method from earlier in this tutorial Five organisms – How are they related? Next, we know that lizards are related most closely to the human/mouse set… ( , ))

Assembling a Tree: Practice #2 Let’s practice putting that tree together ourselves, using the set method from earlier in this tutorial Five organisms – How are they related? And frogs are related most closely to the human/mouse/lizard set… ( , ( , ))))

Assembling a Tree: Practice #2 Let’s practice putting that tree together ourselves, using the set method from earlier in this tutorial Five organisms – How are they related? Finally, we add the fish in. ( , ( , ))))

Assembling a Tree: Practice #2 What’s missing from this tree? ( , ( , ; )))) The semi-colon at the end. This indicates that the tree is complete. If we wanted to write this out using names, so that we could enter it into a phylogeny-making computer program, it would look like this: (Fish, (Frog, (Lizard, (Human, Mouse

Trees can be drawn in various ways yet contain the same phylogenetic information Phylogenetically, these trees are identical. Gregory 2008. Evo Edu Outreach 1: 121 -127

Rotation around the nodes does not change the information in a tree. These three trees are identical 4 3 2 1 Tree 3 Tree 2 If we rotate around the first node… If we rotate around the 1 st, 2 rd 4 th nodes… …we get this

There are no “main lines” in evolution Just because the human has a “straight shot” does not mean it is more related to the common ancestor than the others. The “straight shot” also does not imply that the human (or the shark) is more advanced than the other taxa. Images via Wikimedia Commons used under Creative Commons Attribution 2. 0 Generic License

Clades can be expanded or collapsed If we collapse these two regions… …we get this tree

A tree can depict polytomy If we are unsure which of these is most likely: plant animal fungi animal plant fungi animal Rearranging them to meet at a common point shows uncertainty about how lineages relate to each other. This arrangement is a called a polytomy.

Monophyletic groups (clades) Monophyletic group (clade) A clade is a grouping that includes a common ancestor and all the descendants (living and extinct) of that ancestor Scientists try and make sure that each taxon (a named group of organisms) corresponds to a clade

How can we reconstruct phylogenies? Many methods, some quite sophisticated Simplest is to apply the principle of parsimony: �Occam’s Razor - All other things being equal, the simplest solution is the best. The rest of this activity will focus on parsimony Can be done on Morphological oranalysis with molecular data Molecular data

THE PARSIMONY CRITERION Select the tree that implies the minimum number of character changes summed across all characters of interest

Let’s use molecular data RW A A C G A T T C T A A A G G A T T BW A G C T T C T A A A G G A T T MW A G C T T A A A G G A T T LBW A G C T T A T A G G G T T RW A A C A A BW G C C A A MW G C A A A LBW G C A T G RW = Rock Wren (outgroup) BW = Banded Wren MW = Moustached Wren LBW = Long-Billed Wren First, we align the gene sequences that we want to compare and look for places where they differ

Three possible trees Tree 1 Tree 2 We already know that RW is the outgroup. There are three phylogenies (trees) that we would like to test. Only one of these can be correct. Tree 3 Image via Wikimedia Commons used under Creative Commons Attribution 2. 0 Generic License.

Three possible trees ( , ( , ( , ))); Tree 1 Tree 2 Here we’ve included the parentheses and commas we would have used to develop the top two trees. Tree 3 Image via Wikimedia Commons used under Creative Commons Attribution 2. 0 Generic License.

Map the characters onto tree 1 These sequences from four different wren species are aligned. Each column (1, 2, 3…) can be considered a character trait. We will therefore analyze each sequence position (“character”) separately. 1 2 3 4 5 RW A BW G MW G LBW G A C A A C C A A T A A G RW LBW MW BW 4 3 5 1 2 3 The number mapped above on the tree depicts the “character” change to the left. For 1, the rock wren “character” changed from a G (guanine) to an A (adenine). For 2, the rock wren “character” changed from a C (cytosine) to an A (adenine). Let’s map the remaining character changes Total cost (length) = 6 steps

Actually there is more than one way to map character 3 1 2 3 4 5 RW A BW G MW G LBW G A C A A C C A A T A A G RW LBW MW 3 BW 3 3 3 Either way the character contributes 2 steps to the overall cost i. e. – you can map this character change in two different ways, each for the same cost (two separate changes needed).

Map the characters onto tree 2 1 2 3 4 5 RW A BW G MW G LBW G A C A A C C A A T A A G Length = 6 steps RW MW BW LBW 3 45 3 1 2

Map the characters onto tree 3 1 2 3 4 5 RW A BW G MW G LBW G A C A A C C A A T A A G Length = 5 RW BW MW LBW 45 1 3 2

What was the cost of each tree? Tree 1: length = 6 Tree 2: length = 6 Tree 3 has the lowest cost, is therefore the most parsimonious tree and the one that we believe to be the most likely tree based on Occam’s Razor. Tree 3: length = 5

This is just the beginning. .
 Nobody said anything raymond carver
 The teacher said to the students, “please be silent.”
 Active power reactive power apparent power
 Power bi training powerpoint
 Point point power
 What image did rizal carved on a piece of batikuling
 What is sweetened then soured boiled then cooled
 Take a point o on your notebook
 Hub and spoke disadvantages
 Solar power satellites and microwave power transmission
 Actual power and potential power
 Dispersive power of grating equation
 Webench amplifier designer
 Webench power designer download
 Power xpert 900
 Ponovo power test software download
 Motor management relay
 Prayer points for power and authority
 Disadvantages of apple keynote
 Point-by-point comparison
 Dew and bubble point
 Points of parity and points of difference
 Horizontal line
 Incongruent melting point
 Indicator end point
 Tact extensions aba
 Far point near point
 Far point and near point
 Astm d6045
 Boiling and melting points
 Flex power power supply
 Power of a power property
 General power rule
 Power angle curve in power system stability
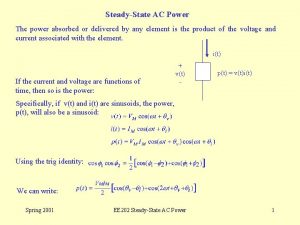
 Power absorbed or delivered
 Evangelio del domingo en power point
 Como hacer una ova
 La boutique del power point rincones del mundo
 Power point tennis
 Power point turing complete
 Power point sul riciclo in inglese
 Blok dienes
 Slideshow sabbath school
 Barni
Barni La boutique del power point


