Statistical Tests Karen H Hagglund M S Karen


 l Simplest scale of measurement l Variables which have no numerical")


 l Quantitative data with true zero – Can add, subtract, multiply")


")

 – Square root of the")


")


 or F-test l Three or more independent groups l Test")


- Slides: 48
Statistical Tests Karen H. Hagglund, M. S. Karen. Hagglund@stjohn. org
Research: How Do I Begin? ? ?
Take It “Bird by Bird” Anne Lamott
Let’s Take it Step by Step. . . l l l l l Identify topic Literature review Variables of interest Research hypothesis Design study Power analysis Write proposal Design data tools Committees l l l l Collect data Set up spreadsheet Enter data Statistical analysis Graphs Slides / poster Write paper / manuscript
Confused by Statistics ?
Goals l To understand why a particular statistical test was used for your research project l To interpret your results l To understand, evaluate, and present your results
Free Statistics Software Mystat: http: //www. systat. com/Mystat. Products. aspx List of Free Statistics Software: http: //statpages. org/javasta 2. html
Before choosing a statistical test… l Figure out the variable type – Scales of measurement (qualitative or quantitative) l Figure out your goal – Compare groups – Measure relationship or association of variables
Scales of Measurement l Nominal l Ordinal l Interval l Ratio } } Qualitative Quantitative
Nominal Scale (discrete) l Simplest scale of measurement l Variables which have no numerical value l Variables which have categories l Count number in each category, calculate percentage l Examples: – – – Gender Race Marital status Whether or not tumor recurred Alive or dead
Ordinal Scale l Variables are in categories, but with an underlying order to their values l Rank-order categories from highest to lowest l Intervals may not be equal l Count number in each category, calculate percentage l Examples: – – Cancer stages Apgar scores Pain ratings Likert scale
Interval Scale l Quantitative data l Can add & subtract values l Cannot multiply & divide values – No true zero point l Example: – Temperature on a Celsius scale • 00 indicates point when water will freeze, not an absence of warmth
Ratio Scale (continuous) l Quantitative data with true zero – Can add, subtract, multiply & divide l Examples: – – – Age Body weight Blood pressure Length of hospital stay Operating room time
Scales of Measurement l Nominal l Ordinal l Interval l Ratio } } Lead to nonparametric statistics Lead to parametric statistics
Two Branches of Statistics l Descriptive – Frequencies & percents – Measures of the middle – Measures of variation l Inferential – Nonparametric statistics – Parametric statistics
Descriptive Statistics l First step in analyzing data l Goal is to communicate results, without generalizing beyond sample to a larger group
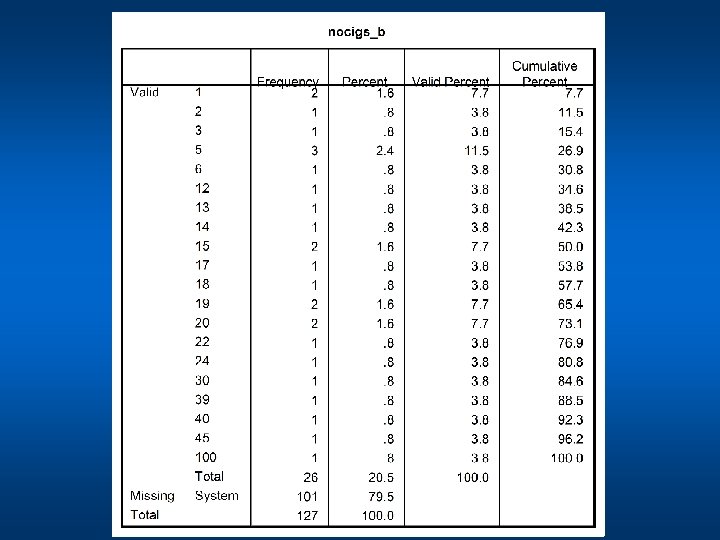
Frequencies and Percents Number of times a specific value of an observation occurs (counts) l For each category, calculate percent of sample l
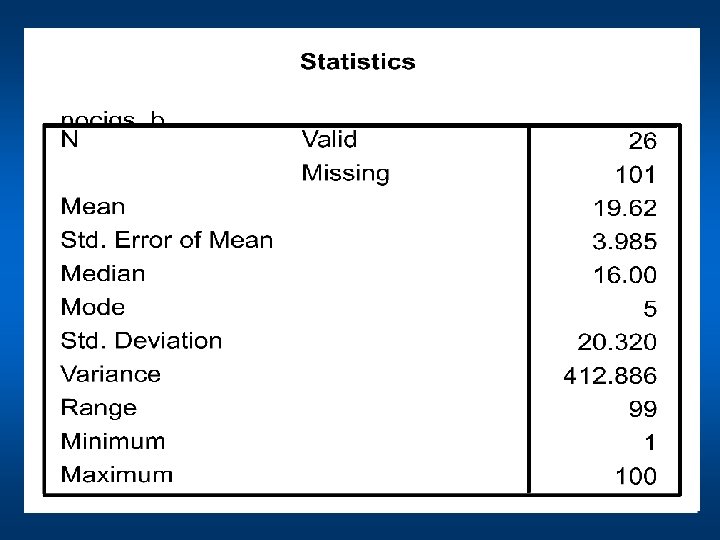
Measures of the Middle or Central Tendency l Mean – Average score • sum of all values, divided by number of values – Most common measure, but easily influenced by outliers l Median – 50 th percentile score • half above, half below – Use when data are asymmetrical or skewed
Measures of Variation or Dispersion l Standard deviation (SD) – Square root of the sum of squared deviations of the values from the mean divided by the number of values SD = sum of (individual value – mean value) 2 ________________________ number of values l Standard error (SE) – Standard deviation divided by the square root of the number of values
Measures of Variation or Dispersion l Variance – Square of the standard deviation l Range – Difference between the largest & smallest value
Inferential Statistics Sample l Population Nonparametric tests – Used for analyzing nominal & ordinal variables – Makes no assumptions about data l Parametric tests – Used for analyzing interval & ratio variables – Makes assumptions about data • Normal distribution • Homogeneity of variance • Independent observations
Which Test Do I Use? l Step 1 Know the scale of measurement l Step 2 Know your goal – Is it to compare groups? How many groups do I have? – Is it to measure a relationship or association between variables?
Key Inferential Statistics l Chi-Square – Fisher’s exact test l T-test – Unpaired – Paired } } Nonparametric Association/Relationship Parametric Compare groups l Analysis of Variance (ANOVA) l Pearson’s Correlation l Linear Regression } } Parametric Compare groups Parametric Association/Relationship
Probability and p Values l p < 0. 05 – 1 in 20 or 5% chance groups are not different when we say groups are significantly different l p < 0. 01 – 1 in 100 or 1% chance of error l p < 0. 001 – 1 in 1000 or. 1% chance of error
Research Hypothesis l Topic research question l Research question – Null hypothesis (H 0) • – hypothesis Predicts no effect or difference Alternative hypothesis (H 1) • Predicts an effect or difference
Example
Topic: Cancer & Smoking Research Question: Is there a relationship between smoking & cancer? H 0: Smokers are not more likely to develop cancer compared to nonsmokers. H 1: Smokers are more likely to develop cancer than are non-smokers.
Are These Categorical Variables Associated?
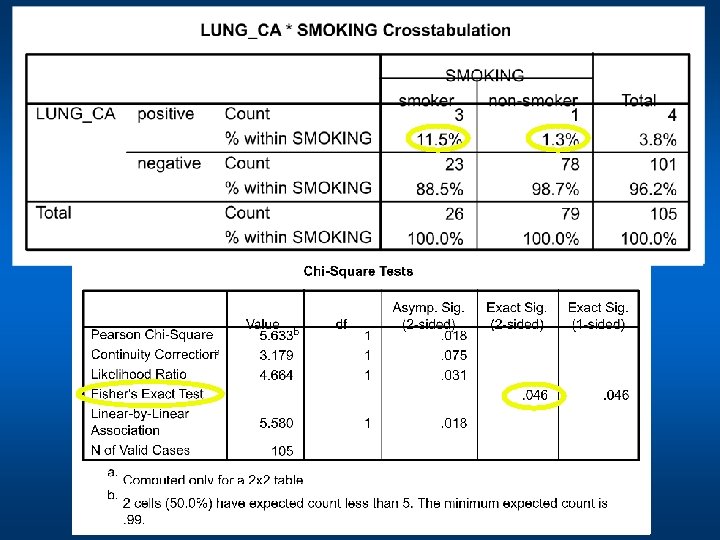
2 Chi-Square l Most common nonparametric test l Use to test for association between categorical variables l Use to test the difference between observed & expected proportions – The larger the chi-square value, the more the numbers in the table differ from those we would expect if there were no association l Limitation – Expected values must be equal to or larger than 5
Let’s Test For Association Low SES 38. 9%, Middle SES 20. 3%, High SES 26. 1%
Alternative to Chi-Square l Fisher’s exact test – Is based on exact probabilities – Use when expected count <5 cases in each cell and – Use with 2 x 2 contingency table R A Fisher 1890 -1962
Do These Groups Differ?
Unpaired t-test or Student’s t-test William Gossett 1876 -1937 l Frequently used statistical test l Use when there are two independent groups
Unpaired t-test or Student’s t -test l Test for a difference between groups – Is the difference in sample means due to their natural variability or to a real difference between the groups in the population? l Outcome (dependent variable) is interval or ratio l Assumptions of normality, homogeneity of variance & independence of observations
Let’s Test For A Difference Smokers’ BMI = 25. 18 ± 5. 27 Non-Smokers’ BMI = 26. 22 ± 5. 48
Do These Groups Differ? Light smoker < 1 pack/day Heavy smoker > 1 pack/day
Analysis of Variance (ANOVA) or F-test l Three or more independent groups l Test for a difference between groups – Is the difference in sample means due to their natural variability or to a real difference between the groups in the population? l Outcome (dependent variable) is interval or ratio l Assumptions of normality, homogeneity of variance & independence of observations
Let’s Test For A Difference Non-Smokers’ BMI = 26. 22 ± 5. 48 Light Smokers’ BMI = 26. 18 ± 4. 96 Heavy Smokers’ BMI = 23. 31 ± 5. 62
Is there a relationship between the variables?
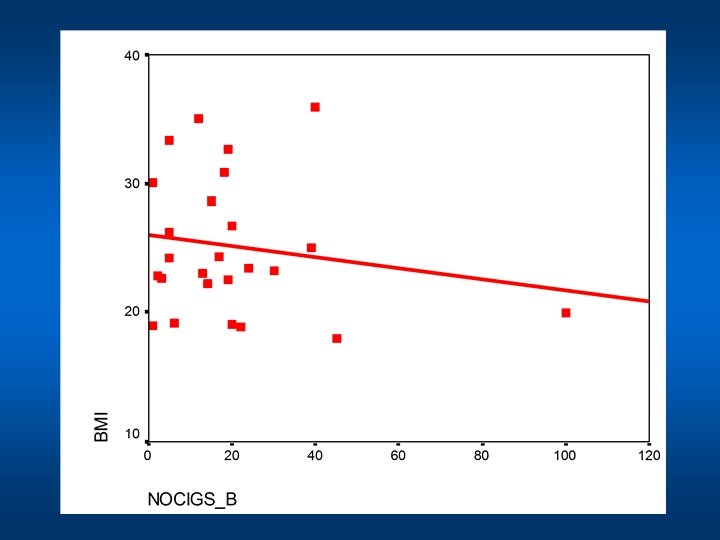
Pearson’s Correlation Karl Pearson 1857 -1936 l Measures the degree of relationship between two variables l Assumptions: – Variables are normally distributed – Relationship is linear – Both variables are measured on the interval or ratio scale – Variables are measured on the same subjects
Scatterplots Perfect positive correlation r = -1. 0 ---- +1. 0 Perfect negative correlation No correlation
Let’s Test For A Relationship
Interpretation of Results l The size of the p value does not indicate the importance of the result l Appropriate interpretation of statistical test – Group differences – Association or relationship – “Correlation does not imply causation”
Don’t Lie With Statistics !