SOCIO ECONOMIC SCALES Dr MANJU T L INTRODUCTION


")

 • It is a measure of change in retail price")


 • BG Prasad scale- introduced in 1961")


 Educational component • Professional or honours • Graduate or post graduate • Intermediate")
 Occupational component • Professional • Semi-professional • Clerical, shop owner, farmer • Skilled")
 Family income per month (Rs. ) • The income is updated on the")


 SCALE • The Go. I in the National Family Health")


 of Socioeconomic Status")


 depend")


- Slides: 49
SOCIO ECONOMIC SCALES -Dr. MANJU. T. L
INTRODUCTION • Our society has always been classified into classes/strata based on various criteria • Indian society is rigidly based on caste system • Caste groups are hierarchical • Social class – closely bound up with economic status, level of education, way of life, attitudes & expectations and exposure to stress. (1)
Social stratification • A kind of social differentiation; whereby a society groups people into socioeconomic strata Social mobility • Movement of individuals, social groups or categories of people between the layers/strata in a stratification system. • Based on this, there are open & closed stratification systems
TYPES OF SOCIAL STRATIFICATION
HISTORY PLATO • Concept of social class • 3 classes – philosophers, warriors, producers • Similar to Plato ARISTOTLE • However, more on importance of middle class • Main feature of differentiation is income OTHERS • Land owners, owners of capital, workers. (2)
VIEWS IN SOCIAL STRATIFICATION Functionalist view Conflict view Social inequality is necessary; it plays a vital role in smooth operation of society Social stratification benefit some at the expense of others Davis – Moore theory Karl Marx & Max Weber theory
DAVIS & MOORE THEORY • Social positions have varying degrees of functional importance • “A position does not bring power or prestige because it draws a high income. Rather, it draws a high income because it is functionally important & the available personnel, is for one reason or another, scarce. ” • Criticism of this theory: • It did not make much sense in non-competitive societies, eg: feudalism, where all positions are distributed by birth (not by merit). (3)
MARX & WEBER THEORIES • Fundamental • Karl Marx – social class has 2 class systems • Max Weber – 3 dimensions of stratification – class, status & party • Class – The possession of material resources by a person, based on birth and individual achievements • Status – A person’s prestige, social honour or popularity in a society • Party – Determined by the acquisition of social power. “Power” is a person’s ability to get their way despite the resistance of others, particularly in their ability to engage in social change. (4)
WEBERIAN THEORY • Weber further divided “class” into 4 categories: • Propertied upper class • Property less intelligentsia • Petty bourgeoisie • Manual working class • Thus, Weber brought out a theory of the existence of middle class
CONTINUED… • Weber described social stratification in societies as a multidimensional distribution of people by ranks, rather than a simple hierarchy of specific classes. • Liberatos et al (1988) state, that in accordance with Weber’s ideas, sociologists use the term “socio economic status” to designate a complex classification based on various dimensions of social inequality. (4)
SES – WHY IT MATTERS? • To understand the distribution of population based on SES • Resources are scarce – identify the most needy • SES has been observed to influence the health status of the community • To develop a uniform system of socioeconomic classification of the population universally, in a scientific manner. (5)
SES AND HEALTH • Related to health & life outcomes for as long as social groups existed: • Lower SES – more negative life events/stressors than high SES • Lower SES – less likely to engage in healthy behaviours – exercising, healthy diet, not smoking • The access to & quality of healthcare vary across the different SES. (5)
SOCIOECONOMIC STATUS • Position that an individual or family occupies with reference to the prevailing average standards of cultural and material possessions, income, and participation in group activity of the community • SES can be measured by the following methods: Ø Rahudkar scale (1960) Ø B. G. Prasad method (1961) Ø Udai Pareek method (1964) Ø Jalota scale (1970) Ø Kulshrestha scale (1972) Ø Kuppuswamy scale (1976) Ø Srivastava scale (1978) Ø Bharadwaj scale (2001). (6)
Rural- Urban Differentiation • The "rural sector" means any place as per the 2011 census which meets the following criteria, üA population of less than 5, 000 üDensity of population less than 400 per sq. km and ümore than "25 per cent of the male main working population" is engaged in agricultural pursuits. (7) • Urban area: üAll places with a municipality, corporation, cantonment board or notified town area committee, etc. üAll other places which satisfied the following criteria: q. A minimum population of 5, 000; q. At least 75 per cent of the male main working population engaged in non-agricultural pursuits; and q. A density of population of at least 400 persons per sq. km. (8)
RURAL RAHUDKAR SCALE UDAI-PAREEK SCALE SHIRPURKAR SCALE URBAN KUPPUSWAMY SCALE SRIVASTAVA SCALE JALOTA SCALE KULSHRESHTA SCALE ü MODIFIED B. G. PRASAD SCALE- both urban & rural population ü BHARADWAJ SCALE- for student population
B. G. PRASAD’S CLASSIFICATION • First introduced in 1961 • Revised in 1968 & 1970 • After Kuppuswamy SES scale, this is the most widely used scale for classifying people according to socioeconomic status. • Applicable to both urban and rural population. • Based on per capita monthly income. (9) Per capita monthly income= Total monthly income of family Total no: of members in family
Table 1: Revision of B. G. Prasad’s SES classification SOCIAL CLASS I (upper class) ORIGINAL CLASSIFICATION OF PER CAPITA INCOME ≥ 100 REVISED CLASSIFICATION FOR 2016 ≥ 6346 II (upper middle) III (middle) IV (lower middle) V (lower class) 50 -99 30 -49 15 -29 ˂15 3173 -6345 1904 -3172 952 -1903 ≤ 951
WHAT IS THE NEED TO UPDATE SES SCALES? • Income ranges in the scale lose their relevance following the depreciation in the value of the rupee. • Steady inflation, lower interest rates and country’s current account deficits are the main factors contributing to the fall in the value of currency. (10)
Consumer Price Index (CPI) • It is a measure of change in retail price of basket of commonly used goods & services, consumed by a defined population group, in a given area, with reference to a base year. (10) • Gives an idea of the cost of living. • The percentage change in this index over a period of time gives the amount of inflation over that specific period, i. e, the increase in prices of a representative basket of goods consumed. (11)
• Comprises of multiple series, classified based on different economic groups – 4 series: • Industrial workers (IW) • Agricultural labourers (AL) Dept. of Labour • Rural labourers (RL) • Urban non manual employees (UNME) - Central Statistical Organization • UNME- replaced as CPI (urban), CPI (rural) & CPI (combined) • The RBI has started using CPI- combined as the sole inflation measure for the purpose of monetary policy. (11)
HOW TO CALCULATE CPI?
Step 1 • Select a base year for the CPI – always set at 100 Step 2 • Select a “basket of goods” and add the prices of all these goods in your base year. For instance, choose 2001 as your base year. Step 3 • Select the year for which you want to calculate the CPI and add the prices of all the goods in your basket of goods for that year. For instance, to calculate CPI in 2005. Step 4 • [Price of basket of goods in 2005/ price of basket of goods in 2001]*100. For instance, if your basket of goods cost Rs. 500 in 2001 and Rs. 550 in 2005 : [550/ 500]*100. By calculation, CPI in 2005 is 110. This means prices increased 10% from 2001 to 2005.
Revision of B. G. Prasad scale (12) • BG Prasad scale- introduced in 1961 considering base year as 1960(CPI-100) • Scale modified in 1982 and 2001 by introducing linking factors to convert CPI (1982 and 2001) from the new base of 100 to the old base CPI (1960). • The linking factors for 1982 and 2001 were 4. 93 and 4. 63, respectively. (LB) • CPI − Industrial Workers (IW) for September 2016 = 277 • Multiplication factor = Current index value (277)/ Base index value in 2001 (100) = 2. 77 • New income = multiplication factor × old income value × 4. 63 × 4. 93
Criticism of B G Prasad scale • Socioeconomic scale or just an economic scale? Is income the sole determinant of the socioeconomic status of a person? • It's too simplistic- one size fits all approach- its validity? • No differentiation with respect to income and wealth. • While the scale uses CPI (IW), it claims its applicability for both urban and rural areas, completely ignoring the CPI for rural labourers and agricultural labourers. • Income may vary from month to month. (13)
KUPPUSWAMY SCALE • Proposed by Kuppuswamy in India, in 1976 • Most widely used scale. • He prepared a scale based on three variables which contributes to the socio-economic status. These are: • 1) Education of head of the family • 2) Occupation of head of the family • 3) Total family income • Used for urban communities • Each component is given a weighted score and then total is summed up and the individual/ family can be classified. (9)
A) Educational component • Professional or honours • Graduate or post graduate • Intermediate or post- high school diploma • High school certificate • Middle school certificate • Primary school certificate • Illiterate 7 6 5 4 3 2 1
B) Occupational component • Professional • Semi-professional • Clerical, shop owner, farmer • Skilled worker • Semi-skilled worker • Unemployed 10 6 5 4 3 2 1
C) Family income per month (Rs. ) • The income is updated on the basis of Consumer Price Index. • ≥ Rs. 42, 876 • 21, 438 -42, 875 • 16, 078 -21, 437 • 10, 719 -16, 077 • 6, 431 -10, 718 • 2, 165 -6, 430 • ≤ 2, 164 12 10 6 4 3 2 1 • Current income groups = original family income groups of Kuppuswamy (1976) X current CPI X 0. 0735 (multiplication factor)
CLASS TOTAL SCORE UPPER CLASS 26 -29 UPPER MIDDLE CLASS 16 -25 LOWER MIDDLE CLASS 11 -15 UPPER LOWER CLASS 5 -10 LOWER CLASS ˂5
Criticism of Kuppuswamy scale • Total income of the family- independent of family size. • Inter-assessor variation in identifying the head of the family. • No clear definition and classification of various occupations. • While the income ranges are updated regularly, no update has been done of evaluation of various educational and occupational levels. (13)
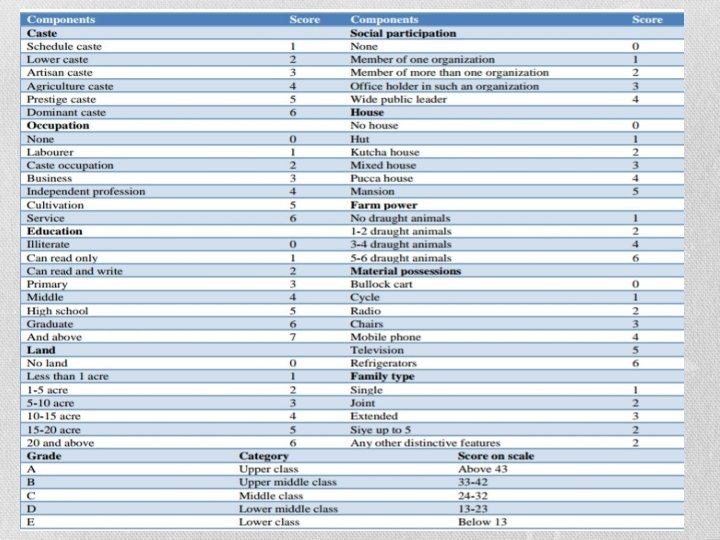
UDAI PAREEK SCALE • Attempts to examine the socio-economic status for rural population. • This scale has nine factors which assess the socio-economic status of the individual. • After filling the information, and scoring the individual items, the total score is summed up and interpreted in terms of the class. • Score ranges from a maximum value of 49 to minimum value of 3. (13)
• The 9 factors included in Udai Pareek scale: • Caste • Occupation • Education • Land • Social participation • House • Farm power • Material possessions • Family type
Agarwal scale • Comprehensive; wide utility across urban and rural areas. • takes into consideration both direct and indirect measures for assessment of the financial status of the family. • 22 -item long • caste, material possessions (vehicle, TV, fridge, AC, washing machine, mobile phone, house, tap water, domestic servant, land, milch cattle etc), visits abroad, monthly per capita income, income tax paid, highest education in the family and occupation. • However, the length of the Agarwal questionnaire makes it a time and labour-intensive exercise. • Several items are not relevant to urban areas • calculation of pooled income of the family is difficult as it is unclear whether to include income of the individual who is earning but not contributing to the family purse • occupation scoring-difficult as many categories are not mentioned
STANDARD OF LIVING INDEX(SLI) SCALE • The Go. I in the National Family Health Survey (NFHS - II) had used the Standard of Living Index (SLI) scale. • It contains 11 items viz. vhouse type vsource of lighting vtoilet facility vmain fuel for cooking vsource of drinking water vseparate room for cooking vownership of the house vownership of agricultural land vownership of irrigated land vownership of livestock vownership of durable goods. (14)
• On the basis of total score, households are divided into 3 categories as: • Low- total score ≤ 9 • Medium- total score is >9, but ≤ 19 • High- score >19 • Can be applied in both urban & rural areas of the entire country.
Advantages of SLI • Can be applied in both rural and urban settings. • It is based on a scoring system which can be modified depending on the requirements. Thus families classified under SLI are more in touch with reality. • An exploratory study on socio economic status scales in a rural and urban setting, was conducted in Bangalore, in 2010, to compare the most commonly used SES in rural and urban setting. • In the rural areas, the SLI was compared with Pareek's scale and Prasad scale. In the urban areas, the SLI was compared with modified Kuppuswamy scale and B G Prasad scale. • SLI stands out as a unique reliable measure of SES at rural setting by taking into consideration the wealth possession. (14)
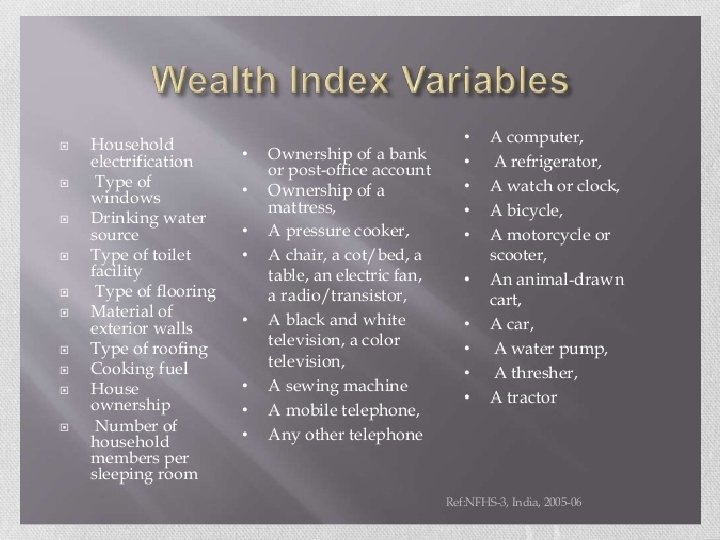
WEALTH INDEX • A composite measure of a household’s cumulative living standard. • Used in Demographic & Health Surveys (DHS) • The wealth index places individual households on a continuous scale of relative wealth. • Information on the wealth index is based on data collected in the Household Questionnaire. • Each household asset for which information is collected is assigned a weight or factor score generated through principal components analysis. • These scores are summed by household, and individuals are ranked according to the total score of the household in which they reside. The sample is then divided into population quintiles -- five groups with the same number of individuals in each. (15)
• The NFHS-3 had used the wealth index for determining the living standards of the population. • The NFHS-4 was conducted among more than 6 lakh households in 2015 -16 • The wealth index as part of NFHS-4 was prepared on basis of information of scores on ownership of consumer goods such as television and bicycles and others, and household characteristics such as availability of clean drinking water • This information was used to classify all households into wealth quintiles. Those in lowest quintile were poorest 20%, while those in top were richest 20% of lot. The report then used these quintile scores to classify population for states, caste and religious groups and rural-urban areas into each quintile. (15)
Hollingshead Four Factor Index • The Hollingshead Four Factor Index (1975) of Socioeconomic Status is a survey designed to measure social status of an individual based on four domains: • marital status • retired/employed status • educational attainment • occupational prestige • Obtained separately for adult & child. • Child- 6 -17 years & Adult- 18 -85 years. (16)
• Education code is rated on a 7 -point scale: 7=graduate/professional training 6= standard college or university graduation 5=partial college, at least one year of specialized training 4= high school graduate 3=partial high school, 10 th or 11 th grade 2= junior high school, including 9 th grade 1= less than 7 th grade 0=not applicable or unknown.
• Occupational code rated on a 9 -point scale: 9=higher executive, proprietor of large business, major professional 8=administrators, lesser professionals, proprietor of medium-sized business 7=smaller business owners, farm owners, managers, minor professionals 6=technicians, semi-professionals, small business owners 5=clerical and sales workers, small farm and business owners 4=smaller business owners, skilled manual labourers, craftsmen, tenant farmers 3=machine operators and semi-skilled workers 2=unskilled workers 1=farm labourers, menial service workers, students, housewives, (dependent on welfare, no regular occupation) 0=not applicable or unknown.
CRITICAL APPRAISAL • Investigators wanting to examine the relationship between socio-economic position and health need to decide which health measure to use. If one wishes to demonstrate strong associations between SES and health, it would be better to use limiting long-standing illness, income and household rather than individual measures of social position, and older measures of occupational social class. • Individual income is a different measure that should be chosen if the individual position in terms of status or material success is to be measured. • In present scenario other SES indicators like physical assets, savings, debts etc must also be taken into consideration while assessing SES.
• The strengths and limitations of any measure of socioeconomic position (SEP) depend on the context and purpose for which it is being used. • There are still important socio-economic gradients in the use of some health services. Further research needs to focus on socio-economic differences in the reasons, the outcome and the quality of the provided care. • We could recommend an outcome- and social group–specific approach to SES measurement that involves (1) considering plausible explanatory pathways and mechanisms, (2) measuring as much relevant socioeconomic information as possible, (3) specifying the particular socioeconomic factors measured (rather than SES overall), and (4) systematically considering how potentially important unmeasured socioeconomic factors may affect conclusions.
REFERENCES • 1. Park. K , Park’s Textbook of Preventive and Social Medicine. , 24 th edition, Medicine and Social Sciences Chap, Page no. 725 -726. • 2. Azarkievi JS. SOCIAL STRATIFICATION ACCORDING TO MARX AND WEBER COMPARISON OF THEORIES AND MODERN RELEVANCE [Internet]. 2015. 1 -2 p. Available from: https: //www. academia. edu/19721451/Social_Stratification_According_to_ Marx_and_Weber_Comparison_of_the_Theories_and_Modern_Relevance • 3. Kerbo HR. Modern Theories of Social Stratification [Internet]. Social Stratification and Inequality: Class Conflict in Historical, Comparative, and Global Perspective. 114 -119 p. Available from: http: //homepage. ntu. edu. tw/~khsu/mobile/ch 5 c. pdf • 4. Karl Marx and Max Weber have different views upon social class in contemporary societies [Internet]. Available from: http: //www. markedbyteachers. com/gcse/sociology/karl-marx-and-maxweber-have-different-views-upon-social-class-in-contemporarysocieties. html • 5. Oakes J. Measuring Socioeconomic Status 1. [Internet]. e-Source: Behavioral and Social Science Research. 2008. p. 1– 31. Available from: http: //www. esourceresearch. org/Portals/0/Uploads/Documents/Public/Oa kes_Full. Chapter. pdf
• 6. Swamy N, Lecturer S. OVERVIEW OF SOCIO ECONOMIC. Int J Innov Res Dent Sci. 2016; 1(2): 1– 7. • 7. National Portal Content Management Team. Rural Indian: National Portal of India [Internet]. 2012. Available from: http: //www. archive. india. gov. in/citizen/graminbharat. php • 8. Urban - Arthapedia [Internet]. Available from: http: //www. arthapedia. in/index. php? title=Urban • 9. Shaikh Z, Pathak R. Revised Kuppuswamy and B G Prasad socio-economic scales for 2016. Int J Community Med Public Heal [Internet]. 2017; 4(4): 997. Available from: http: //www. ijcmph. com/index. php/ijcmph/article/view/1242 • 10. Definition of Consumer Price Index | What is Consumer Price Index Meaning - The Economic Times [Internet]. 2018. Available from: https: //economictimes. indiatimes. com/definition/consumer-priceindex • 11. Consumer Price Index [Internet]. Vol. September, Statistical release. 2011. p. 1– 13. Available from: http: //www. arthapedia. in/index. php? title=Consumer_Price_Index
• 12. Khairnar MR, Wadgave U, Shimpi P V. Updated BG Prasad socioeconomic classification for 2016. J indian Assoc public Heal Dent [Internet]. 2016; 14(4): 469– 70. Available from: http: //www. jiaphd. org/article. asp? issn=23195932; year=2016; volume=14; issue=4; spage=469; epage=470; aulast=Khairnar • 13. Singh T, Sharma S, Nagesh S. Socio-economic status scales updated for 2017; 5(7): 3264– 7. Available from: http: //msjonline. org/index. php/ijrms/article/view. File/3310/3113 • 14. Kulkarni P, Ramesh Masthi N, Gangaboraiah. An exploratory study on socio economic status scales in a rural and urban setting [Internet]. Vol. 2, Journal of Family Medicine and Primary Care. 2013. p. 69– 73. Available from: https: //www. ncbi. nlm. nih. gov/pmc/articles/PMC 3893998/ • 15. The DHS Programe, USAID. The DHS Program - Research Topics - Wealth Index [Internet]. Available from: www. dhsprogram. com/topics/wealth-index/Index. cfm • 16. Hollingshead Four-Factor Index of Socioeconomic Status (SESChild) — Nathan Kline Institute - Rockland Sample documentation [Internet]. 2016. Available from: http: //fcon_1000. projects. nitrc. org/indi/enhanced/assessments/seschild. html
Thank you