EXPERIMENTS DATA ANALYSIS MEASUREMENT SCALES NOMINAL SCALES Use


- Slides: 24
EXPERIMENTS: DATA ANALYSIS
MEASUREMENT SCALES
NOMINAL SCALES Use of numbers to name or categorize § Ex: § driver’s license § Student Number
ORDINAL SCALES Numbers represent serial position § Ex: § Class Rank § age
INTERVAL SCALES Equally spaced measurement units § Ex: § Fahrenheit temperature § Personality Scales
RATIO SCALES Interval scale with true zero § Ex: § Pounds § Kelvin scale
FREQUENCY DISTRIBUTION
FREQUENCY DISTRIBUTION Organization of data by the number of times a score occurs per data point
FREQUENCY DISTRIBUTION Pie Graph Histogram
FREQUENCY DISTRIBUTION Polygon-frequency data with line drawn from point to plotted point Line graph-indicates changes that occur between variables
STATISTICAL ANALYSIS OF RESULTS
DESCRIPTIVE STATISTICS Organization of data for communication/understanding Central tendency: § composite numbers describing the distribution of scores
CENTRAL TENDENCY Mean § Arithmetic average of a set of scores Median § Score falling midpoint among all the scores ordinally ranked Mode § Most frequently occurring score or data point
LET’S CONSIDER THE DATA…. Miss Dryer gives a practice test, and the scores were as follows… What is our…. § Mean? § 7 § Median? § 7 § Mode? 9, 8, 9, 7, 4, 10, 7, 6, 8, 7, 7, 2, 8, 3 § 7
MEASURES OF VARIABILITY Tells us how much variation, or “spread” there is in the group of scores Range: § Difference between the lowest and highest scores Standard Deviation: § Measures the average difference between each score and the mean of the data set.
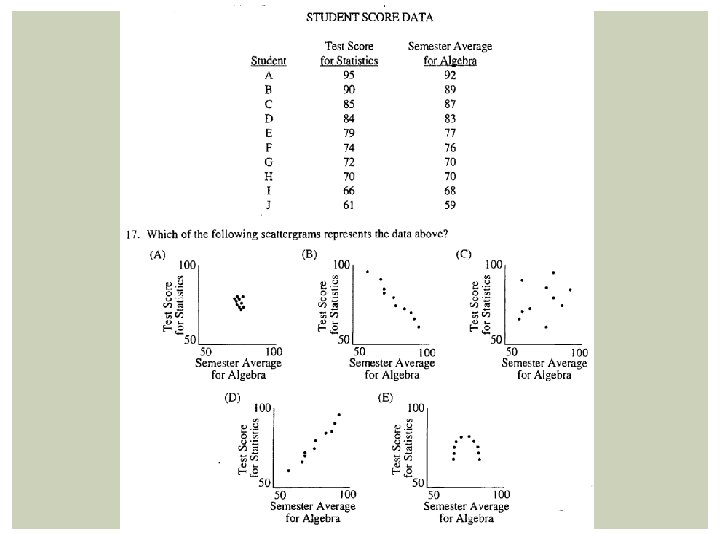
CORRELATIONAL COEFFICIENTS Describes the direction and strength of the relationship between two variables § The sign (+ or -) describes direction § The numerical value (r) can vary from -1. 00 to +1. 00. The larger the (r), the stronger the relationship
CORRELATIONS Positive Correlation § Two variables change in the same direction (as X increases, so does Y) and vice versa Negative Correlation § Two variables change in opposite directions (as X increases, Y decreases) and vice versa
THE NORMAL DISTRIBUTION When most of the scores fall in the middle of a distribution § With few extreme scores § Mean, median, and mode all have the same value
SKEWED DISTRIBUTION
INFERENTIAL STATISTICS Used to reach conclusions beyond immediate test data The t test § Examines difference between Means § Did difference occur… § Due to chance? § Due to IV? Teachers may use to compare class data
STATISTICALLY SIGNIFICANT Possibility that the differences in results between the experimental and control groups could have occurred by chance is no more than 5 percent Must be at least 95% certain the differences between the groups is due to the independent variable
INFERENTIAL STATISTICS Statistically significant: § High probability that research results are not due to chance § Typically 5%, or. 05
PRACTICE MULTIPLE CHOICE Which of the following sets of scores has the greatest standard deviation? § 5, 7, 9, 12 § 2, 7, 9, 22 § 25, 27, 29, 32 § 50, 51, 52, 53 § 100, 101, 102, 103