Nominal Ordinal median Mode Non parame t ric


 = (Number of Rows – 1)")


- Slides: 15
Nominal Ordinal median Mode Non parame t ric Ordinal data is ranked data Nominal data is the lowest form of measurement. it is frequency data. Counting things that are not necessarily the same. And also when we use numbers as labels the next level up but Still not very powerful. The gaps between the numbers are not identical Interval param Ratio etric mean Interval data is precise data The gaps between the numbers Are identical. We call this robust And it means we can do more complex Calculations with this type of data. But the zero is not true. mean Ratio data is the most powerful Or robust data we have. it is exactly the same as interval data But the zero is true
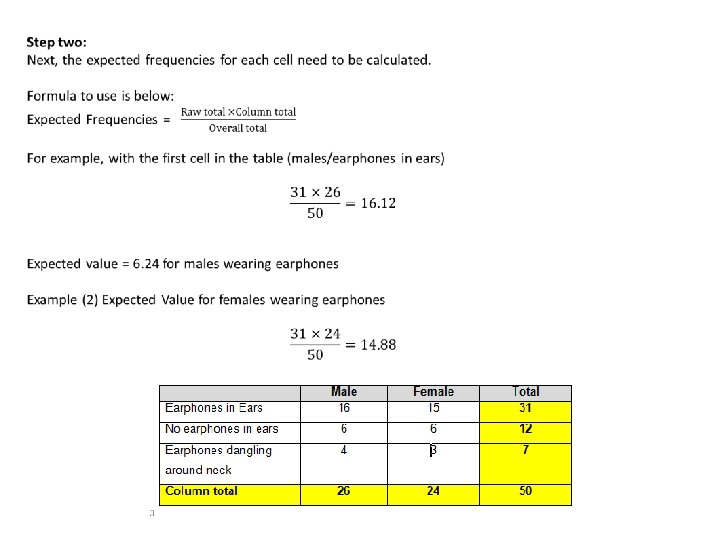
On a recent trip to London, a research psychologist could not help but notice the number of people walking in streets with earphones. Surprised by this one afternoon, the research psychologist decided to conduct an observation. She observed the number of people with earphones in their ears and to see if there was a difference in the frequency between male and females. Below are is the frequency table of people wearing or not wearing earphones.
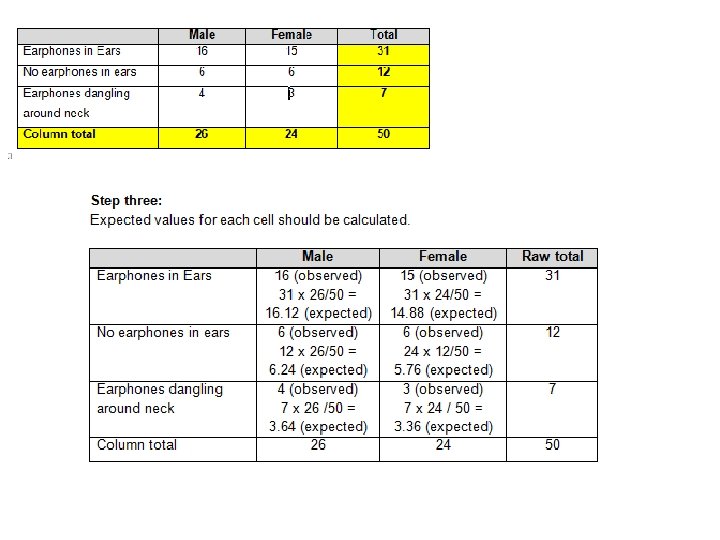
Step one: Add the totals for each column (these are in yellow in the table). For example – total male participants = 16 + 4 = 26 Total number of male and females with earphones in their ears = 16 + 15 = 31
Step four This formula will need to be used for each cell. For example, males/ no earphones in ears Observed Number is 6 Expected Number is 6. 24
Step five Add all observed values
Step six: Calculation of degrees of freedom (df) = (Number of Rows – 1) x (Number of Columns -1) In this example: (df) = (3 -1) x (2 -1) =2 x 1 Degree of freedom = 2
Step seven: use df in the look up table
In order for this study to be significant, the final observed Chi Squared value must be greater or equal to the critical value of Chi Square.
Round all calculation to 2 dp London Leeds Glasgow Guardian 12 10 5 Telegraph 18 7 3 Weights Cardio Classes Swimming Male 20 12 8 14 Female 15 18 25 10 (df) = (Number of Rows – 1) x (Number of Columns -1)
London Leeds Glasgow Total Guardian Observed number=12 Expected=14. 7 Observed value = 0. 50 Observed number=10 Expected=8. 35 Observed value =0. 33 Observed number=5 Expected=3. 92 Observed value = 0. 30 27 Telegraph Observed number=18 Expected=15. 27 Observed value =0. 49 Observed number=7 Expected=8. 65 Observed value =0. 31 Observed number=3 Expected=4. 07 Observed value =0. 29 28 Total 30 17 8 55 0. 5+0. 33+0. 49+. 31+. 29 = 2. 22 Df =1 x 2 = 2 Critical value = 5. 991
Step seven: use df in the look up table
Weights Cardio Classes Swimming Total Male Observed number = 20 Expected value = 15. 50 Observed value =5. 09 Observed number = 12 Expected value =13. 28 Observed value =0. 12 Observed number = 8 Expected value =14. 60 Observed value =2. 98 Observed number = 14 Expected value =10. 62 Observed value =1. 08 54 Female Observed number = 15 Expected value =19. 51 Observed value =1. 04 Observed number = 18 Expected value =16. 72 Observed value =0. 1 Observed number = 25 Expected value =18. 39 Observed value =2. 38 Observed number = 10 Expected value =13. 38 Observed value =0. 85 68 Total 35 30 33 24 122 5. 09+0. 12+2. 98+1. 04+0. 1+2. 38+0. 85=13. 65 Df= 3 x 1 = 3 critical value =7. 815
Step seven: use df in the look up table