Smart Home Cybersecurity Threat and Defense in a

Smart Home Cybersecurity: Threat and Defense in a Cyber-Physical System Professor Shiyan Hu Department of Electrical and Computer Engineering Michigan Technological University

Michigan Tech CPS Research Group Currently consists of 11 faculty members and more than 50 graduate students across departments of ECE, CS, ME and School of Technology. 2

International Advisory Board Member of U. S. National Academy of Engineering, IEEE Fellow, ACM Fellow Editor-In-Chief, IEEE Transactions on Computers, IEEE Fellow, IET Fellow, AAAS Fellow Deputy Editor-In-Chief, IEEE Transactions on Computer Aided Design, IEEE Fellow Editor-In-Chief, IEEE Transactions VLSI, Editor-In. Chief, ACM Journal on Emerging Technologies in Computing Systems, and Former Editor-In-Chief, IEEE Design & Test of Computers, IEEE Fellow, ACM Fellow Former Editor-In-Chief, IEEE Transactions on Computer Aided Design, IEEE Fellow Editor-In-Chief, ACM Transactions on Design Automation of Electronic Systems, IEEE Fellow Editor-In-Chief, IEEE Transactions on Circuits and Systems, IEEE Fellow Founding Chair, IEEE Smart Cities Initiative 3

Smart Home: Industrial Perspective 4

Smart Switch to Traditional Appliances 5

Many Sensors To Maintain 6

Smart Home: Academic Perspective 7

The Power System 5% energy efficiency improvement in residential users leads to carbon emission reduction equivalent to removing 53 million cars in U. S. 8

The Single User Smart Home Why we schedule? Power flow Internet Control flow 9

Varying Energy Consumption Typical summer energy load profile in State of Ontario, Canada. One can see the peak load around 7: 00 pm which usually involves a lot of human activities. Source: Ontario Energy Board 10

Dynamic Electricity Pricing Set high prices at peak energy hours to discourage the energy usage there for energy load balancing Hourly Price from Ameren Illinois 11

Energy Scheduling for a Single Smart Home Given the electricity pricing, to decide when to launch a home appliance The smart home scheduler at what power level computes the scheduling solutions for how long for future, so it needs the future subject to scheduling constraints pricing. How? Targets Reduce monetary cost of each user Reduce peak to average ratio of grid energy usage 12

Two Pricing Models: Guideline and Realtime Pricing Guideline price: utility publishes it one day ahead to guide customers to schedule their appliances, through providing the predicted pricing in the next 24 hours. Real time price: utility uses it to bill customers, e. g. , it obtains the total energy consumption in the past hour, computes the total bill as a quadratic function of the total energy, and then distributes the bill to each customer proportionally. 13

Multiple Users? Dynamic Pricing + Game Theory = U. S. Solution 0 1. 5 3 4. 5 6 7. 5 9 10. 5 12 13. 5 15 16. 5 18 19. 5 21 22. 5 24 14 12 10 8 6 4 2 0 Real Guideline Time Pricing Customer 1 Customer 2 . . . Customer n Game theory is used to handle the interactions among customers. 14

Decentralized Scheduling at Community level Each user schedules their own appliances separately Initialize Through the dynamic programming based algorithm No Converge ? Each user reschedules their own appliances separately Converge Yes End All users share information with each other No Yes Schedule 15

Case Study § 5 communities in which each one contains 400 customers, and 2 utilities. § Simulation time horizon is 24 hours from the current time, which is divided into 15 -minutes time slots. 16

Average Energy Consumption and Bill Many issues beyond energy and bill • Impact to electricity market • Architecture • Community level, city level • Centralized, decentralized, hierarchical • Reliability • Privacy • Cybersecurity 17

What Will be Discussed? Electricity Price § Hack the input of a smart meter (pricing cyberattack) Embedded Software Purposes of hacking Individual level: bill Energy reduction Load Local community level: load increase/fluctuation Larger area level: cascading effect § Hack the smart meter (hardware security) § Hack the output of a smart meter (energy theft) 18

Vulnerability in Pricing Propagation in AMI Utility Pricing Fiber Cable Aggregator TI So. C Based Smart Meter w/ Remote Upgrade Wi. MAX Base Station Access Point In Advanced Metering Infrastructure (AMI), Wi. MAX is used for the communication with smart meters. The smart meter of the customers connect to the base station of aggregator through the access point. Wi. MAX is able to operate on different frequency bands, primarily 2. 3, 2. 5, 3. 65 and 5 GHz. It has a throughput of 25 MBps (in practice). Each access point can serve 200 smart meters at the same time. 19
 Set high voltage and reboot from USB 20")
Hacking Google Nest (Backdoor) Set high voltage and reboot from USB 20
 § Remote switch § How to hack? –")
Hacking Belkin Wemo (Accessible Programming Port) § Remote switch § How to hack? – Connecting a UART adapter with “ 57600, 8 N 1” – Run the command “kill -9 $(ps | grep 'reboot'|sed -r -e 's/^ ([0 -9]+) [0 -9]+/1/')” – Root shell can be accessed § Company Response – New firmware adds SSL encryption and validation to prevent a malicious firmware attack. 21

Advanced Hacking: Secure Key Localization Input 1 State 1 Input 2 State 2 Input 3. . . State 3. . . ASIC Chip Encryption Communications Smart device communication is encrypted, but the secure key is typically in the flash but not ASIC. We can potentially locate the secure key. 22

Media Reports 23

Pricing Cyberattack For Reducing Hacker’s Bill Without Attack, $3. 82 paid by each customer Authentic Guideline Price With Attack, $4. 12 paid by each customer Fake Guideline Price Hacker wants to schedule here but it is expensive Actual Price Actual Energy Load Create a low price period. The attacker can schedule his energy consumption there with bill reduction by 34. 3%, while the bill of other customers are increased by 7. 9% on average. Now it is much cheaper 24
 Without Attack Fake Guideline Price Expected Energy")
Pricing Cyberattack Forming a Peak Load (Overloading) Without Attack Fake Guideline Price Expected Energy Load Hacker wants to create a peak on the energy load here With Attack Peak Energy Load Create a peak energy load and the peak to average ratio is increased by 35. 7%. The Actual Energy Load real time electricity price from 7: 00 pm to 9: 00 pm is increased by 43. 9%. 25

Cascading Impacts on a 5 -Bus System Line 1 Pricing cyberattack can increase the load and power flow. If the power flow on a line exceeds the capacity, the line is tripped. Bus 1 Line 4 Line 2 Bus 3 Bus 2 Line 5 Line 3 Line 7 Line 6 Bus 4 Bus 5 26

Detection Technology For Pricing Cyberattack § Detection of cyberattacks – Hacker changes the guideline pricing, so the key is to detect anomaly in guideline pricing. – The electricity price trends to be similar in short term. – Customers can use machine learning technique to predict energy price from recent historical data. – Compare the predicted guideline price with the received guideline price. – Support Vector Regression is a good choice as it provides robust training result. Electricity Price from 06/11 to 06/13 from Ameren Illinois 27

The Guideline Electricity Price Prediction The electricity price of the last T days. H is the number of time slots per day. Predicted guideline electricity price is computed as Kernel Function 28

Anomaly Detection? The First Idea How to set the threshold? Set it to 0, then all manipulation could be found but too much false detection. Set it to a large value, then few false alarm with few cyberattacks detected. If one can tolerate up to an impact (e. g. , 2% bill increase) due to cyberattack, then what is the right threshold? 29

The Second Idea: Alert if Impact is Signifcant 30

Predicted Guideline: Average Bill $3. 83, PAR 1. 17 Unattacked Guideline: Average Bill $3. 82, PAR 1. 153 Difference: Average Bill -0. 26%, PAR -1. 45% Predicted Guideline: Average Bill $3. 83, PAR 1. 17 Attacked Guideline: Average Bill $4. 09, PAR 1. 203 Difference: Average Bill 6. 79%, PAR 2. 82% 31

Limitation? § 32

Long Term Detection § Last hour a smart meter hacked, and this hour it is hacked again, so will it be hacked in the next hour? ? § Last hour 4 smart meters are hacked and this hour 7 smart meters hack, so what will be the next hour? ? 33

POMDP Based Long Term Defense § What is POMDP? – Partially Observable Markov Decision Process – Why good for long term defense? – Belief state, model training and probabilistic long term reward to account for the cumulative impact § Three layer architecture – Observation, State, Action – POMDP models the interactions among them 34

A Simple Example of POMDP § 35

Output of POMDP: Policy Transfer Graph 36

Step 1: Probabilistic State Transition Diagram • Learn from historical observation data • Calibrate the mapping from observation to state • Apply conditional probability (Bayesian rule) 37

Step 2: Probabilistic Transition to Policy Transfer Graph We need to account for the future impact 38

Model Future and Discount It Associate a reward to each action and weight it differently at different time slot. Find a series of actions leading to the maximum reward for the future k time slots. < < > < Discount Factor: 0. 5 > < 39

40

The POMDP Formulation § 41

Key 1: Observation, Action → State § 42

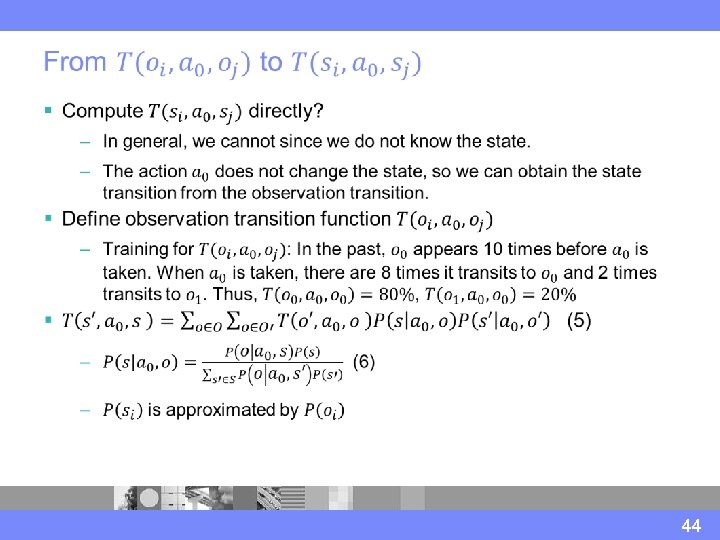
Key 2: State Transition Probability Computation § 43

Key 3: State → Action? § System loss when there is an undetected cyberattack Labor cost due to detection 45

Compute Prob. Transition and Optimal Series of Actions Leading to Maximum Reward 46
 and Eqn.")
Obtain the training data Obtain the reward functions according to Eqn. (7) and Eqn. (8) respectively. No IYes Apply single event defense technique on each smart meter to check the hacked smart meters and fix them. 47

Simulation Setup § We conduct 2 simulations on a small testcase and a large testcase. Parameter . 5 -customer 500 -customer 4 5 $50 $200 $500 0. 9 150 250 $2000 $25000 $100000 0. 9 48

Observation Accuracy for The 500 -Customer Testcase 49

Comparison on The 500 -Customer Testcase Method Cost No Defense Heuristic Method Proposed Method PAR Bill PAR Bill Labor 31. 3% 1 8. 40% 0. 313 1 3. 42% 0. 118 1. 0813 § 50

First Pricing Cyberattacks in Smart Home CPS Guideline price changes We explore interdependance between the power system (energy load) and the communication system (the transmitted price values). Actual price changes Energy usage changes 51

Energy Theft: Detection w/ Machine Learning? § A smart meter is hacked such that it transmits the reading of 100 k. Wh but actually 1000 k. Wh is measured. § Detectable through the statistical data analysis technique such as bollinger band. Energy consumption 2: 00 pm – 2: 15 pm over 100 days 52

Problem of This Idea § False positive Critical to distinguish – Anomaly data do not necessarily mean meter tampering tampered anomaly – They could be due to occasional user behavior change and non-tampered anomaly 53
 §")
Use Machine Learning and Deploy Sensors Together § Feeder Remote Terminal Unit (FRTU) § A device installed in the primary distribution network – Monitor the power flow of the distribution system – Communicate with smart meters – Communicate with Distribution Dispatching Center (DDC) – Perform some basic operation such as opening the switch – We propose to use it for cybersecurity FRTU 54

Using FRTU in Tampering Detection FRTU Node Industrial Consumer Residential Consumer Distribution Transformer Feeder head Level 4 1 2 Primary Network 5 6 11 12 13 14 Secondary Network 22 23 24 25 26 Level 3 3 4 7 8 9 15 16 17 18 19 20 21 27 28 29 30 31 32 33 10 Level 2 Level 1 34 35 55

Impact of Different FRTU Deployment FRTU Node Industrial Consumer Residential Consumer • Insert FRTU everywhere? • Please limited number Feeder head of FRTUs such that the Mismatch 1 detected system can well detect 2 3 4 smart meter tampering Distribution Transformer Primary Network Let’s go there to check… 5 6 11 12 13 14 9 10 7 8 15 16 17 18 19 20 21 Level 4 Level 3 Level 2 Level 1 Tampering Secondary Network 22 23 24 25 26 27 28 29 30 31 32 33 34 5635

Motivation 1 Probability that any of the 4 smart meters can have anomaly is 14. 5% 2 Primary Network 5 6 11 12 13 14 Secondary Network 22 10% Probability that Can narrow down any of the 4 smart to 4 smart meters can have with 100% anomaly is 28. 9% probability 3 4 7 8 9 15 16 17 18 19 20 21 These historical anomaly rates are changing 23 24 25 26 27 28 10 29 30 31 32 33 34 57 0% 0% 5% 35% 7% 0% 15% 7% 10% 57

Stochastic Problem Formulation § Minimize FRTU usage – Can narrow down to ≤ k meters with ≥ w% chance – Considering future load growth § We propose a stochastic optimization technique based on cross entropy optimization technique and conditional random field method 58

Theoretical Foundation of Cross Entropy Optimization ? 59
 f(X) aa Importance Sampling 60")
Estimating δ(a) f(X) aa Importance Sampling 60

Importance Sampling Each node is associated with a PDF indicating the probability to insert an FRTU Generate a set of samples using these PDFs Choose a set of top performance samples Update the corresponding PDF Repeat the above process until convergence 61

Our FRTU Deployment 62

Ongoing International Collaboration § Our group is currently collaborating with 9 groups internationally, spanning both industry and academia, on the topic of smart home cybersecurity. 63

Collusive Energy Theft § Attack a group of smart meters. – For example, reduce mine by 1000 kwh while increasing neighbors by 1000 kwh. – Interferes the electricity billing system leading to overloading without being sensed by the detection techniques. 64

Challenge #1: EV Energy § If some EVs move from a local community to the other community, since EV charging is a large load the community energy profile is significantly changed which impacts the electricity pricing. 65

Challenge #2: Renewable Energy and Net Metering Due to the renewable energy, the grid energy demand changes which impacts the electricity pricing. § According to net metering, the customers are allowed to sell the generated renewable energy back to power grid. § What is the right pricing? Behavior modelling? 66

Smart Building and HVAC The accurate HVAC modeling in a building can provide better energy and pricing prediction. This can help improve the cyberattack detection accuracy. 67

Hardware Security and Crosslayer Defense Electricity Price Embedded Software Energy Load § Part of detection code is implemented at a smart meter, but the smart meter itself can be hacked. § We need the crosslayer defense. 68

Chain of Hack Just check Java code? Java Code What if VM is hacked? Java Virtual Machine What if OS is hacked? OS What if firmware is hacked? Firmware Hardware 69

An Example • A potential solution is to add some specific registers in the hardware architecture to monitor where a code jumps. • The detection algorithm needs to consider both the software security analysis and the runtime readings from those specific registers. • This is a crosslayer security solution, which aims to establish a chain of trust. § Typically, the code jumps to the beginning of a routine. § The hacker can manipulate the binary code to jump to the middle of a routine which contains malicious code. 70

Developing POMDP Based Crosslayer Defense • Hierarchical Decomposition of the State Space • Cross Entropy Based State Minimization • Kernelized Approximate Dynamic Programming

Privacy: Obfuscation by Proxy Mapping Central Computer Customer A Customer B Customer C Proxy Customer 1 Customer 2 Customer 3 72

Homomorphic Encryption Encrypt both communication and computation 73
 Secondary")
Conclusion Distribution Dispatching Center Primary Distribution Network with Feeder Remote Terminal Units (FRTUs) Secondary Distribution Network with Smart Meters Customer Billing Center Network 74

Thanks 75
- Slides: 75