Simple Linear Regression Types of Regression Models Simple

 Linear Multiple (2<variables) Non-Linear")

 = 0")
 Regression line Intercept 0 Slope")
 Intercept 0 Regression line Slope")
 Intercept 0 Regression line Slope 1")

")


- Slides: 17
Simple Linear Regression
Types of Regression Models Simple (1 variable) Linear Multiple (2<variables) Non-Linear
Simple Linear Regression Model • The equation that describes how y is related to x and an error term is called the regression model. • The simple linear regression model is: y = 0 + 1 x +e – 0 and 1 are called parameters of the model. – e is a random variable called the error term.
Simple Linear Regression Equation n The simple linear regression equation is: E(y) = 0 + 1 x • Graph of the regression equation is a straight • • • line. 0 is the y intercept of the regression line. 1 is the slope of the regression line. E(y) is the expected value of y for a given x value.
Simple Linear Regression Equation n Positive Linear Relationship E(y) Regression line Intercept 0 Slope 1 is positive x
Simple Linear Regression Equation n Negative Linear Relationship E(y) Intercept 0 Regression line Slope 1 is negative x
Simple Linear Regression Equation n No Relationship E(y) Intercept 0 Regression line Slope 1 is 0 x
Estimated Simple Linear Regression Equation n The estimated simple linear regression equation is: • • The graph is called the estimated regression line. b 0 is the y intercept of the line. b 1 is the slope of the line. is the estimated value of y for a given x value.
Estimation Process Regression Model y = 0 + 1 x +e Regression Equation E(y) = 0 + 1 x Unknown Parameters 0, 1 b 0 and b 1 provide estimates of 0 and 1 Sample Data: x y x 1 y 1. . xn y n Estimated Regression Equation Sample Statistics b 0, b 1
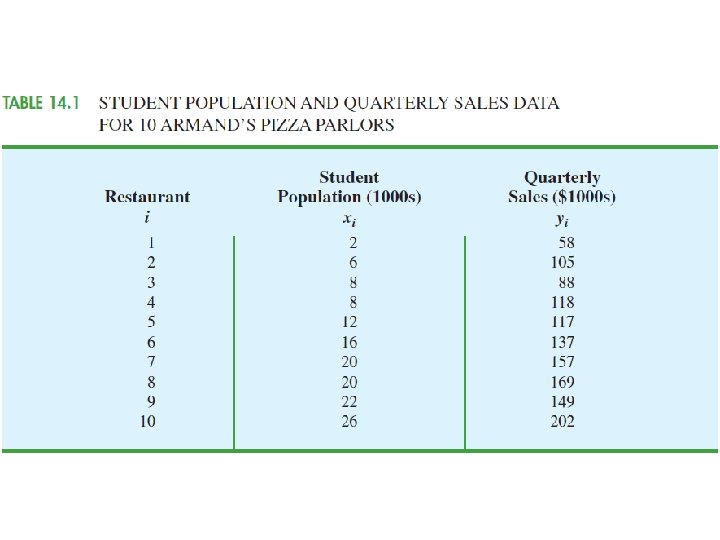
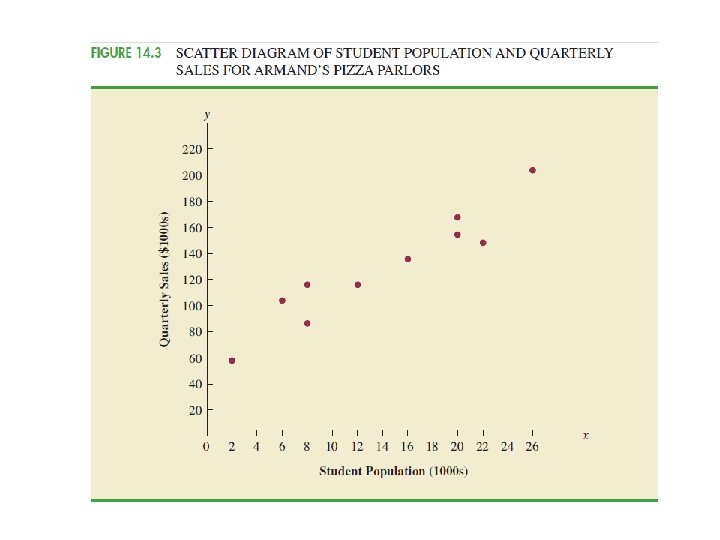
Simple Linear Regression Model Armand’s Pizza Parlors is a chain of Italian-food restaurants located in a five-state area. Armand’s most successful locations are near college campuses. The managers believe that quarterly sales for these restaurants (denoted by y) are related positively to the size of the student population (denoted by x); that is, restaurants near campuses with a large student population tend to generate more sales than those located near campuses with a small student population. Using regression analysis, we can develop an equation showing how the dependent variable y is related to
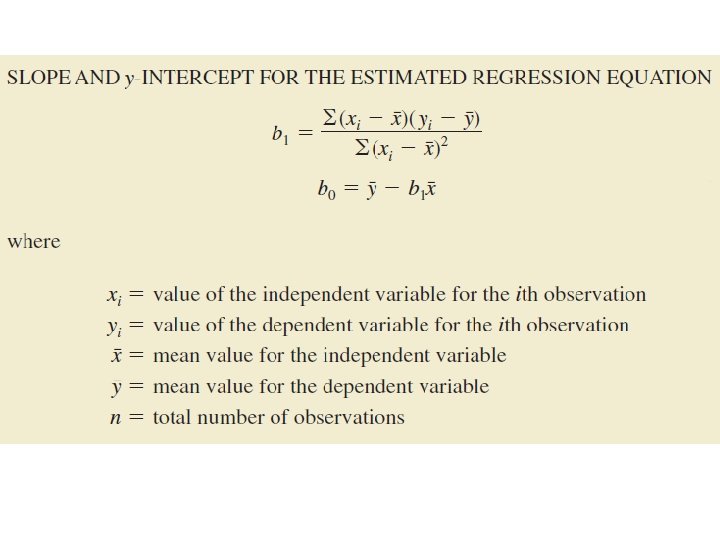
Least Squares Method The least squares method is a procedure for using sample data to find the estimated regression equation.
The slope of the estimated regression line The y intercept of the estimated regression line The estimated regression equation
Least Squares Method The least squares method is a procedure for using sample data to find the estimated regression equation. • Least Squares Criterion where: yi = observed value of the dependent variable ^ for the ith observation yi = estimated value of the dependent variable