Reverse Engineering Software CS695 Host Forensics Georgios Portokalidis

![ELF Information • elfsh – eresi project [ELF HEADER] [Object /bin/ls, MAGIC 0 x ELF Information • elfsh – eresi project [ELF HEADER] [Object /bin/ls, MAGIC 0 x](https://slidetodoc.com/presentation_image_h2/9029360bbff1b2393dbd6fa4252409a8/image-17.jpg)


- Slides: 75

Reverse Engineering Software CS-695 Host Forensics Georgios Portokalidis

Today • Introduction • Static analysis • Dynamic analysis • Challenges 2/236/2013 CS-695 Host Forensics 2

Reverse Engineering INTRODUCTION 2/236/2013 CS-695 Host Forensics 3

2/236/2013 CS-695 Host Forensics 4

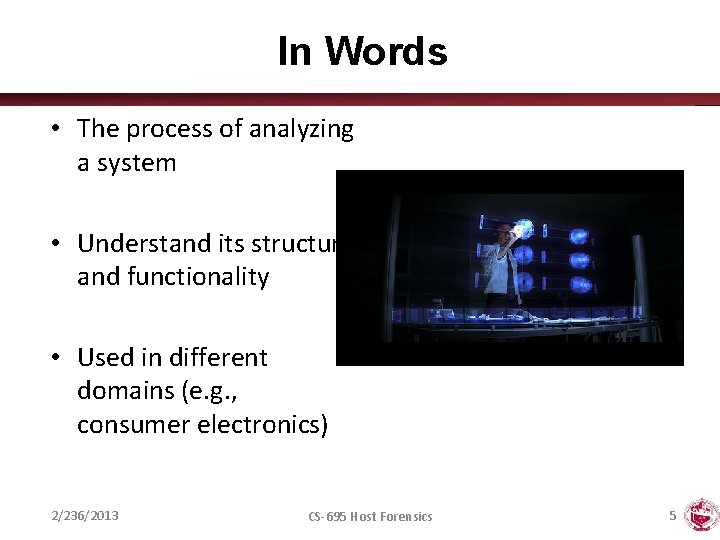
In Words • The process of analyzing a system • Understand its structure and functionality • Used in different domains (e. g. , consumer electronics) 2/236/2013 CS-695 Host Forensics 5

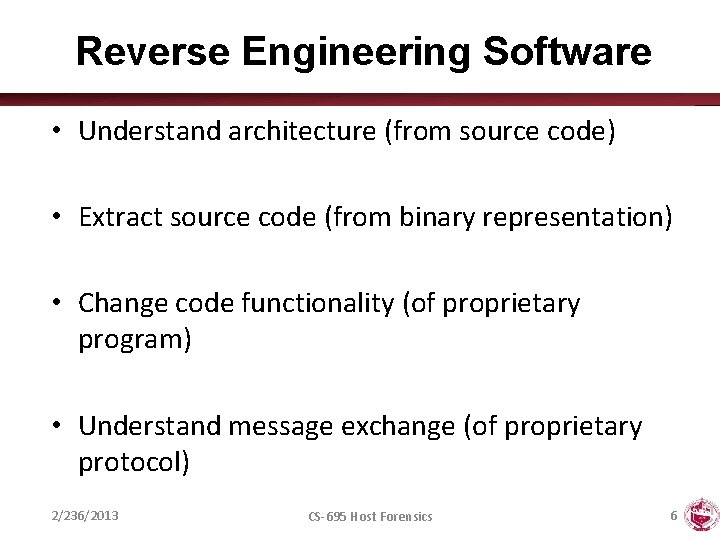
Reverse Engineering Software • Understand architecture (from source code) • Extract source code (from binary representation) • Change code functionality (of proprietary program) • Understand message exchange (of proprietary protocol) 2/236/2013 CS-695 Host Forensics 6

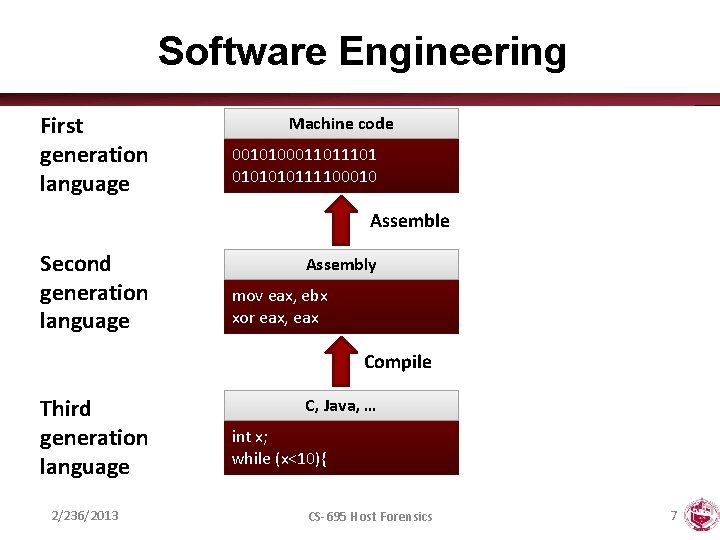
Software Engineering First generation language Machine code 001010001101 010111100010 Assemble Second generation language Assembly mov eax, ebx xor eax, eax Compile Third generation language 2/236/2013 C, Java, … int x; while (x<10){ CS-695 Host Forensics 7

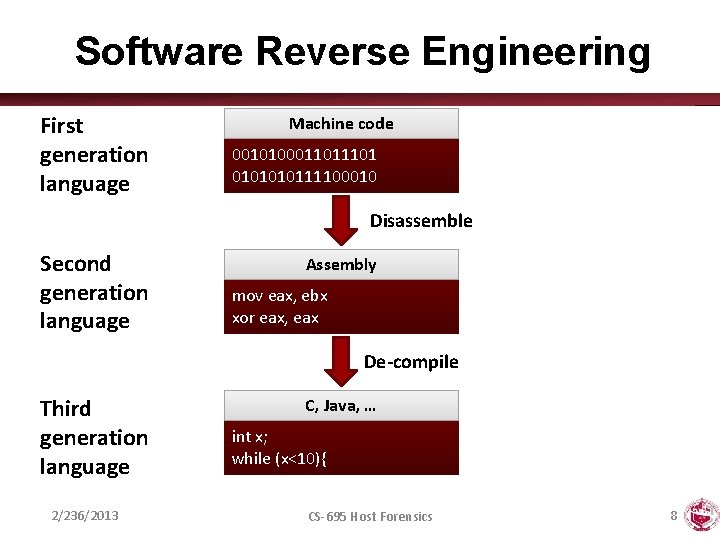
Software Reverse Engineering First generation language Machine code 001010001101 010111100010 Disassemble Second generation language Assembly mov eax, ebx xor eax, eax De-compile Third generation language 2/236/2013 C, Java, … int x; while (x<10){ CS-695 Host Forensics 8

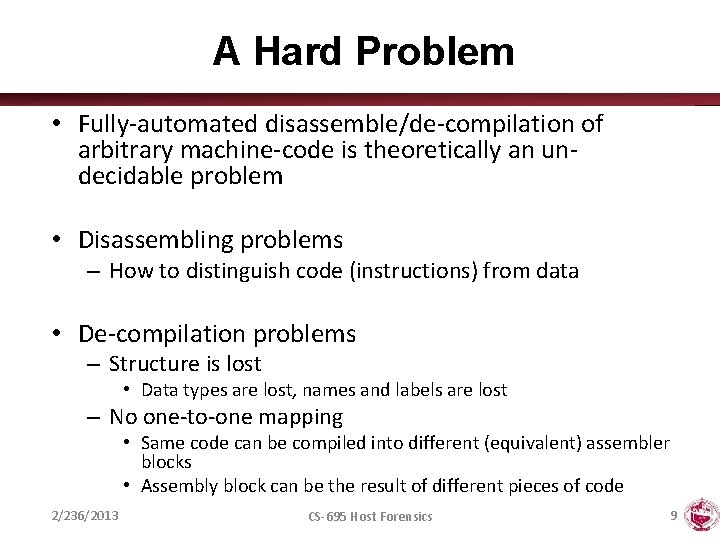
A Hard Problem • Fully-automated disassemble/de-compilation of arbitrary machine-code is theoretically an undecidable problem • Disassembling problems – How to distinguish code (instructions) from data • De-compilation problems – Structure is lost • Data types are lost, names and labels are lost – No one-to-one mapping • Same code can be compiled into different (equivalent) assembler blocks • Assembly block can be the result of different pieces of code 2/236/2013 CS-695 Host Forensics 9

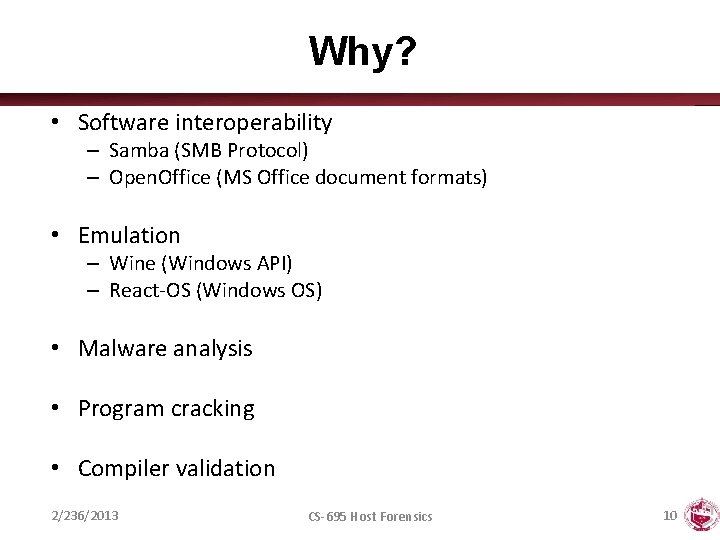
Why? • Software interoperability – Samba (SMB Protocol) – Open. Office (MS Office document formats) • Emulation – Wine (Windows API) – React-OS (Windows OS) • Malware analysis • Program cracking • Compiler validation 2/236/2013 CS-695 Host Forensics 10

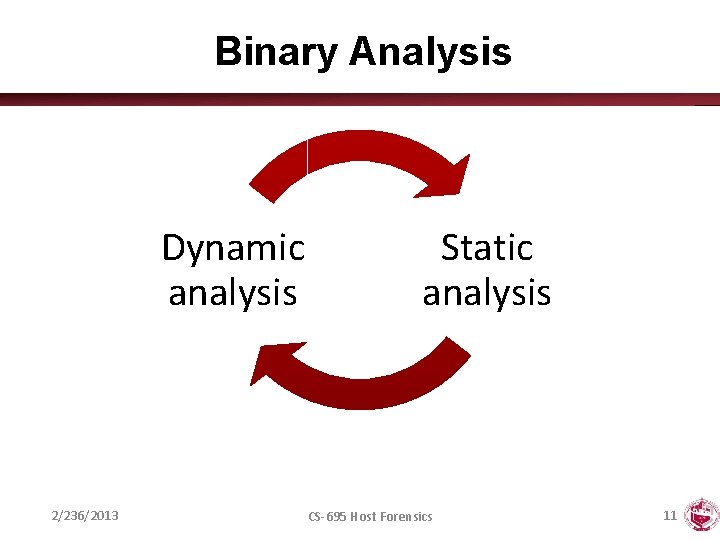
Binary Analysis Dynamic analysis 2/236/2013 Static analysis CS-695 Host Forensics 11

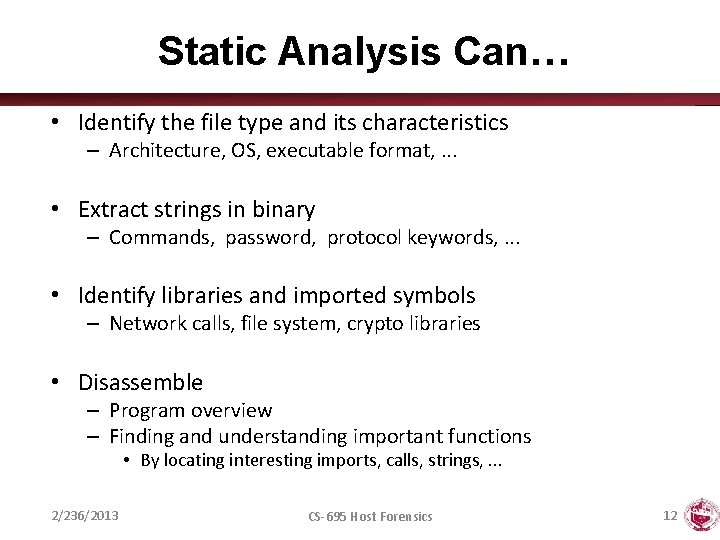
Static Analysis Can… • Identify the file type and its characteristics – Architecture, OS, executable format, . . . • Extract strings in binary – Commands, password, protocol keywords, . . . • Identify libraries and imported symbols – Network calls, file system, crypto libraries • Disassemble – Program overview – Finding and understanding important functions • By locating interesting imports, calls, strings, . . . 2/236/2013 CS-695 Host Forensics 12

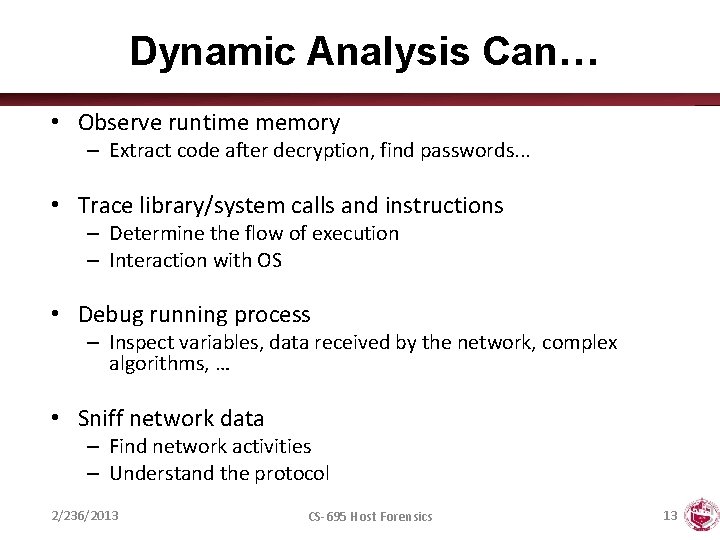
Dynamic Analysis Can… • Observe runtime memory – Extract code after decryption, find passwords. . . • Trace library/system calls and instructions – Determine the flow of execution – Interaction with OS • Debug running process – Inspect variables, data received by the network, complex algorithms, … • Sniff network data – Find network activities – Understand the protocol 2/236/2013 CS-695 Host Forensics 13

STATIC ANALYSIS 2/236/2013 CS-695 Host Forensics 14

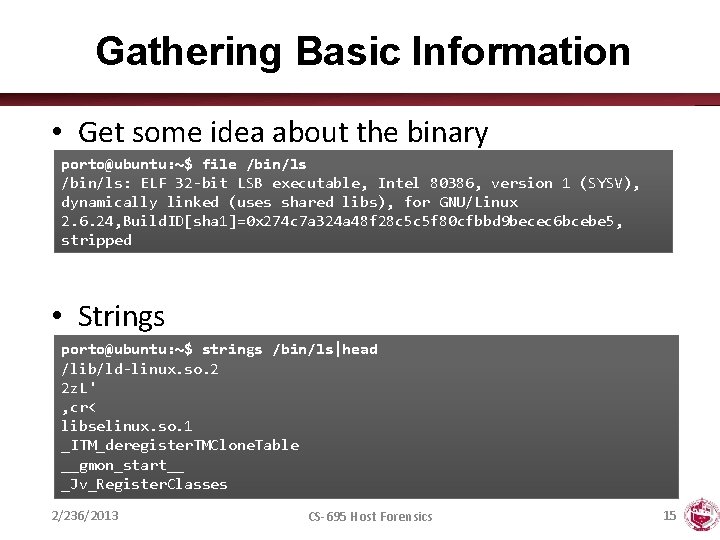
Gathering Basic Information • Get some idea about the binary porto@ubuntu: ~$ file /bin/ls: ELF 32 -bit LSB executable, Intel 80386, version 1 (SYSV), dynamically linked (uses shared libs), for GNU/Linux 2. 6. 24, Build. ID[sha 1]=0 x 274 c 7 a 324 a 48 f 28 c 5 c 5 f 80 cfbbd 9 becec 6 bcebe 5, stripped • Strings porto@ubuntu: ~$ strings /bin/ls|head /lib/ld-linux. so. 2 2 z. L' , cr< libselinux. so. 1 _ITM_deregister. TMClone. Table __gmon_start__ _Jv_Register. Classes 2/236/2013 CS-695 Host Forensics 15

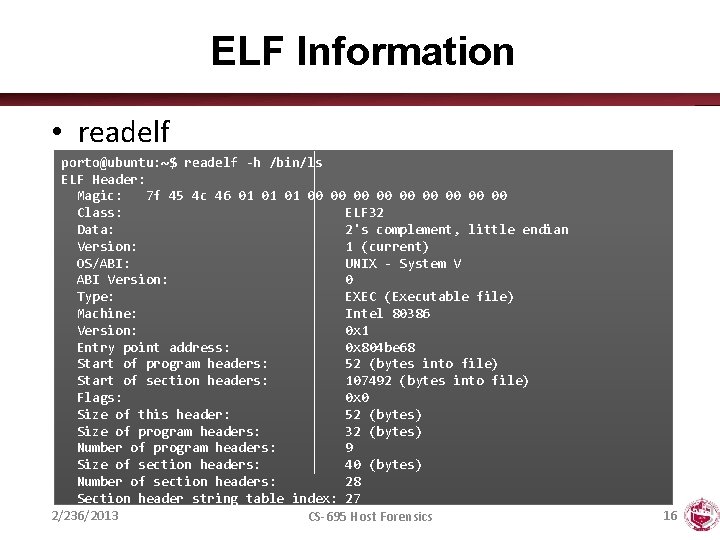
ELF Information • readelf porto@ubuntu: ~$ readelf -h /bin/ls ELF Header: Magic: 7 f 45 4 c 46 01 01 01 00 00 00 Class: ELF 32 Data: 2's complement, little endian Version: 1 (current) OS/ABI: UNIX - System V ABI Version: 0 Type: EXEC (Executable file) Machine: Intel 80386 Version: 0 x 1 Entry point address: 0 x 804 be 68 Start of program headers: 52 (bytes into file) Start of section headers: 107492 (bytes into file) Flags: 0 x 0 Size of this header: 52 (bytes) Size of program headers: 32 (bytes) Number of program headers: 9 Size of section headers: 40 (bytes) Number of section headers: 28 Section header string table index: 27 2/236/2013 CS-695 Host Forensics 16
![ELF Information elfsh eresi project ELF HEADER Object binls MAGIC 0 x ELF Information • elfsh – eresi project [ELF HEADER] [Object /bin/ls, MAGIC 0 x](https://slidetodoc.com/presentation_image_h2/9029360bbff1b2393dbd6fa4252409a8/image-17.jpg)
ELF Information • elfsh – eresi project [ELF HEADER] [Object /bin/ls, MAGIC 0 x 464 C 457 F] Architecture : Object type : Data encoding : PHT foffset : PHT entries number : PHT entry size : Runtime PHT offset : Entry point : {OLD PAX FLAGS = 0 x 0} PAX_PAGEEXEC : PAX_MPROTECT : PAX_RANDEXEC : 2/236/2013 Intel 80386 Executable object Little endian 000052 9 32 1179403657 0 x 0804 BE 68 Disabled Restricted Not randomized ELF Version SHT strtab index SHT foffset SHT entries number SHT entry size ELF header size Fingerprinted OS [? ] : : : : 1 27 0000107508 30 40 52 Linux PAX_EMULTRAMP PAX_RANDMAP PAX_SEGMEXEC : : : Not emulated Randomized Enabled CS-695 Host Forensics 17

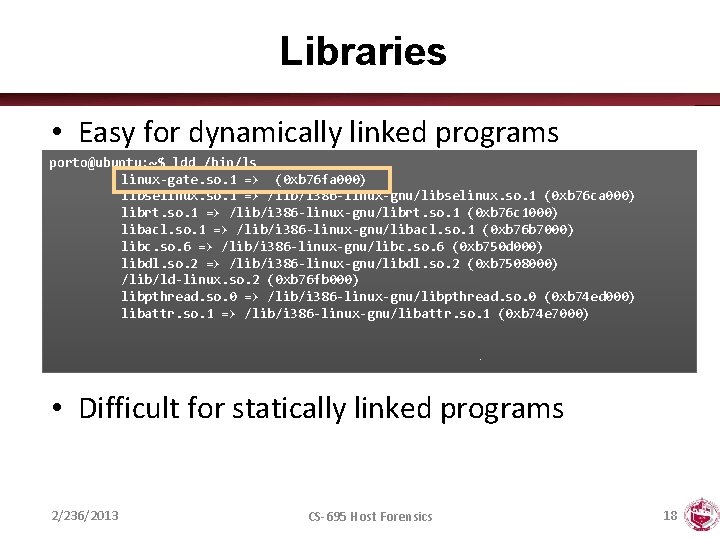
Libraries • Easy for dynamically linked programs porto@ubuntu: ~$ ldd /bin/ls linux-gate. so. 1 => (0 xb 76 fa 000) libselinux. so. 1 => /lib/i 386 -linux-gnu/libselinux. so. 1 (0 xb 76 ca 000) librt. so. 1 => /lib/i 386 -linux-gnu/librt. so. 1 (0 xb 76 c 1000) libacl. so. 1 => /lib/i 386 -linux-gnu/libacl. so. 1 (0 xb 76 b 7000) libc. so. 6 => /lib/i 386 -linux-gnu/libc. so. 6 (0 xb 750 d 000) libdl. so. 2 => /lib/i 386 -linux-gnu/libdl. so. 2 (0 xb 7508000) /lib/ld-linux. so. 2 (0 xb 76 fb 000) libpthread. so. 0 => /lib/i 386 -linux-gnu/libpthread. so. 0 (0 xb 74 ed 000) libattr. so. 1 => /lib/i 386 -linux-gnu/libattr. so. 1 (0 xb 74 e 7000) • Difficult for statically linked programs 2/236/2013 CS-695 Host Forensics 18

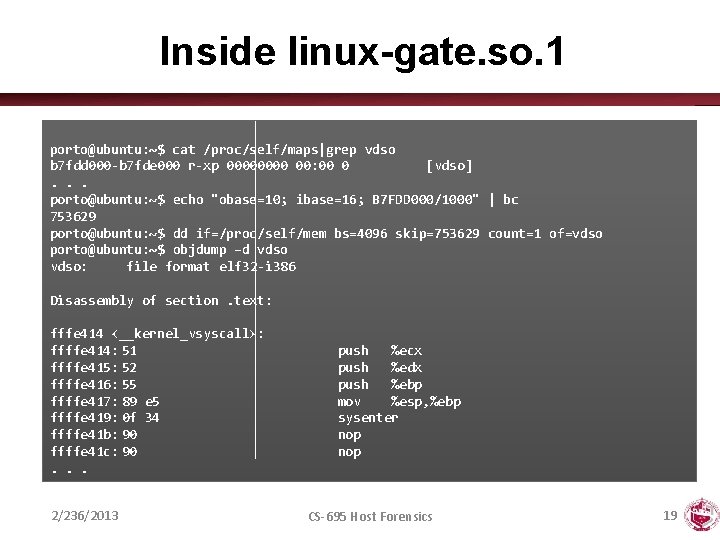
Inside linux-gate. so. 1 porto@ubuntu: ~$ cat /proc/self/maps|grep vdso b 7 fdd 000 -b 7 fde 000 r-xp 0000 00: 00 0 [vdso]. . . porto@ubuntu: ~$ echo "obase=10; ibase=16; B 7 FDD 000/1000" | bc 753629 porto@ubuntu: ~$ dd if=/proc/self/mem bs=4096 skip=753629 count=1 of=vdso porto@ubuntu: ~$ objdump –d vdso: file format elf 32 -i 386 Disassembly of section. text: fffe 414 <__kernel_vsyscall>: ffffe 414: 51 ffffe 415: 52 ffffe 416: 55 ffffe 417: 89 e 5 ffffe 419: 0 f 34 ffffe 41 b: 90 ffffe 41 c: 90. . . 2/236/2013 push %ecx push %edx push %ebp mov %esp, %ebp sysenter nop CS-695 Host Forensics 19

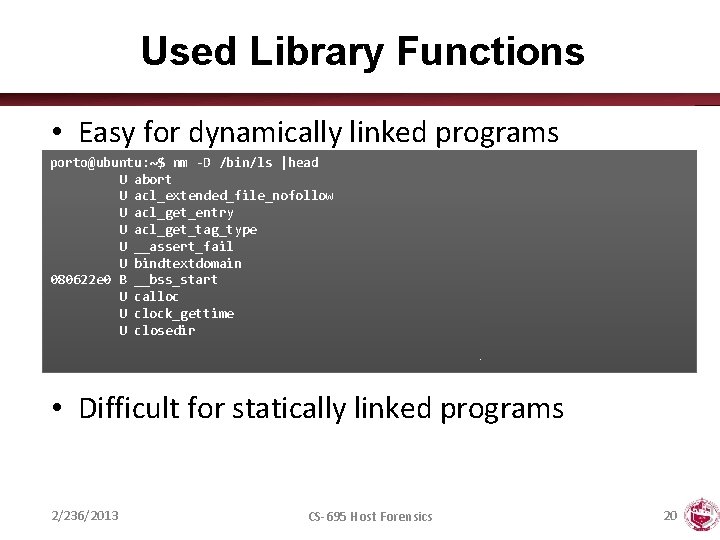
Used Library Functions • Easy for dynamically linked programs porto@ubuntu: ~$ nm -D /bin/ls |head U abort U acl_extended_file_nofollow U acl_get_entry U acl_get_tag_type U __assert_fail U bindtextdomain 080622 e 0 B __bss_start U calloc U clock_gettime U closedir • Difficult for statically linked programs 2/236/2013 CS-695 Host Forensics 20

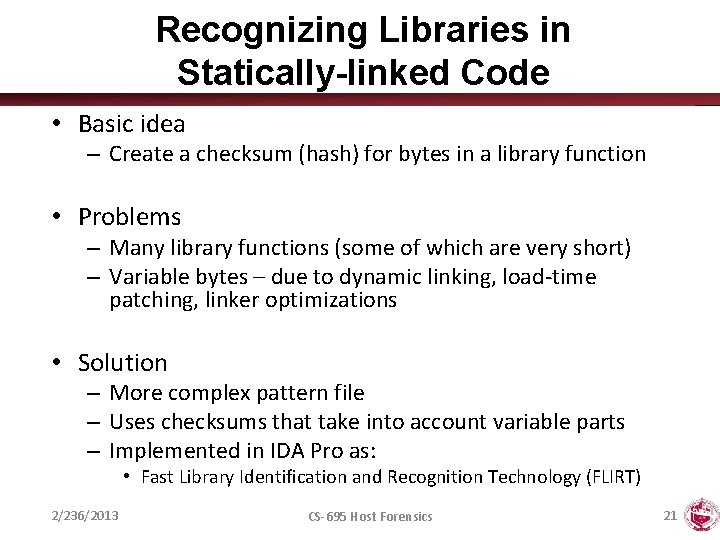
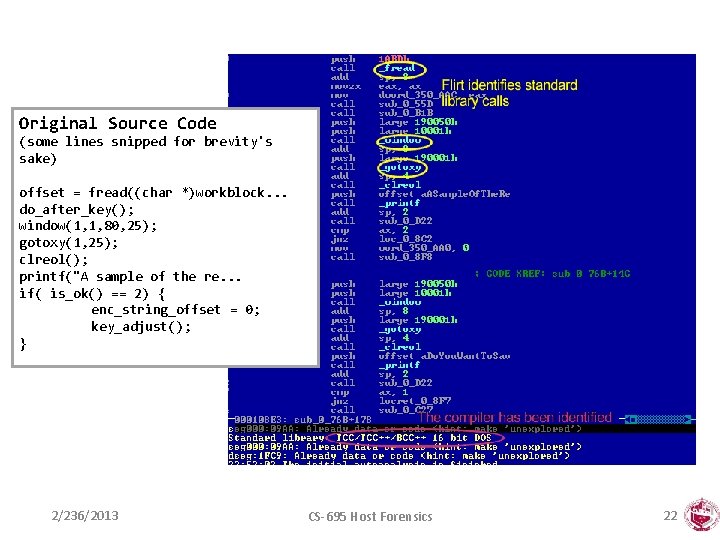
Recognizing Libraries in Statically-linked Code • Basic idea – Create a checksum (hash) for bytes in a library function • Problems – Many library functions (some of which are very short) – Variable bytes – due to dynamic linking, load-time patching, linker optimizations • Solution – More complex pattern file – Uses checksums that take into account variable parts – Implemented in IDA Pro as: • Fast Library Identification and Recognition Technology (FLIRT) 2/236/2013 CS-695 Host Forensics 21

Original Source Code (some lines snipped for brevity's sake) offset = fread((char *)workblock. . . do_after_key(); window(1, 1, 80, 25); gotoxy(1, 25); clreol(); printf("A sample of the re. . . if( is_ok() == 2) { enc_string_offset = 0; key_adjust(); } 2/236/2013 CS-695 Host Forensics 22

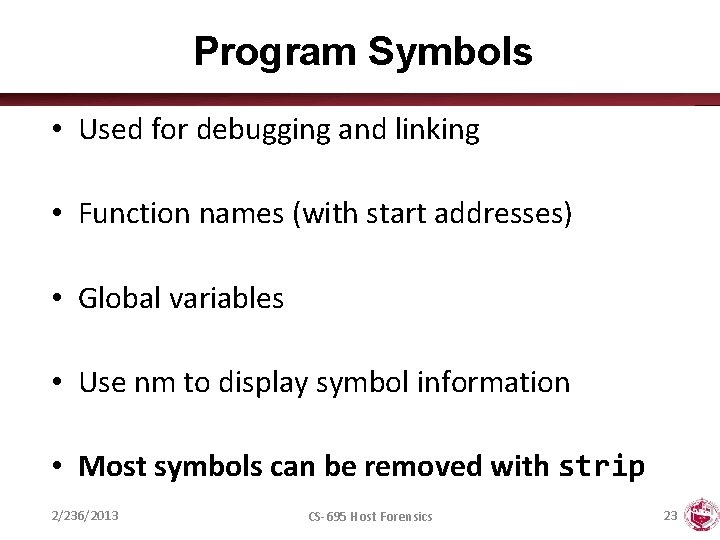
Program Symbols • Used for debugging and linking • Function names (with start addresses) • Global variables • Use nm to display symbol information • Most symbols can be removed with strip 2/236/2013 CS-695 Host Forensics 23

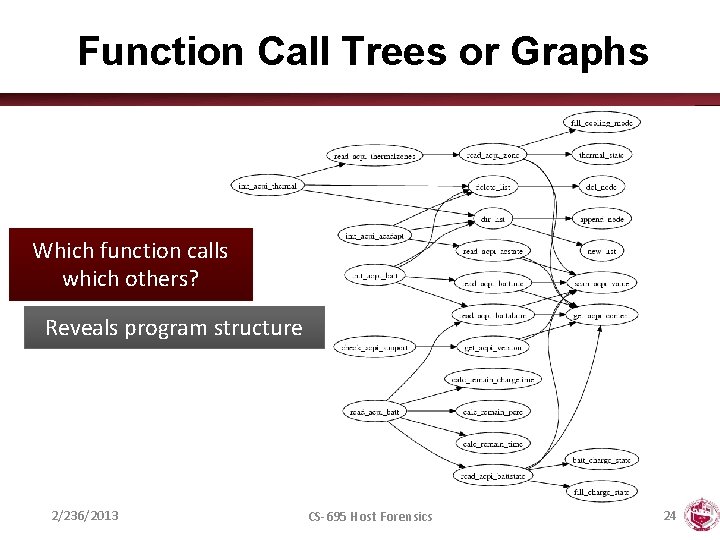
Function Call Trees or Graphs Which function calls which others? Reveals program structure 2/236/2013 CS-695 Host Forensics 24

Disassembly • The process of translating binary stream into machine instructions • Varying level of difficulty – Depending on ISA (instruction set architecture) • Instructions can have – Fixed length • More efficient to decode for processor • RISC processors (SPARC, MIPS) • Variable length – Use less space for common instructions – CISC processors (Intel x 86) 2/236/2013 CS-695 Host Forensics 25

Fixed vs. Variable Length Instructions • Fixed length instructions – Easy to disassemble – Take each address that is multiple of instruction length as instruction start – Even if code contains data (or junk), all program instructions are found • Variable length instructions – More difficult to disassemble – Start addresses of instructions not known in advance – Different strategies • Linear sweep disassembler • Recursive traversal disassembler – Disassembler can be desynchronized with respect to actual code 2/236/2013 CS-695 Host Forensics 26

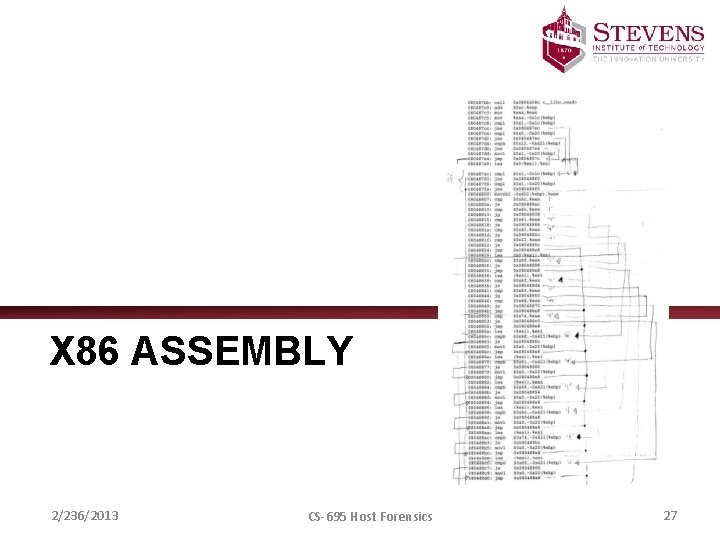
X 86 ASSEMBLY 2/236/2013 CS-695 Host Forensics 27

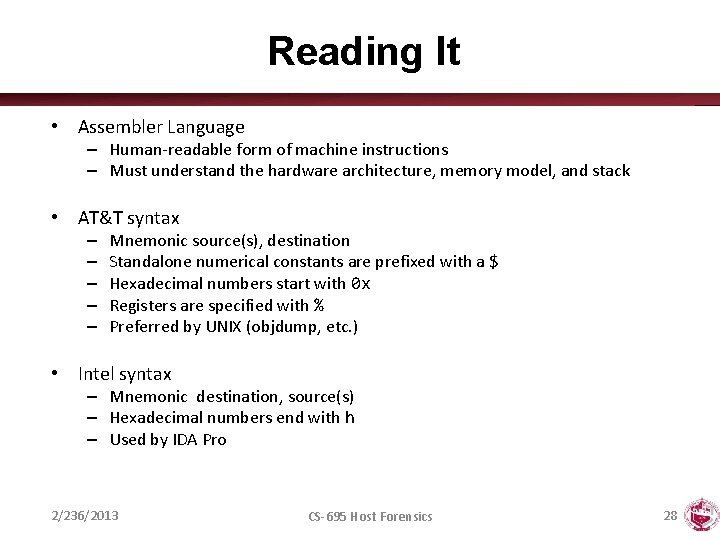
Reading It • Assembler Language – Human-readable form of machine instructions – Must understand the hardware architecture, memory model, and stack • AT&T syntax – – – Mnemonic source(s), destination Standalone numerical constants are prefixed with a $ Hexadecimal numbers start with 0 x Registers are specified with % Preferred by UNIX (objdump, etc. ) • Intel syntax – Mnemonic destination, source(s) – Hexadecimal numbers end with h – Used by IDA Pro 2/236/2013 CS-695 Host Forensics 28

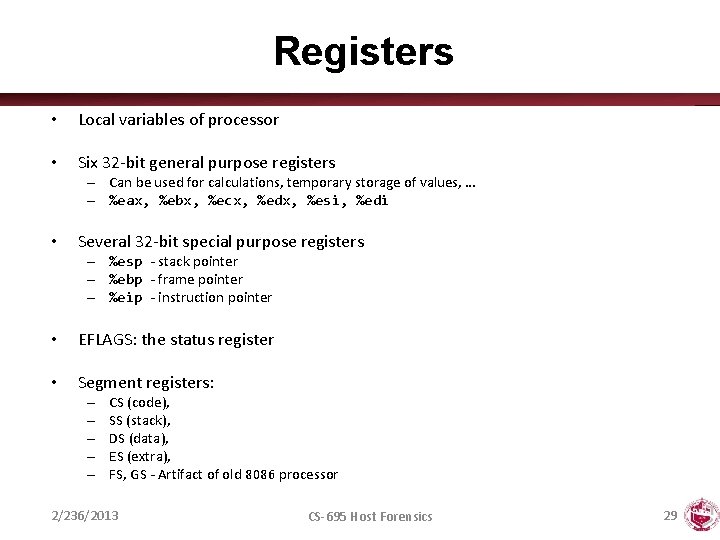
Registers • Local variables of processor • Six 32 -bit general purpose registers – Can be used for calculations, temporary storage of values, … – %eax, %ebx, %ecx, %edx, %esi, %edi • Several 32 -bit special purpose registers – %esp - stack pointer – %ebp - frame pointer – %eip - instruction pointer • EFLAGS: the status register • Segment registers: – – – CS (code), SS (stack), DS (data), ES (extra), FS, GS - Artifact of old 8086 processor 2/236/2013 CS-695 Host Forensics 29

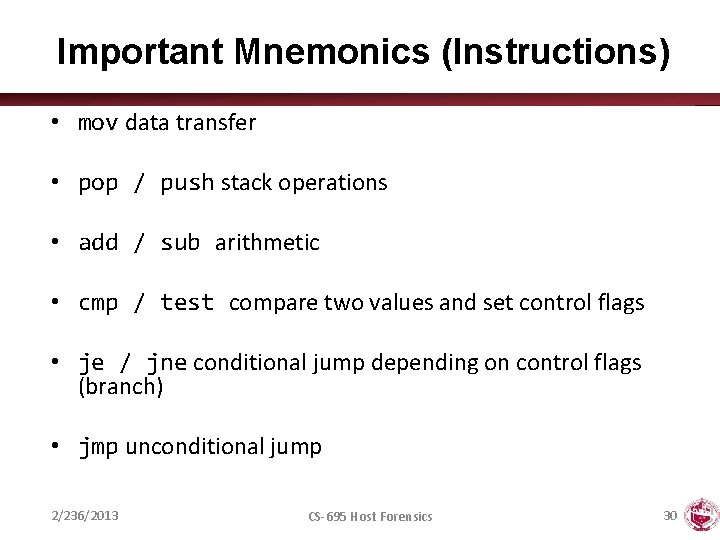
Important Mnemonics (Instructions) • mov data transfer • pop / push stack operations • add / sub arithmetic • cmp / test compare two values and set control flags • je / jne conditional jump depending on control flags (branch) • jmp unconditional jump 2/236/2013 CS-695 Host Forensics 30

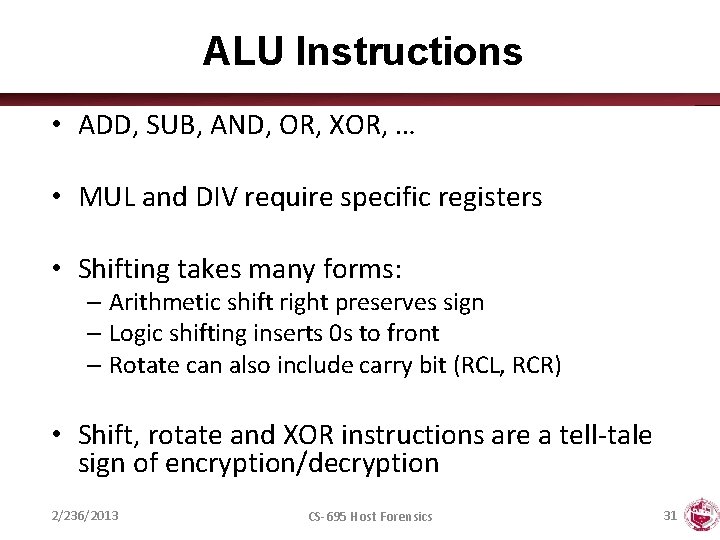
ALU Instructions • ADD, SUB, AND, OR, XOR, … • MUL and DIV require specific registers • Shifting takes many forms: – Arithmetic shift right preserves sign – Logic shifting inserts 0 s to front – Rotate can also include carry bit (RCL, RCR) • Shift, rotate and XOR instructions are a tell-tale sign of encryption/decryption 2/236/2013 CS-695 Host Forensics 31

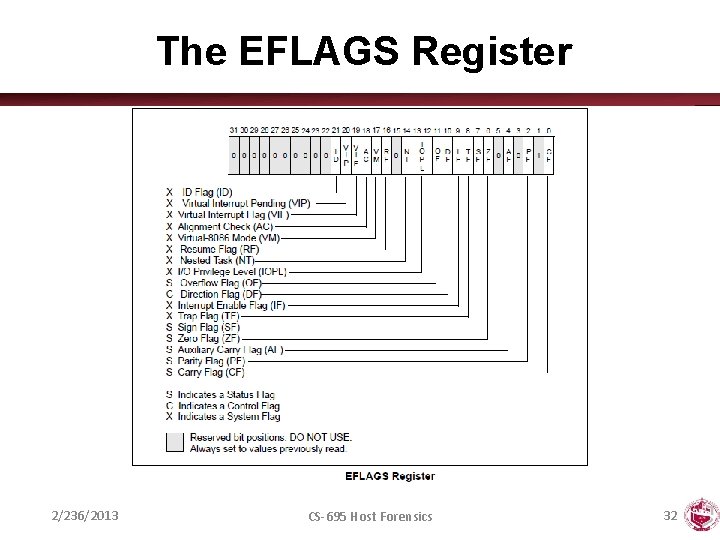
The EFLAGS Register 2/236/2013 CS-695 Host Forensics 32

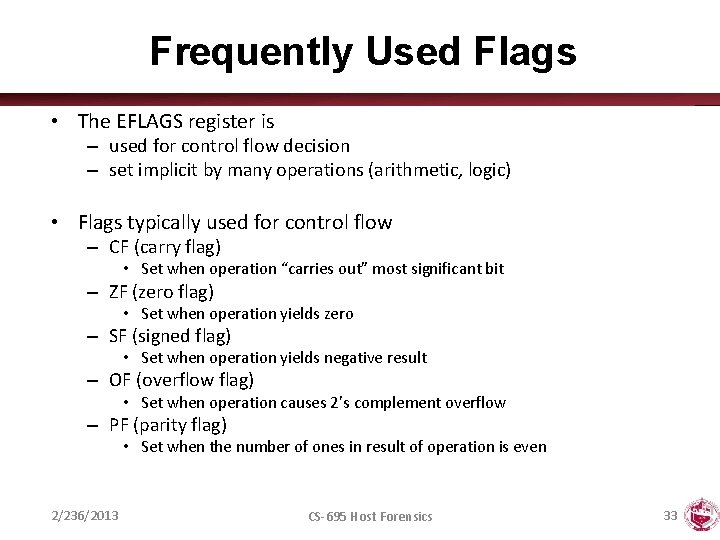
Frequently Used Flags • The EFLAGS register is – used for control flow decision – set implicit by many operations (arithmetic, logic) • Flags typically used for control flow – CF (carry flag) • Set when operation “carries out” most significant bit – ZF (zero flag) • Set when operation yields zero – SF (signed flag) • Set when operation yields negative result – OF (overflow flag) • Set when operation causes 2’s complement overflow – PF (parity flag) • Set when the number of ones in result of operation is even 2/236/2013 CS-695 Host Forensics 33

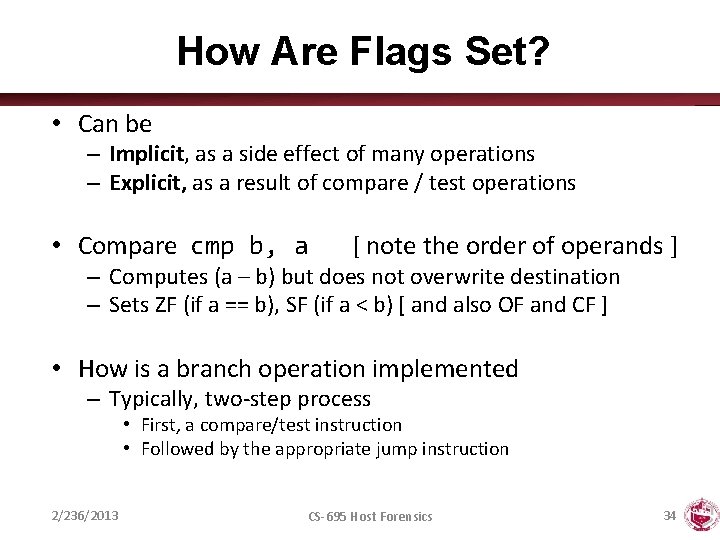
How Are Flags Set? • Can be – Implicit, as a side effect of many operations – Explicit, as a result of compare / test operations • Compare cmp b, a [ note the order of operands ] – Computes (a – b) but does not overwrite destination – Sets ZF (if a == b), SF (if a < b) [ and also OF and CF ] • How is a branch operation implemented – Typically, two-step process • First, a compare/test instruction • Followed by the appropriate jump instruction 2/236/2013 CS-695 Host Forensics 34

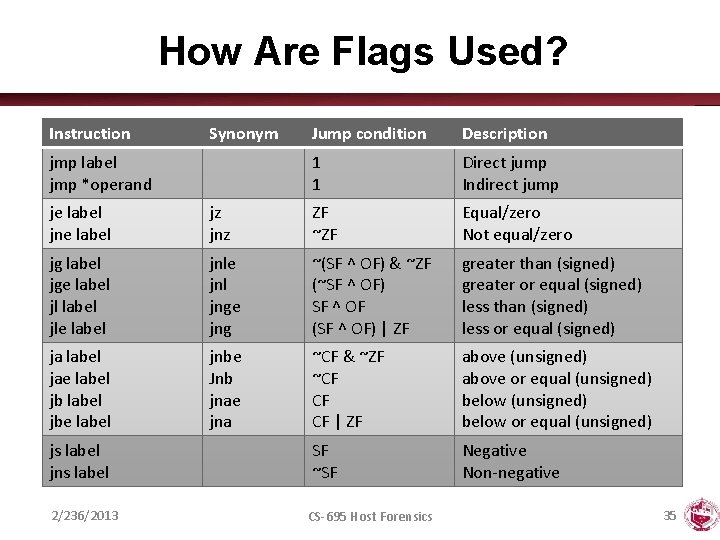
How Are Flags Used? Instruction Synonym jmp label jmp *operand Jump condition Description 1 1 Direct jump Indirect jump je label jne label jz jnz ZF ~ZF Equal/zero Not equal/zero jg label jge label jle label jnle jnl jnge jng ~(SF ^ OF) & ~ZF (~SF ^ OF) SF ^ OF (SF ^ OF) | ZF greater than (signed) greater or equal (signed) less than (signed) less or equal (signed) ja label jae label jbe label jnbe Jnb jnae jna ~CF & ~ZF ~CF CF CF | ZF above (unsigned) above or equal (unsigned) below or equal (unsigned) js label jns label SF ~SF Negative Non-negative 2/236/2013 CS-695 Host Forensics 35

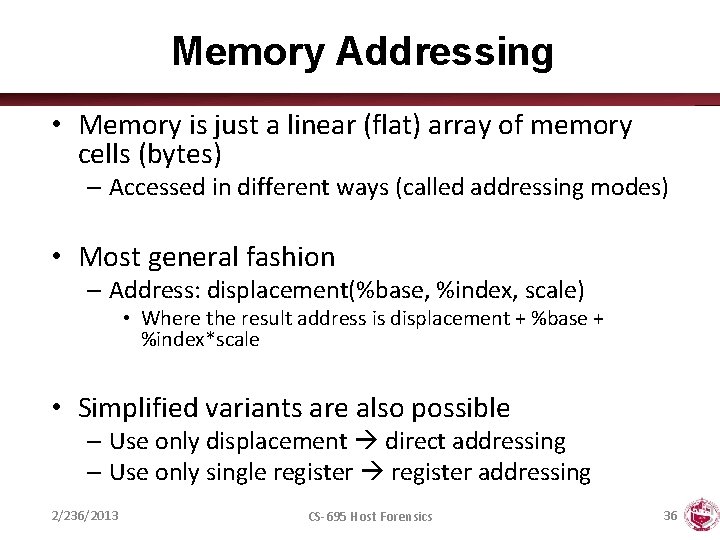
Memory Addressing • Memory is just a linear (flat) array of memory cells (bytes) – Accessed in different ways (called addressing modes) • Most general fashion – Address: displacement(%base, %index, scale) • Where the result address is displacement + %base + %index*scale • Simplified variants are also possible – Use only displacement direct addressing – Use only single register addressing 2/236/2013 CS-695 Host Forensics 36

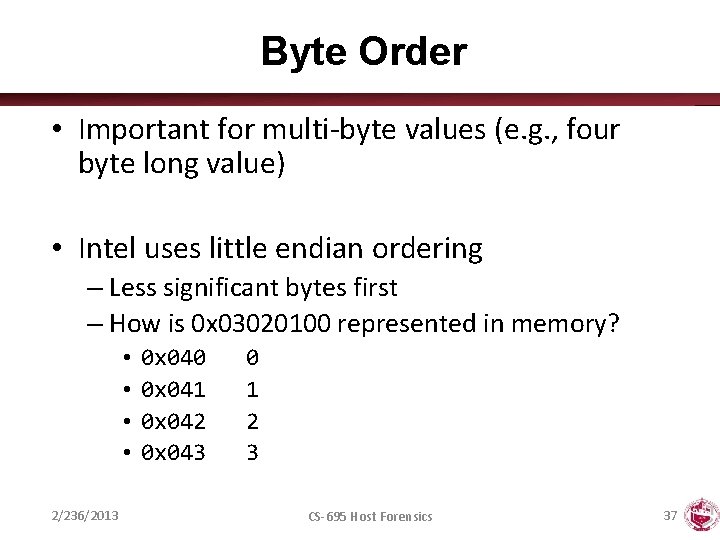
Byte Order • Important for multi-byte values (e. g. , four byte long value) • Intel uses little endian ordering – Less significant bytes first – How is 0 x 03020100 represented in memory? • • 2/236/2013 0 x 040 0 x 041 0 x 042 0 x 043 0 1 2 3 CS-695 Host Forensics 37

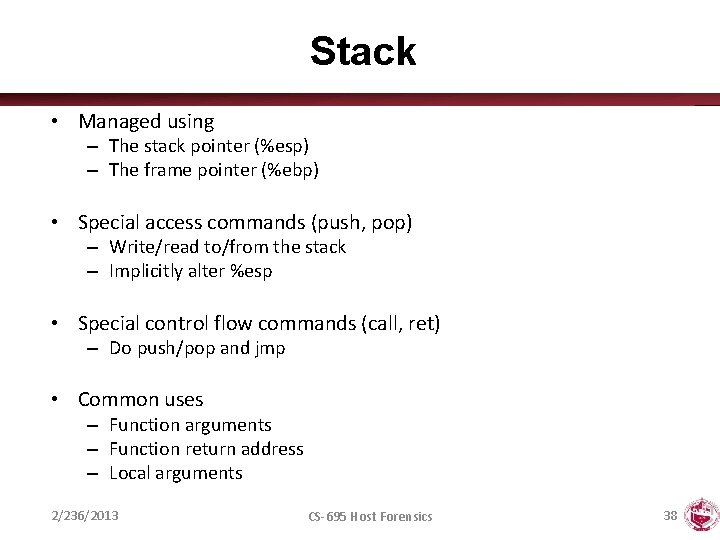
Stack • Managed using – The stack pointer (%esp) – The frame pointer (%ebp) • Special access commands (push, pop) – Write/read to/from the stack – Implicitly alter %esp • Special control flow commands (call, ret) – Do push/pop and jmp • Common uses – Function arguments – Function return address – Local arguments 2/236/2013 CS-695 Host Forensics 38

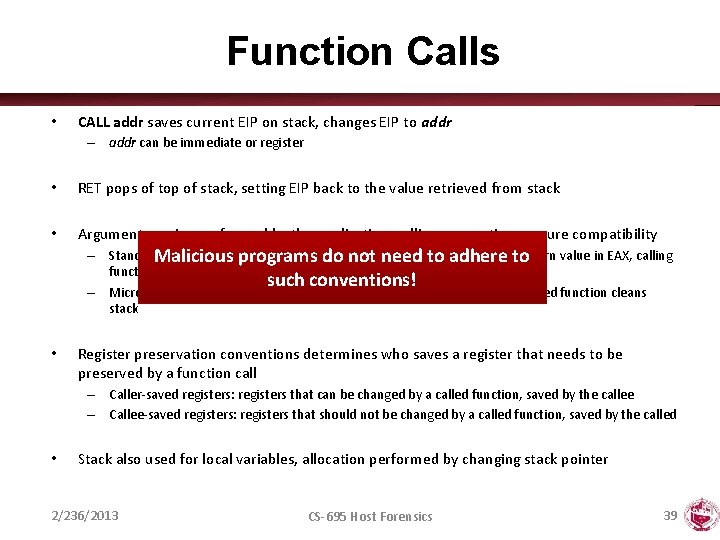
Function Calls • CALL addr saves current EIP on stack, changes EIP to addr – addr can be immediate or register • RET pops of top of stack, setting EIP back to the value retrieved from stack • Argument passing performed by the application, calling conventions ensure compatibility – Standard. Malicious C conventionprograms (cdecl): Arguments pushed on stack do not need to right-to-left, adhere toreturn value in EAX, calling function cleans stack (i. e. , removes arguments) such conventions! – Microsoft Win 32 convention (stdcall): Same as standard convention, but called function cleans stack • Register preservation conventions determines who saves a register that needs to be preserved by a function call – Caller-saved registers: registers that can be changed by a called function, saved by the callee – Callee-saved registers: registers that should not be changed by a called function, saved by the called • Stack also used for local variables, allocation performed by changing stack pointer 2/236/2013 CS-695 Host Forensics 39

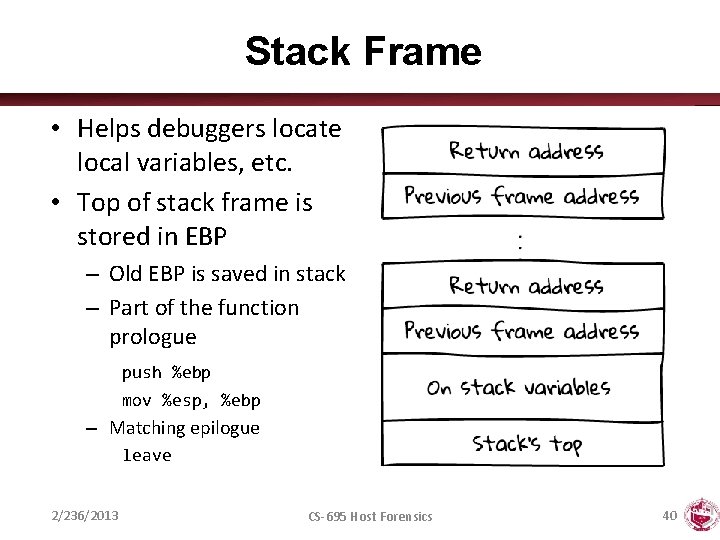
Stack Frame • Helps debuggers locate local variables, etc. • Top of stack frame is stored in EBP – Old EBP is saved in stack – Part of the function prologue push %ebp mov %esp, %ebp – Matching epilogue leave 2/236/2013 CS-695 Host Forensics 40

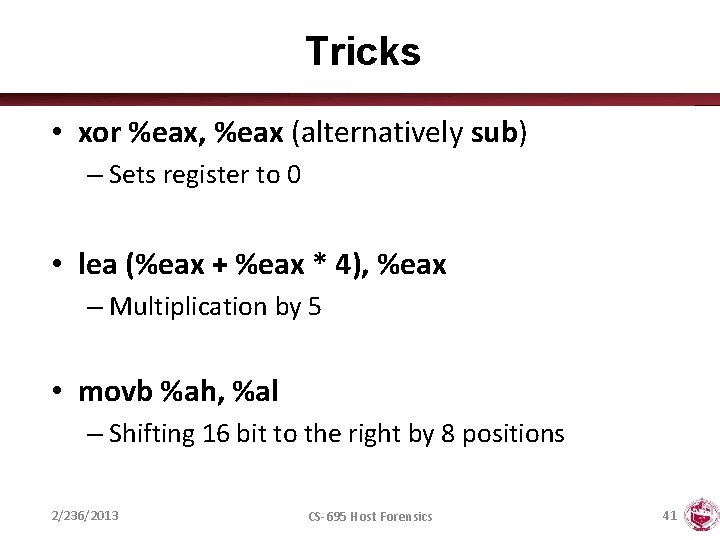
Tricks • xor %eax, %eax (alternatively sub) – Sets register to 0 • lea (%eax + %eax * 4), %eax – Multiplication by 5 • movb %ah, %al – Shifting 16 bit to the right by 8 positions 2/236/2013 CS-695 Host Forensics 41

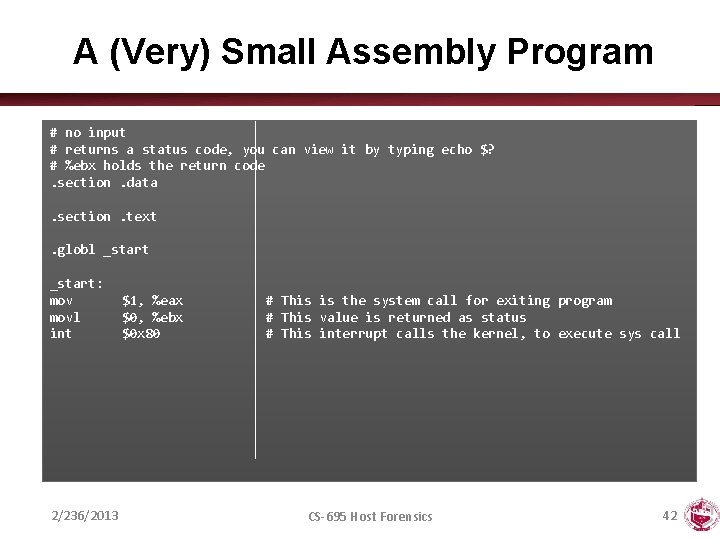
A (Very) Small Assembly Program # no input # returns a status code, you can view it by typing echo $? # %ebx holds the return code. section. data. section. text. globl _start: movl int 2/236/2013 $1, %eax $0, %ebx $0 x 80 # This is the system call for exiting program # This value is returned as status # This interrupt calls the kernel, to execute sys call CS-695 Host Forensics 42

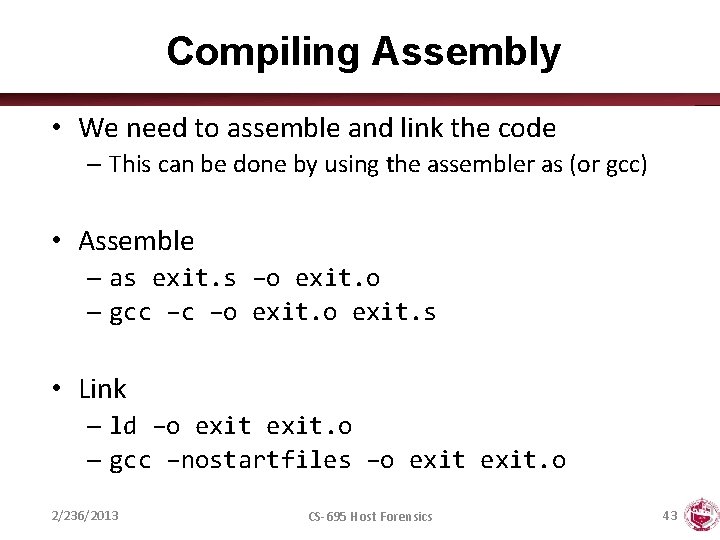
Compiling Assembly • We need to assemble and link the code – This can be done by using the assembler as (or gcc) • Assemble – as exit. s –o exit. o – gcc –c –o exit. s • Link – ld –o exit. o – gcc –nostartfiles –o exit. o 2/236/2013 CS-695 Host Forensics 43

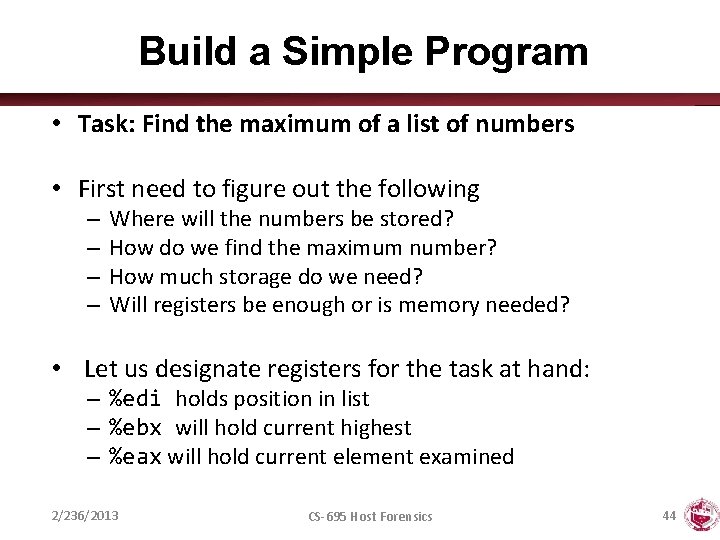
Build a Simple Program • Task: Find the maximum of a list of numbers • First need to figure out the following – – Where will the numbers be stored? How do we find the maximum number? How much storage do we need? Will registers be enough or is memory needed? • Let us designate registers for the task at hand: – %edi holds position in list – %ebx will hold current highest – %eax will hold current element examined 2/236/2013 CS-695 Host Forensics 44

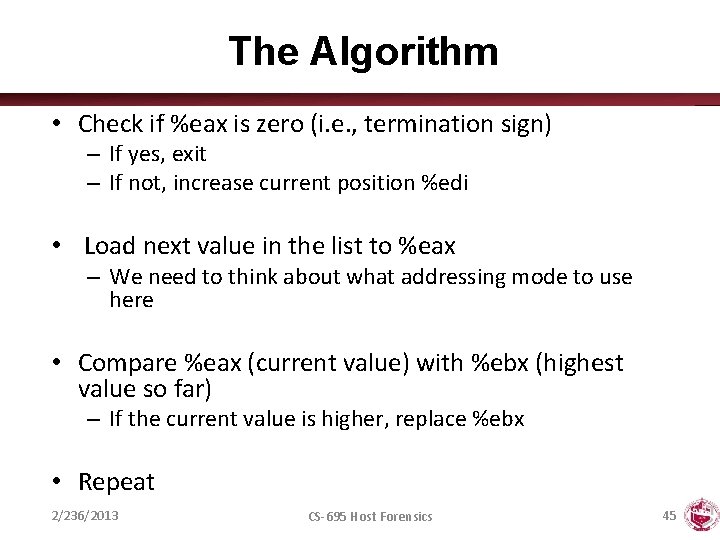
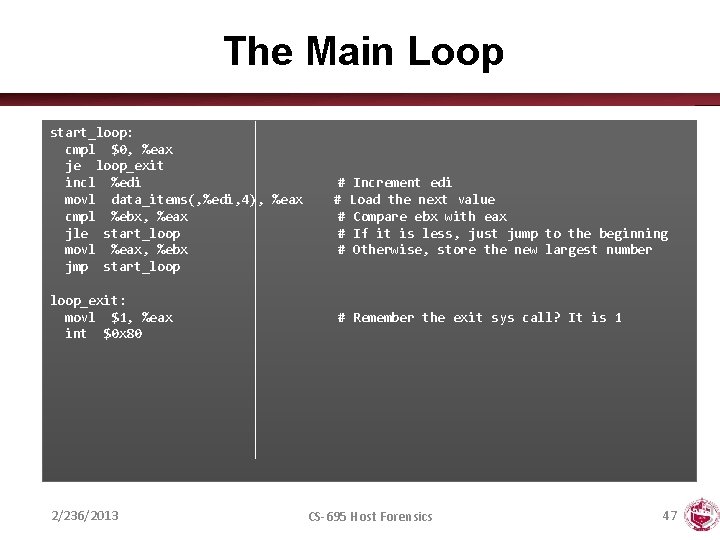
The Algorithm • Check if %eax is zero (i. e. , termination sign) – If yes, exit – If not, increase current position %edi • Load next value in the list to %eax – We need to think about what addressing mode to use here • Compare %eax (current value) with %ebx (highest value so far) – If the current value is higher, replace %ebx • Repeat 2/236/2013 CS-695 Host Forensics 45

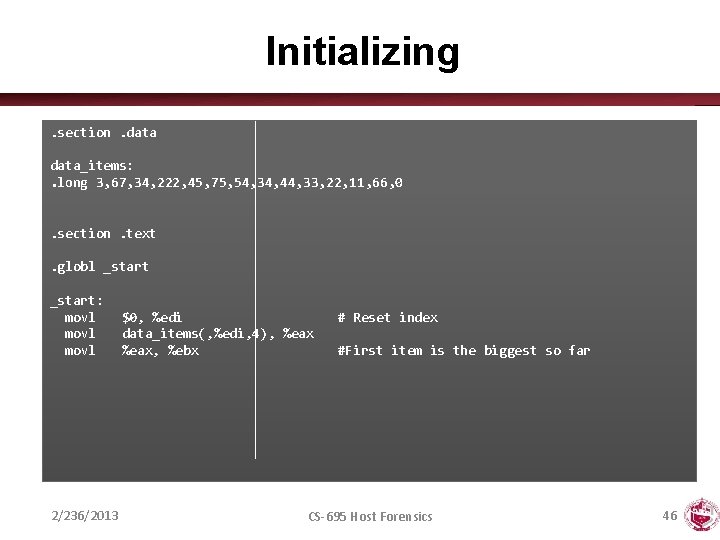
Initializing. section. data_items: . long 3, 67, 34, 222, 45, 75, 54, 34, 44, 33, 22, 11, 66, 0. section. text. globl _start: movl 2/236/2013 $0, %edi data_items(, %edi, 4), %eax, %ebx # Reset index #First item is the biggest so far CS-695 Host Forensics 46

The Main Loop start_loop: cmpl $0, %eax je loop_exit incl %edi movl data_items(, %edi, 4), %eax cmpl %ebx, %eax jle start_loop movl %eax, %ebx jmp start_loop_exit: movl $1, %eax int $0 x 80 2/236/2013 # Increment edi # Load the next value # Compare ebx with eax # If it is less, just jump to the beginning # Otherwise, store the new largest number # Remember the exit sys call? It is 1 CS-695 Host Forensics 47

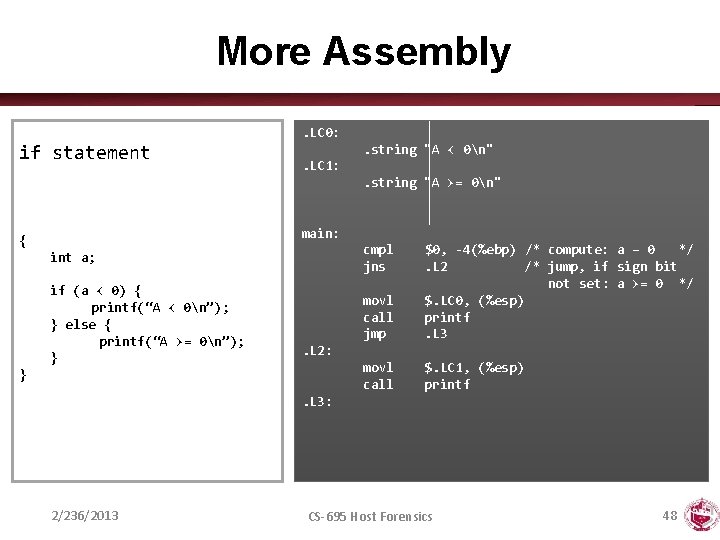
More Assembly. LC 0: if statement . string "A < 0n". LC 1: . string "A >= 0n" main: { cmpl jns int a; if (a < 0) { printf(“A < 0n”); } else { printf(“A >= 0n”); } movl call jmp $0, -4(%ebp) /* compute: a – 0 */. L 2 /* jump, if sign bit not set: a >= 0 */ $. LC 0, (%esp) printf. L 3 movl call $. LC 1, (%esp) printf . L 2: }. L 3: 2/236/2013 CS-695 Host Forensics 48

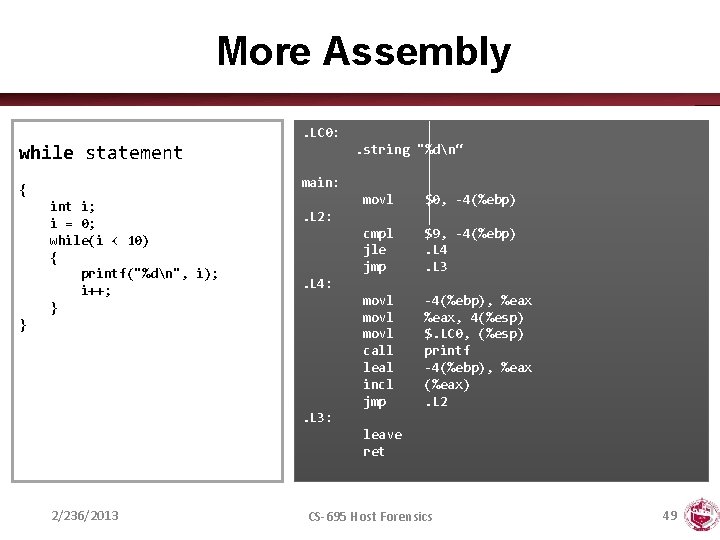
More Assembly. LC 0: . string "%dn“ while statement main: { int i; i = 0; while(i < 10) { printf("%dn", i); i++; } movl $0, -4(%ebp) cmpl jle jmp $9, -4(%ebp). L 4. L 3 movl call leal incl jmp -4(%ebp), %eax, 4(%esp) $. LC 0, (%esp) printf -4(%ebp), %eax (%eax). L 2: . L 4: } . L 3: leave ret 2/236/2013 CS-695 Host Forensics 49

DISASSEMBLY 2/236/2013 CS-695 Host Forensics 50

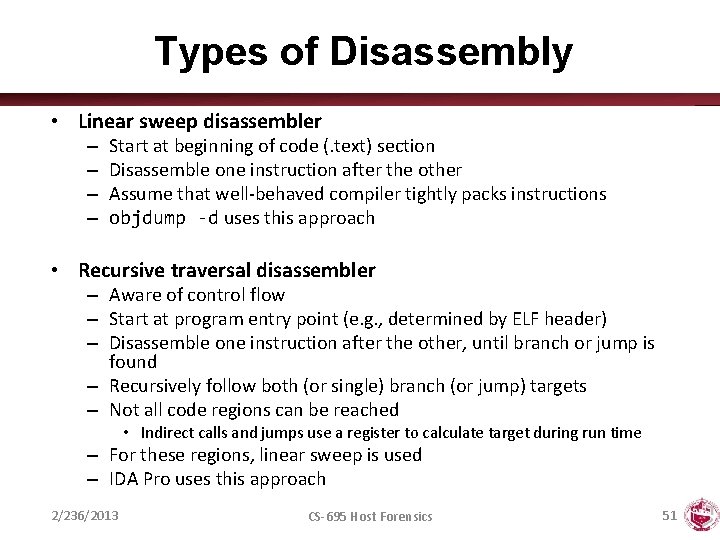
Types of Disassembly • Linear sweep disassembler – – Start at beginning of code (. text) section Disassemble one instruction after the other Assume that well-behaved compiler tightly packs instructions objdump -d uses this approach • Recursive traversal disassembler – Aware of control flow – Start at program entry point (e. g. , determined by ELF header) – Disassemble one instruction after the other, until branch or jump is found – Recursively follow both (or single) branch (or jump) targets – Not all code regions can be reached • Indirect calls and jumps use a register to calculate target during run time – For these regions, linear sweep is used – IDA Pro uses this approach 2/236/2013 CS-695 Host Forensics 51

IDA Pro • Recursive decent disassembler • Interactive & Iterative • Scriptable (Python & C-like language) • Used to analyze malware 2/236/2013 CS-695 Host Forensics 52

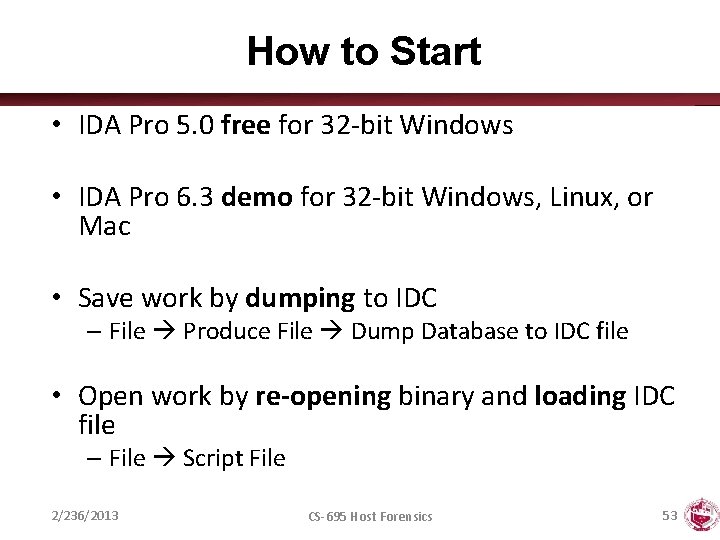
How to Start • IDA Pro 5. 0 free for 32 -bit Windows • IDA Pro 6. 3 demo for 32 -bit Windows, Linux, or Mac • Save work by dumping to IDC – File Produce File Dump Database to IDC file • Open work by re-opening binary and loading IDC file – File Script File 2/236/2013 CS-695 Host Forensics 53

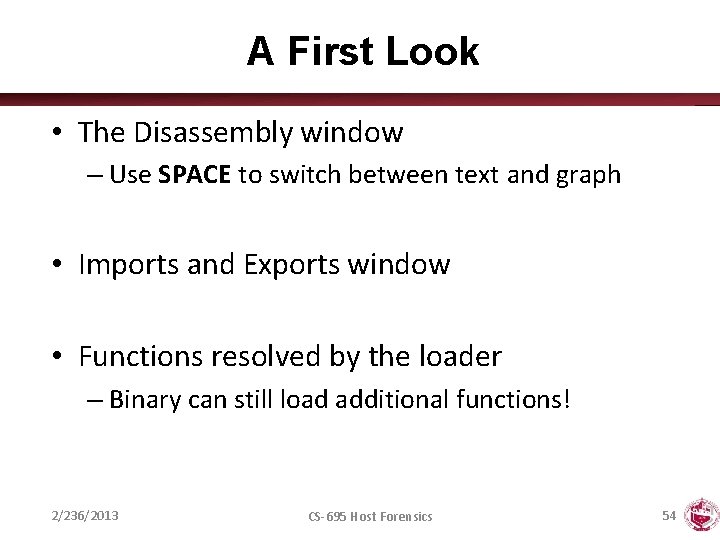
A First Look • The Disassembly window – Use SPACE to switch between text and graph • Imports and Exports window • Functions resolved by the loader – Binary can still load additional functions! 2/236/2013 CS-695 Host Forensics 54

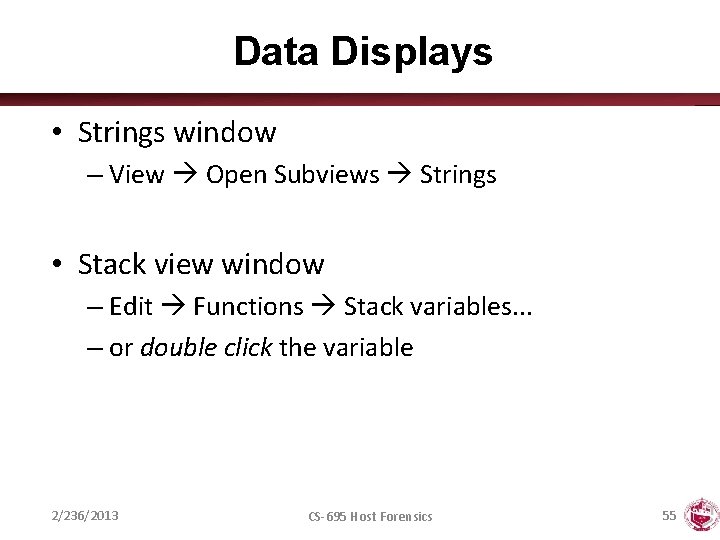
Data Displays • Strings window – View Open Subviews Strings • Stack view window – Edit Functions Stack variables. . . – or double click the variable 2/236/2013 CS-695 Host Forensics 55

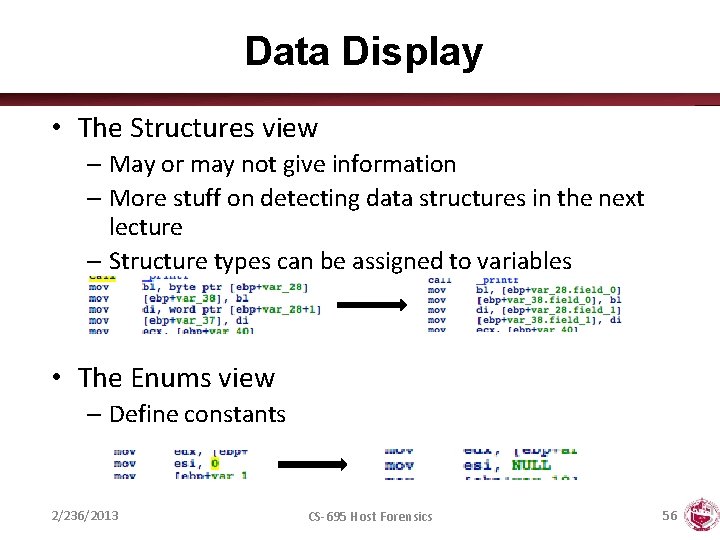
Data Display • The Structures view – May or may not give information – More stuff on detecting data structures in the next lecture – Structure types can be assigned to variables • The Enums view – Define constants 2/236/2013 CS-695 Host Forensics 56

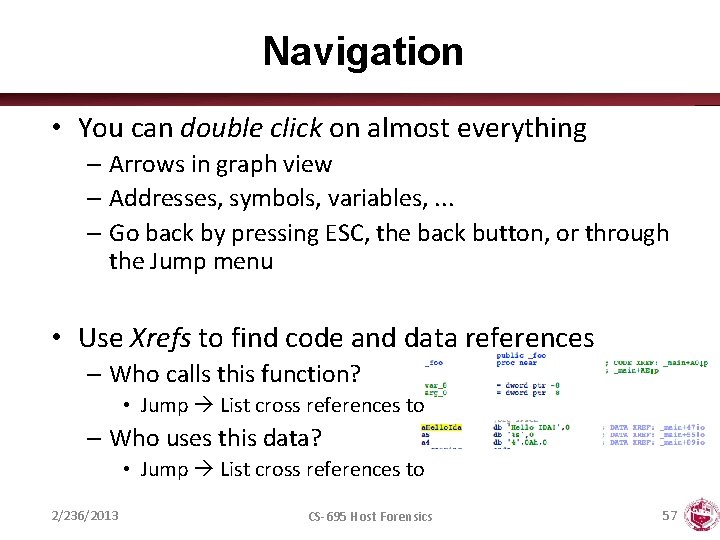
Navigation • You can double click on almost everything – Arrows in graph view – Addresses, symbols, variables, . . . – Go back by pressing ESC, the back button, or through the Jump menu • Use Xrefs to find code and data references – Who calls this function? • Jump List cross references to – Who uses this data? • Jump List cross references to 2/236/2013 CS-695 Host Forensics 57

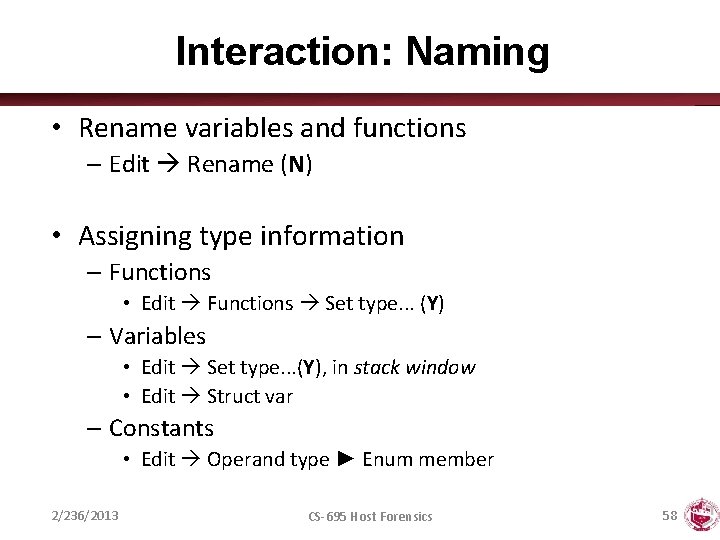
Interaction: Naming • Rename variables and functions – Edit Rename (N) • Assigning type information – Functions • Edit Functions Set type. . . (Y) – Variables • Edit Set type. . . (Y), in stack window • Edit Struct var – Constants • Edit Operand type ► Enum member 2/236/2013 CS-695 Host Forensics 58

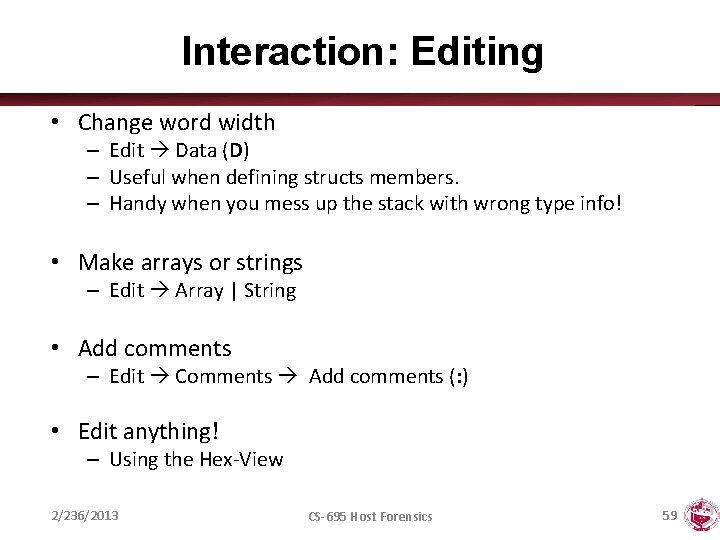
Interaction: Editing • Change word width – Edit Data (D) – Useful when defining structs members. – Handy when you mess up the stack with wrong type info! • Make arrays or strings – Edit Array | String • Add comments – Edit Comments Add comments (: ) • Edit anything! – Using the Hex-View 2/236/2013 CS-695 Host Forensics 59

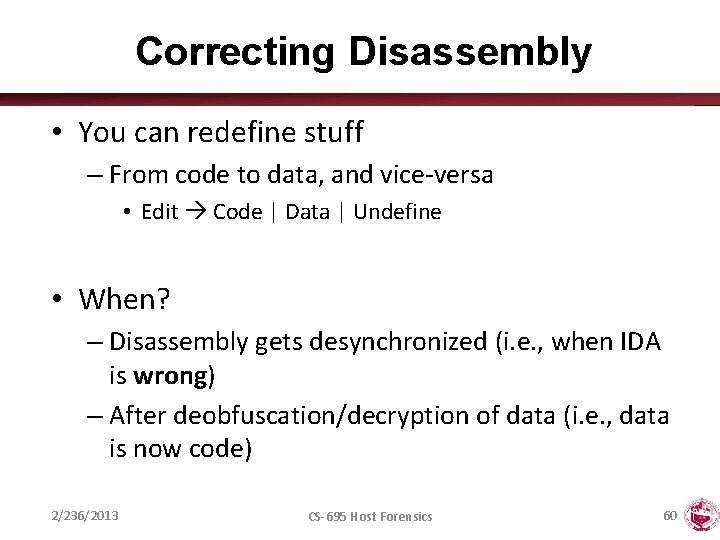
Correcting Disassembly • You can redefine stuff – From code to data, and vice-versa • Edit Code | Data | Undefine • When? – Disassembly gets desynchronized (i. e. , when IDA is wrong) – After deobfuscation/decryption of data (i. e. , data is now code) 2/236/2013 CS-695 Host Forensics 60

More Information https: //www. hex-rays. com 2/236/2013 CS-695 Host Forensics 61

DYNAMIC ANALYSIS 2/236/2013 CS-695 Host Forensics 62

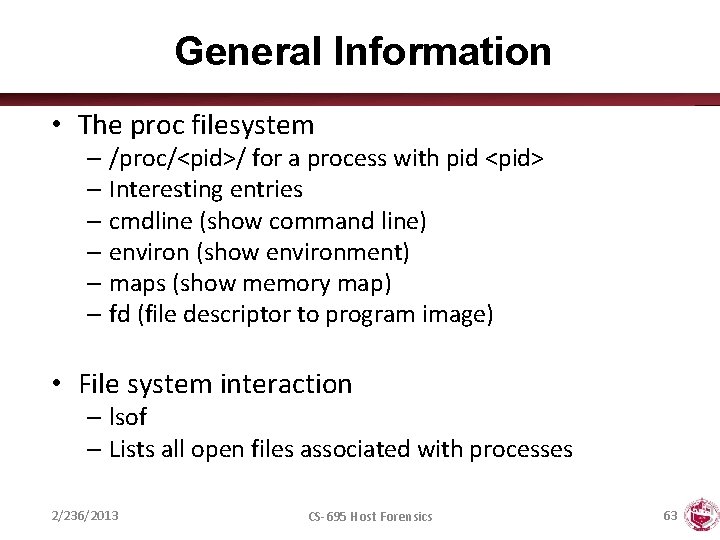
General Information • The proc filesystem – /proc/<pid>/ for a process with pid <pid> – Interesting entries – cmdline (show command line) – environ (show environment) – maps (show memory map) – fd (file descriptor to program image) • File system interaction – lsof – Lists all open files associated with processes 2/236/2013 CS-695 Host Forensics 63

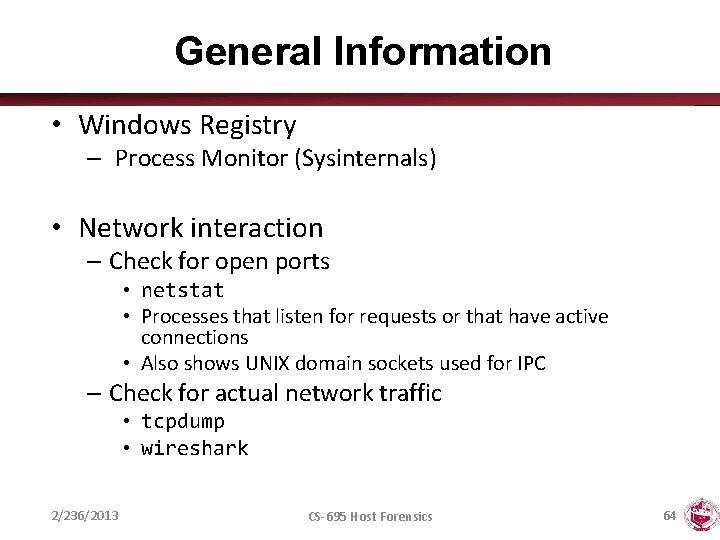
General Information • Windows Registry – Process Monitor (Sysinternals) • Network interaction – Check for open ports • netstat • Processes that listen for requests or that have active connections • Also shows UNIX domain sockets used for IPC – Check for actual network traffic • tcpdump • wireshark 2/236/2013 CS-695 Host Forensics 64

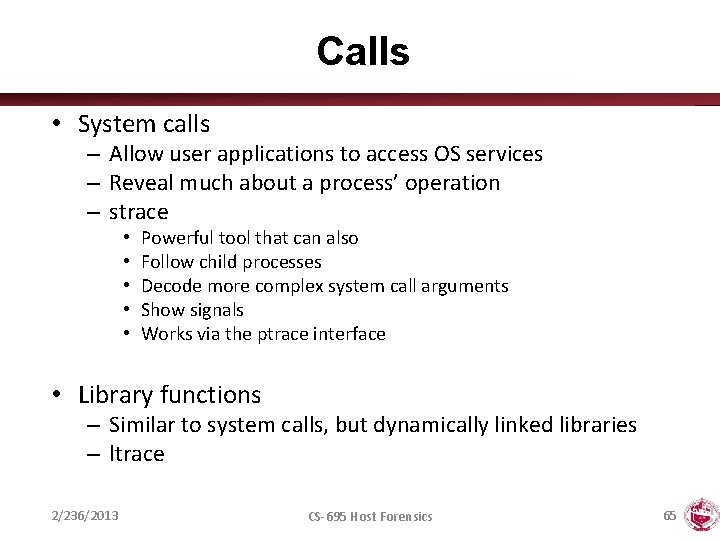
Calls • System calls – Allow user applications to access OS services – Reveal much about a process’ operation – strace • • • Powerful tool that can also Follow child processes Decode more complex system call arguments Show signals Works via the ptrace interface • Library functions – Similar to system calls, but dynamically linked libraries – ltrace 2/236/2013 CS-695 Host Forensics 65

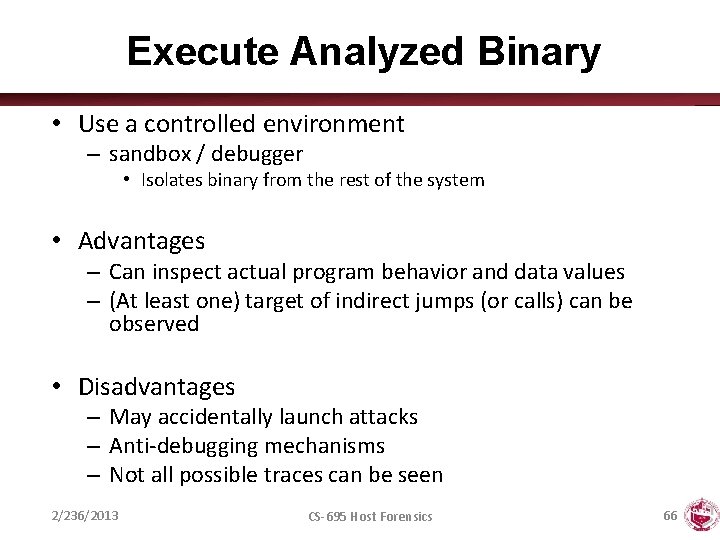
Execute Analyzed Binary • Use a controlled environment – sandbox / debugger • Isolates binary from the rest of the system • Advantages – Can inspect actual program behavior and data values – (At least one) target of indirect jumps (or calls) can be observed • Disadvantages – May accidentally launch attacks – Anti-debugging mechanisms – Not all possible traces can be seen 2/236/2013 CS-695 Host Forensics 66

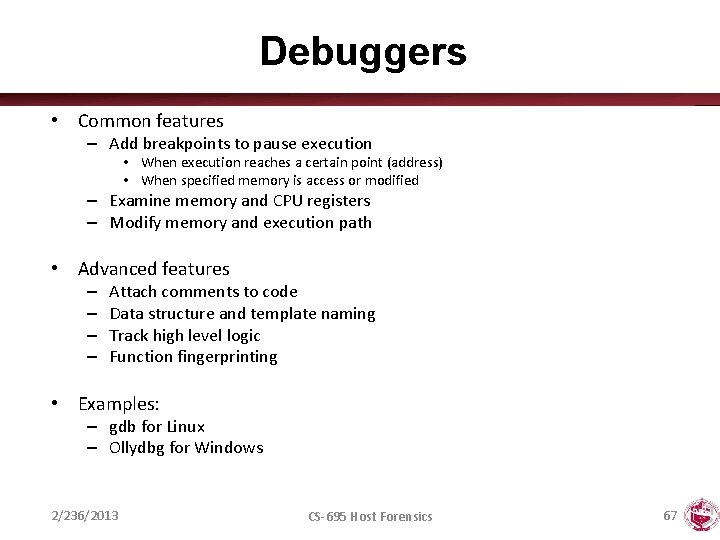
Debuggers • Common features – Add breakpoints to pause execution • When execution reaches a certain point (address) • When specified memory is access or modified – Examine memory and CPU registers – Modify memory and execution path • Advanced features – – Attach comments to code Data structure and template naming Track high level logic Function fingerprinting • Examples: – gdb for Linux – Ollydbg for Windows 2/236/2013 CS-695 Host Forensics 67

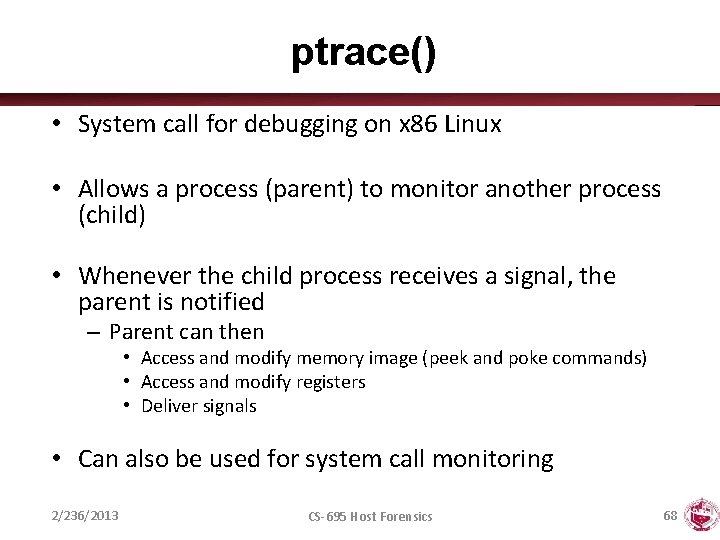
ptrace() • System call for debugging on x 86 Linux • Allows a process (parent) to monitor another process (child) • Whenever the child process receives a signal, the parent is notified – Parent can then • Access and modify memory image (peek and poke commands) • Access and modify registers • Deliver signals • Can also be used for system call monitoring 2/236/2013 CS-695 Host Forensics 68

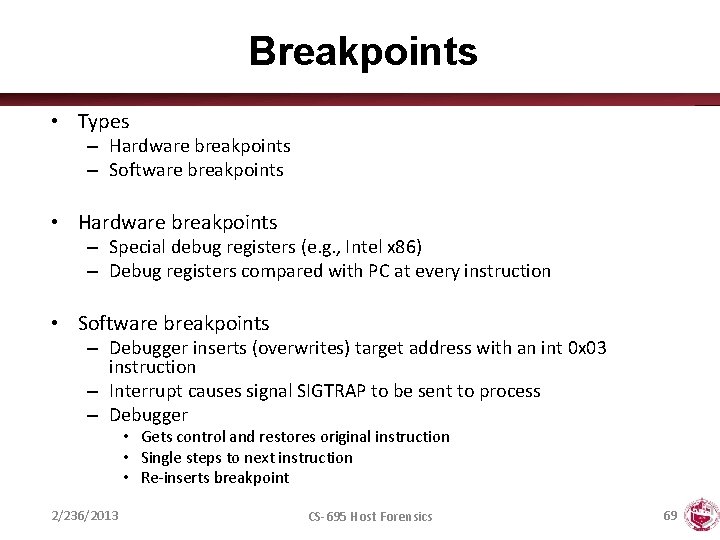
Breakpoints • Types – Hardware breakpoints – Software breakpoints • Hardware breakpoints – Special debug registers (e. g. , Intel x 86) – Debug registers compared with PC at every instruction • Software breakpoints – Debugger inserts (overwrites) target address with an int 0 x 03 instruction – Interrupt causes signal SIGTRAP to be sent to process – Debugger • Gets control and restores original instruction • Single steps to next instruction • Re-inserts breakpoint 2/236/2013 CS-695 Host Forensics 69

CHALLENGES 2/236/2013 CS-695 Host Forensics 70

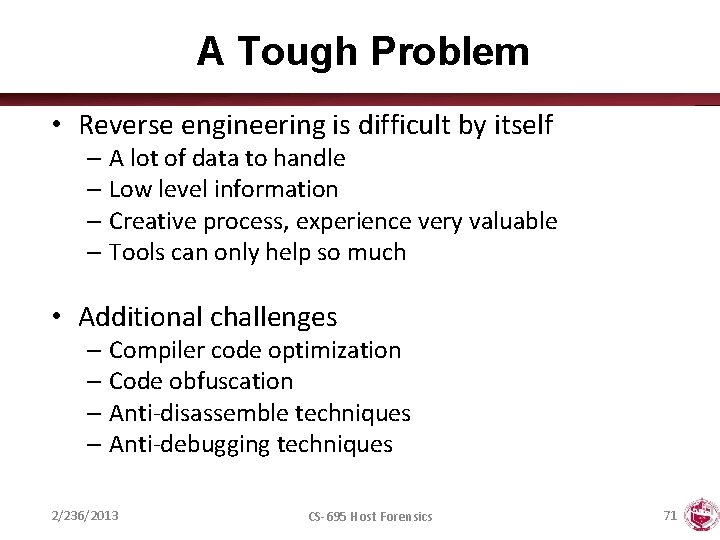
A Tough Problem • Reverse engineering is difficult by itself – A lot of data to handle – Low level information – Creative process, experience very valuable – Tools can only help so much • Additional challenges – Compiler code optimization – Code obfuscation – Anti-disassemble techniques – Anti-debugging techniques 2/236/2013 CS-695 Host Forensics 71

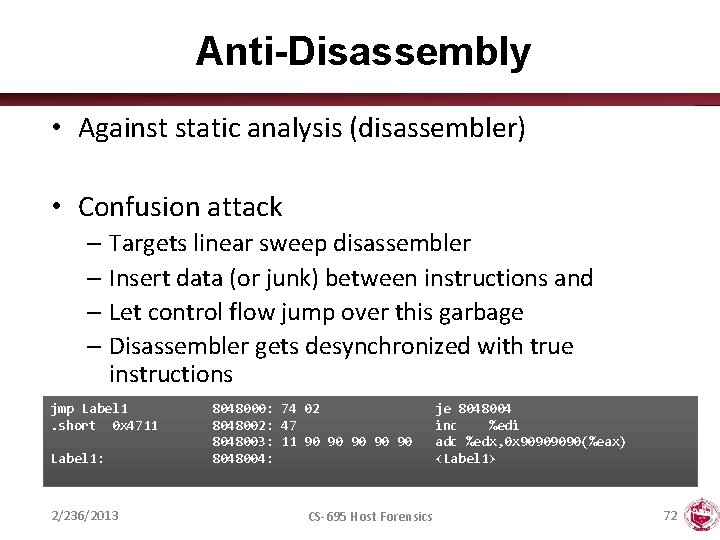
Anti-Disassembly • Against static analysis (disassembler) • Confusion attack – Targets linear sweep disassembler – Insert data (or junk) between instructions and – Let control flow jump over this garbage – Disassembler gets desynchronized with true instructions jmp Label 1. short 0 x 4711 Label 1: 2/236/2013 8048000: 74 02 8048002: 47 8048003: 11 90 90 90 8048004: CS-695 Host Forensics je 8048004 inc %edi adc %edx, 0 x 9090(%eax) <Label 1> 72

Anti-Assembly • Advanced confusion attack – Targets recursive traversal disassembler – Replace direct jumps (calls) by indirect ones (branch functions) – Force disassembler to revert to linear sweep, then use previous attack 2/236/2013 CS-695 Host Forensics 73

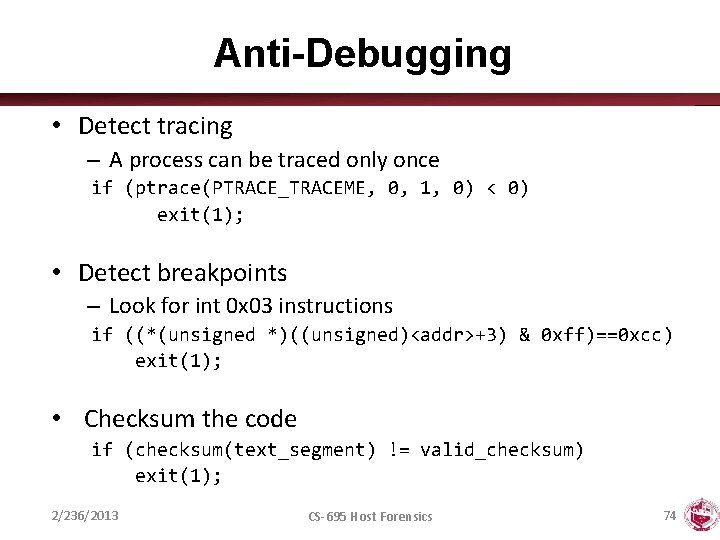
Anti-Debugging • Detect tracing – A process can be traced only once if (ptrace(PTRACE_TRACEME, 0, 1, 0) < 0) exit(1); • Detect breakpoints – Look for int 0 x 03 instructions if ((*(unsigned *)((unsigned)<addr>+3) & 0 xff)==0 xcc) exit(1); • Checksum the code if (checksum(text_segment) != valid_checksum) exit(1); 2/236/2013 CS-695 Host Forensics 74

2/236/2013 CS-695 Host Forensics 75