RELATIVE RISK AND ODDS RATIO Dr Kanhu Charan
![RELATIVE RISK AND ODDS RATIO Dr Kanhu Charan Patro MD, DNB[RADIATION ONCOLOGY], MBA, CEPC, RELATIVE RISK AND ODDS RATIO Dr Kanhu Charan Patro MD, DNB[RADIATION ONCOLOGY], MBA, CEPC,](https://slidetodoc.com/presentation_image_h2/4ab4e449144540b7d871b7b9b6717432/image-1.jpg)


![The formula-see the denominator [Number of events] [All outcomes i. e. , all events The formula-see the denominator [Number of events] [All outcomes i. e. , all events](https://slidetodoc.com/presentation_image_h2/4ab4e449144540b7d871b7b9b6717432/image-12.jpg)


![The mother[monster] in law 20 The mother[monster] in law 20](https://slidetodoc.com/presentation_image_h2/4ab4e449144540b7d871b7b9b6717432/image-20.jpg)


![The formula-see the denominator [Number of events] [All outcomes i. e. , all events The formula-see the denominator [Number of events] [All outcomes i. e. , all events](https://slidetodoc.com/presentation_image_h2/4ab4e449144540b7d871b7b9b6717432/image-46.jpg)


- Slides: 63
![RELATIVE RISK AND ODDS RATIO Dr Kanhu Charan Patro MD DNBRADIATION ONCOLOGY MBA CEPC RELATIVE RISK AND ODDS RATIO Dr Kanhu Charan Patro MD, DNB[RADIATION ONCOLOGY], MBA, CEPC,](https://slidetodoc.com/presentation_image_h2/4ab4e449144540b7d871b7b9b6717432/image-1.jpg)
RELATIVE RISK AND ODDS RATIO Dr Kanhu Charan Patro MD, DNB[RADIATION ONCOLOGY], MBA, CEPC, PDCR HOD, Radiation Oncology MGCHRI, Visakhapatnam, INDIA drkcpatro@gmail. com M +91 9160470564 1

Disclaimer • I am not a statistician • I know what we should know 2

Sorry note 3

4

What is causation? It indicates that one event is the result of the occurrence of the other event; i. e. , there is a causal relationship between the two events. This is also referred to as cause and effect. ” 5

Measures of association A measure of association quantifies the relationship between exposure and disease among the two groups. Positive association and Negative association. 6

Examples of outcome measurement • Risk ratio (relative risk) • Rate ratio • Odds ratio • Proportionate mortality ratio • Many more. 7

Rate /ratio/proportion • Ratio • Just ratio of two things • Proportion • Numerator included in denominator • Rate • Proportion relative to time 8

The contingency table 9

My topic • Odds ratio • Relative risk • Correlation 10

Types of study • Observational study • Case control study • Cohort study • Interventional study 11
![The formulasee the denominator Number of events All outcomes i e all events The formula-see the denominator [Number of events] [All outcomes i. e. , all events](https://slidetodoc.com/presentation_image_h2/4ab4e449144540b7d871b7b9b6717432/image-12.jpg)
The formula-see the denominator [Number of events] [All outcomes i. e. , all events + no events] • OR- Odds Ratio • RR - Relative Risk/Risk ratio [Number of events] [Number of no events] 12

Risk vs ODD Risk ODD 13

Risk vs ODD Risk ODD 14

Risk vs ODD Risk ODD 15

Risk vs ODD Risk ODD 16

Invited the risk 17

Dating 18

The risk 19
![The mothermonster in law 20 The mother[monster] in law 20](https://slidetodoc.com/presentation_image_h2/4ab4e449144540b7d871b7b9b6717432/image-20.jpg)
The mother[monster] in law 20

The odd 21

Relative risk When the relative causes the risk 22

The Causative factor 23

24

Mother in law vs monster in law 25

The counselor 26

ONE BAD NEWS ONE GOOD NEWS 27

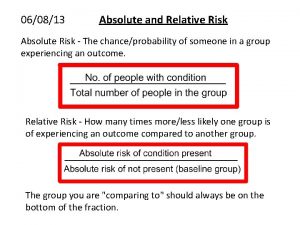
Relative risk Incidence of outcome in exposed cohort Incidence in unexposed cohort 28

Interpreting relative risk • If the risk ratio is 1 (or close to 1), it suggests no difference or little difference in risk (incidence in each group is the same). • No association • A risk ratio > 1 suggests an increased risk of that outcome in the exposed group. • Positive association, increased risk • A risk ratio < 1 suggests a reduced risk in the exposed group. • Negative association, decreased risk 29

Fighting incidence when mother in law as exposure Mother in law Fighting Yes No Relative risk 45 10 No Fighting 55 90 Total 100 0. 45/0. 1 = 4. 5 45/100 = 0. 39 10/100=0. 1 In this study persons who has having mother in law as relative there is 4. 5 times higher the risk of fighting between couples THE BAD NEWS 30

Fighting incidence when you follow mother in law advice Follow Mother in law Yes No Relative risk Fighting No Fighting 5 20 20 5 20/80 =0. 4 5/25 = 20% 20/25 =80% In this study persons who regularly following mother in law advice there is 0. 4 times the risk of fighting between couples compared to who dose not follow THE GOOD NEWS 31

How to explain? • As percentage increase and decrease • As number of times increase and decrease 32

Relative risk 1. 37 means • Risk of disease increased by 37% • RRR= [1 -RR] X 100 • Risk of disease increased by 1. 37 times 33

Relative risk 0. 8 means • Risk of disease decreased by 20% • RRR= [1 -RR] X 100 • Risk of disease less by 0. 2 times 34

Relative risk 3. 37 means • Risk of disease increased by 237% • RRR= [1 -RR] X 100 • Risk of disease increased by 3. 37 times 35

How strong is the association • If p value is more than 0. 05 • If confidence interval includes 1 • RR is not statically significant • No matter how is the large or small RR 36

RR >1 37

RR <1 38

Odds ratio odds of exposure in those with disease odds of exposure in those with out disease 39

Fighting incidence when mother in law as exposure Mother in law Fighting Yes No Odds ratio 45 10 No Fighting 55 90 Total 100 0. 82/0. 11 = 7. 45 45/55 = 0. 82 10/90=0. 11 In this study persons who has having mother in law as relative there is 7. 45 times of odd fighting between couples 40

Fighting incidence when you follow mother in law advice Follow Mother in law Fighting No Fighting Yes 5 20 5/20 = 0. 25 No 14 11 14/11 =1. 27 odd 0. 25/1. 27 =0. 2 In this study persons who regularly following mother in law advice there is 0. 2 times the risk of fighting between couples compared to who dose not follow 41

OR < 1 42

Interpreting odds ratio • If the odds ratio is 1 (or close to 1), it suggests no difference or little difference in risk • No change in frequency of exposure • A odds ratio > 1 suggests an increased risk of that outcome in the exposed group. • Increased change in frequency of exposure • A odds ratio < 1 suggests a reduced risk in the exposed group. • Decreased change in frequency of exposure 43

Interpreting odds ratio • An OR of 1. 2 means there is a 20% increase in the odds of an outcome with a given exposure. • An OR of 2 means there is a 100% increase in the odds of an outcome with a given exposure • A RR of 0. 5 means the risk is cut in half • An odds ratio of 1. 33 means that in one group the outcome is 33% more likely • A odds ratio is 1. 24, the likelihood of having the outcome is 24% higher (1. 24 – 1 = 0. 24 i. e. 24%) than the comparison group. • If odds ratio is 2. 5, then there is a 2. 5 times higher likelihood of having the outcome compared to the comparison group 44

How strong is the association • If p value is more than 0. 05 • If confidence interval includes 1 • OR is not statically significant • No matter how is the large or small OR 45
![The formulasee the denominator Number of events All outcomes i e all events The formula-see the denominator [Number of events] [All outcomes i. e. , all events](https://slidetodoc.com/presentation_image_h2/4ab4e449144540b7d871b7b9b6717432/image-46.jpg)
The formula-see the denominator [Number of events] [All outcomes i. e. , all events + no events] • OR- Odds Ratio • RR - Relative Risk/Risk ratio [Number of events] [Number of no events] 46

See the denominator Relative Risk Odds Ratio A=1 B=2 1/3 = 0. 33 A=1 B=2 1/2 = 0. 5 A=5 B=2 5/7 = 0. 49 A=5 B=2 5/2 = 2. 5 A A+B A B 47

OR overestimates the risk • 80/100 people who use it get cancer. • 20/100 who don’t use it get cancer. • The risk of getting cancer is 4 times greater in drug users. • RR = 0. 8/0. 2 = 4 • Note how distorted the OR becomes in this example. • OR = (80/20)/(20/80) = 16 48

Rare outcome • 5/1000 get cancer with drug vs 2. 5/1000 for non-users. • RR = 2. • OR = 2 as well (actually 2. 005) • With rare outcomes, the RR and OR are very similar 49

50

The difference 1. The basic difference is that the odds ratio is a ratio of two odds whereas the relative risk is a ratio of two probabilities. 2. The general rule though is that if the prevalence of the disease is <10% or so, the relative risk and the odds ratio will be approximately the same. 3. The rarer the disease, the closer the approximation. 4. RR has a more natural interpretation but cannot be calculated from a cross-sectional and case-control study 51

OR vs RR 52

The outcome measures • The outcome measure in cohort studies is usually a risk ratio / relative risk (RR). • The main outcome measure in case-control studies is odds ratio (OR). • Calculation of risk requires the use of “people at risk” as the denominator. • In retrospective (case-control) studies, where the total number of exposed people is not available, RR cannot be calculated and OR is used as a measure of the strength of association between exposure and outcome. • By contrast, in prospective studies (cohort studies), where the number at risk (number exposed) is available, either RR or OR can be calculated 53

Type of studies • Retrospective • Case control • Cohort • Prospective • Cohort 54

The CASE CONTROL study 55

The COHORT study 56

57

Case control study example • Food poisoning after eating restaurant • To find the association • You are doing retrospective study • You are doing a study where all are exposed. • Not true population • You calculate Odds ratio 58

Cohort study example • Smoking and lung cancer • To find the association • You are doing prospective study • You are doing a study where two types of population one is exposed another is control • True population • You calculate Relative Risk 59

Summary 60

61

When you follow the mother in law as relative in excess she becomes odd 62

AOGIN AUDIENCE 63
 Measures of association in epidemiology
 Relative risk dan odds ratio
 Relative risk dan odds ratio
 Rr statistics
 Discipline of the ram
 Shyamacharan lahiri
 Chaitanya charan das
 Relative risk calculation
 Attributable risk (ar)
 Population attributable risk adalah
 Diagnostic odds ratio
 Dimensi penelitian kuantitatif
 Odds ratio interprétation
 Odds ratio interprétation
 Odds ratio interprétation
 Riesgo relativo
 Razão de chance
 Calcular odds ratio
 Odds ratio
 Odds ratio
 How to calculate relative risk
 Absolute risk vs relative risk
 Market risk assessment
 Stage 15 relative clauses and relative pronouns
 The person who phoned me last night is my teacher.
 Relative pronouns examples
 What kingdom is considered the ods and ends kingdom?
 Scoring in netball odd and even
 Acid test ratio and quick ratio
 Dihybrid cross genotypic ratio
 Current ratio and quick ratio
 Conditional frequency
 Gripsholmsstenen
 Probability definition simple
 Haskell odds
 Apakah probabilitas sama dengan peluang
 Rule of odds
 Haskell odds
 The standard days method
 Nna odds
 Dice odds tft
 Unit 9 lesson 1
 Residual risk and secondary risk pmp
 Business risk vs financial risk capital structure
 Rir formula
 How to calculate relative risk
 Relative risk calculation
 How to find relative risk
 Interpreting relative risk
 Interpreting relative risk
 Fortune sithole
 Absolute risk reduction
 Number need to treat
 Prevalence rate formula
 Relative risk reduction formula
 Absolute risk formula
 Mechanical advantage of gears
 Secondary reinforcers
 Risk reward ratio
 What is risk projection in software engineering
 Risk avoidance
 Ar = ir x cr x dr
 Activity sheet 3: stock market calculations answer key
 Medium-term risk examples
