
Recent developments in diagnostic research Jos Kleijnen Diagnostic
- Slides: 40
Recent developments in diagnostic research Jos Kleijnen
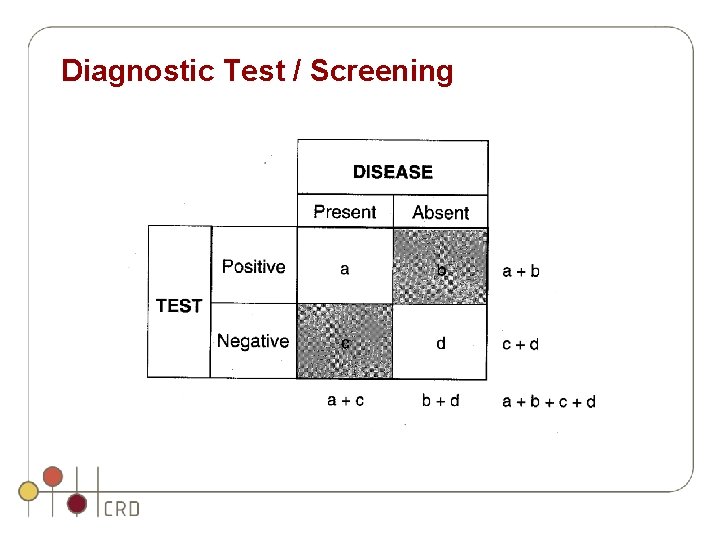
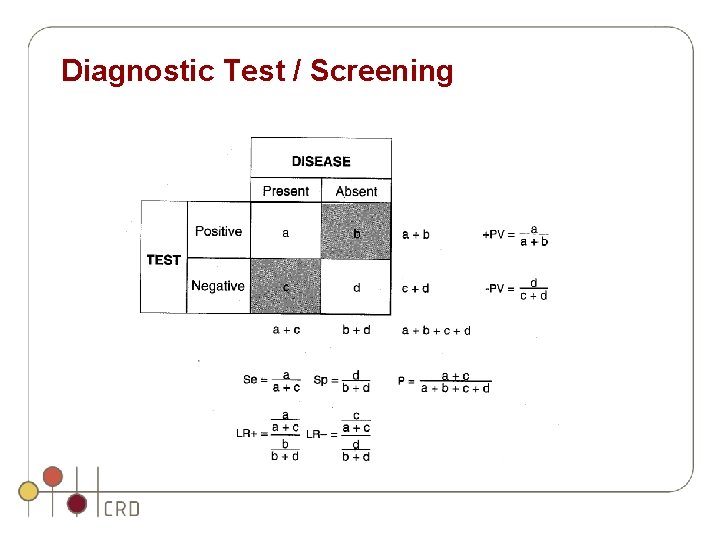
Diagnostic Test / Screening
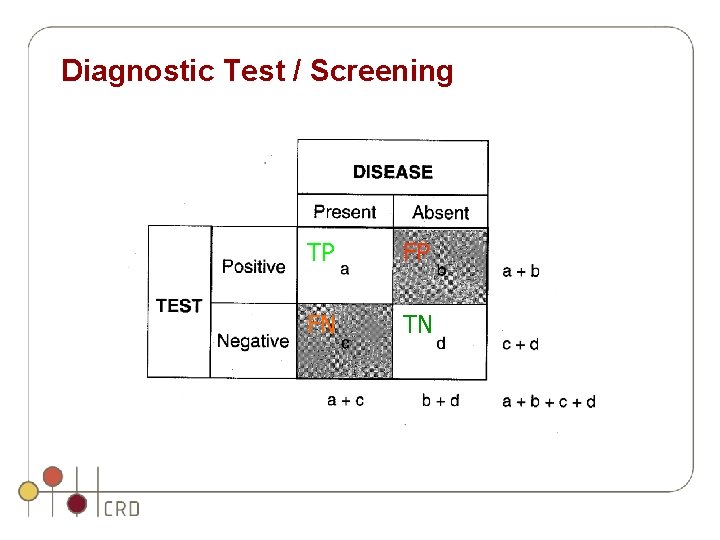
Diagnostic Test / Screening TP FP FN TN
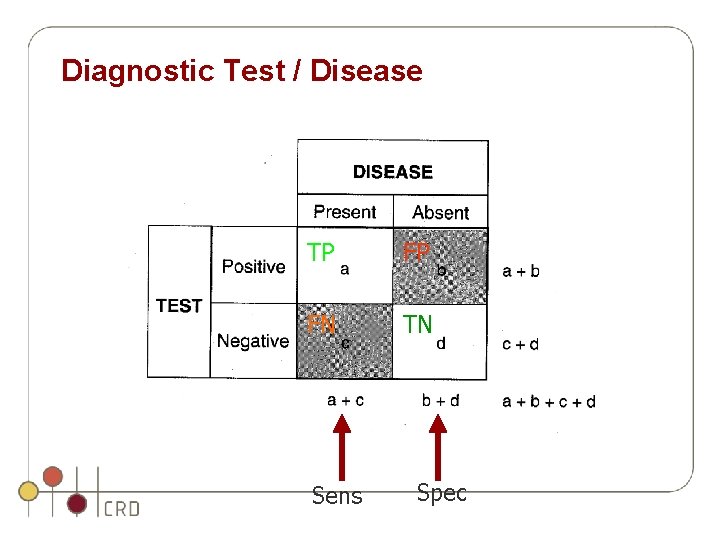
Diagnostic Test / Disease TP FP FN TN Sens Spec
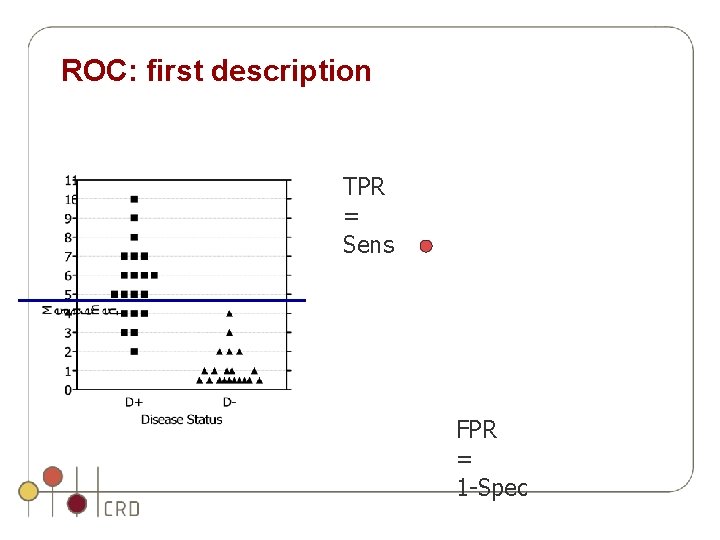
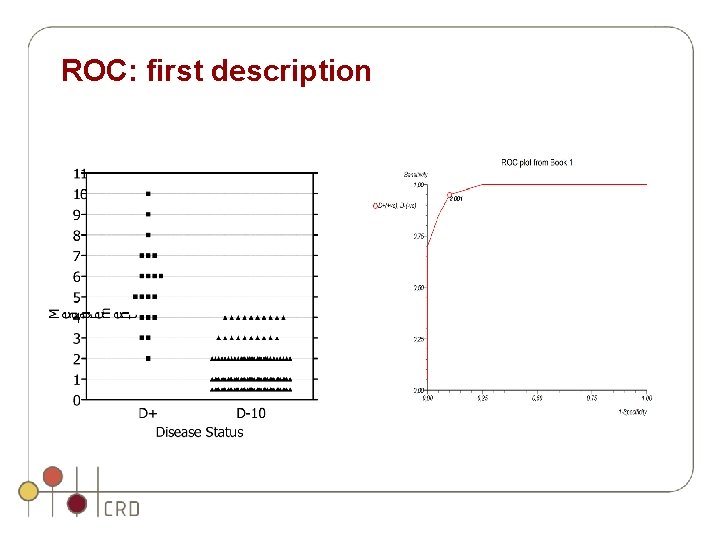
ROC: first description TPR = Sens FPR = 1 -Spec
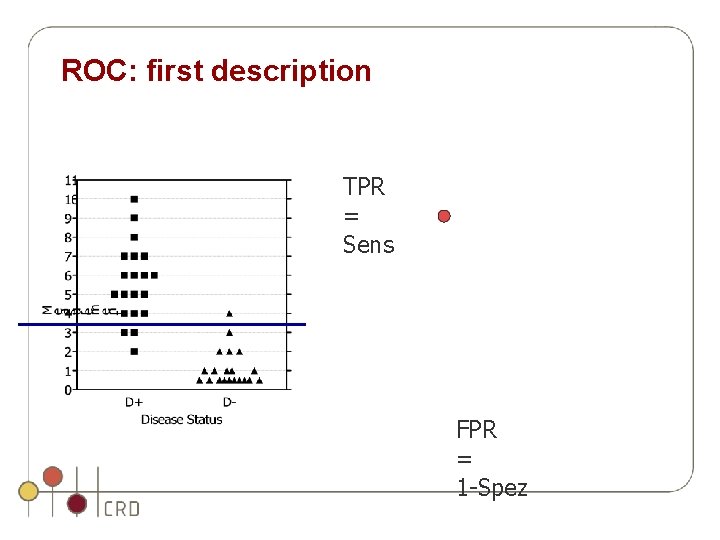
ROC: first description TPR = Sens FPR = 1 -Spez
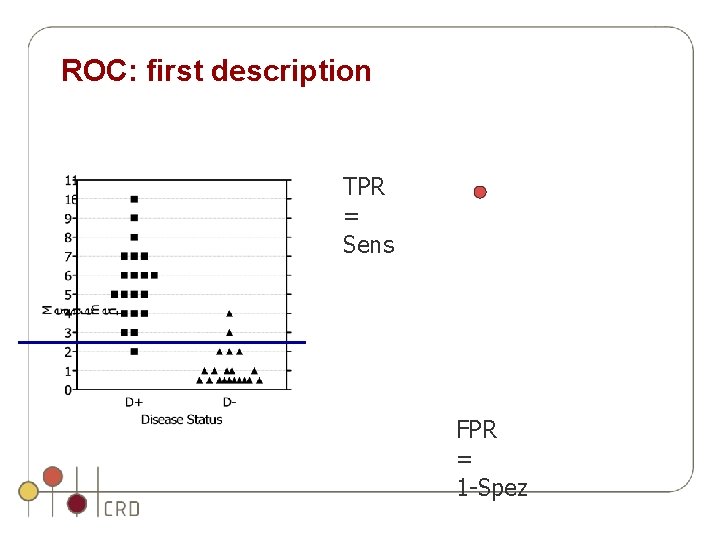
ROC: first description TPR = Sens FPR = 1 -Spez
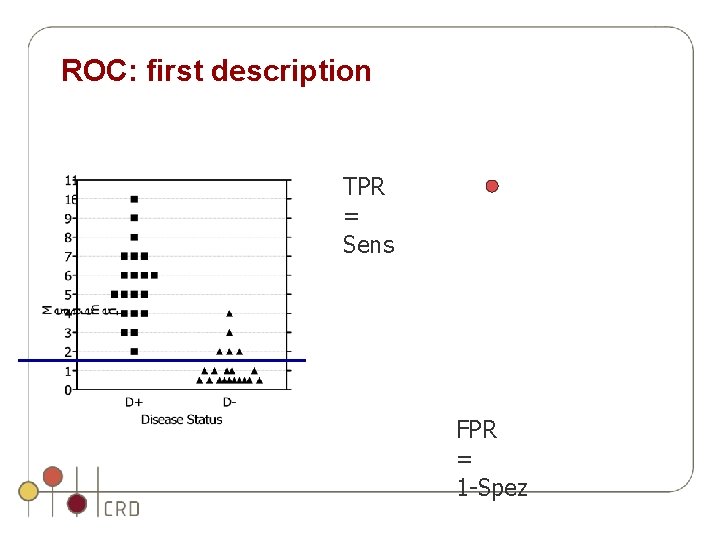
ROC: first description TPR = Sens FPR = 1 -Spez
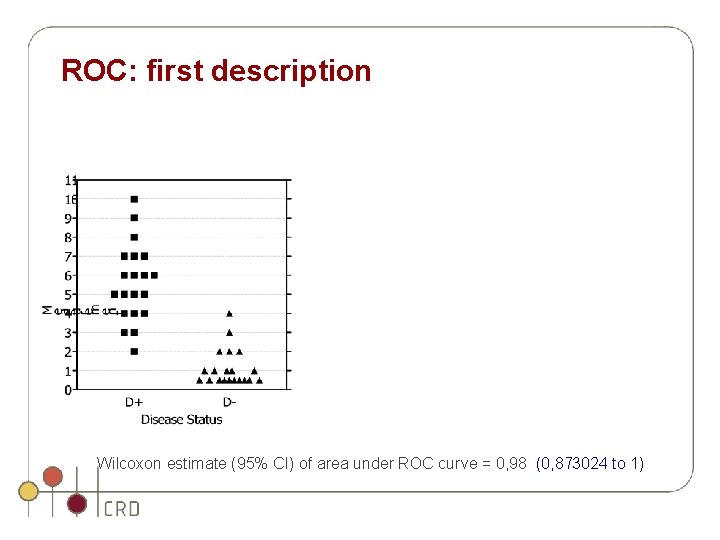
ROC: first description Wilcoxon estimate (95% CI) of area under ROC curve = 0, 98 (0, 873024 to 1)
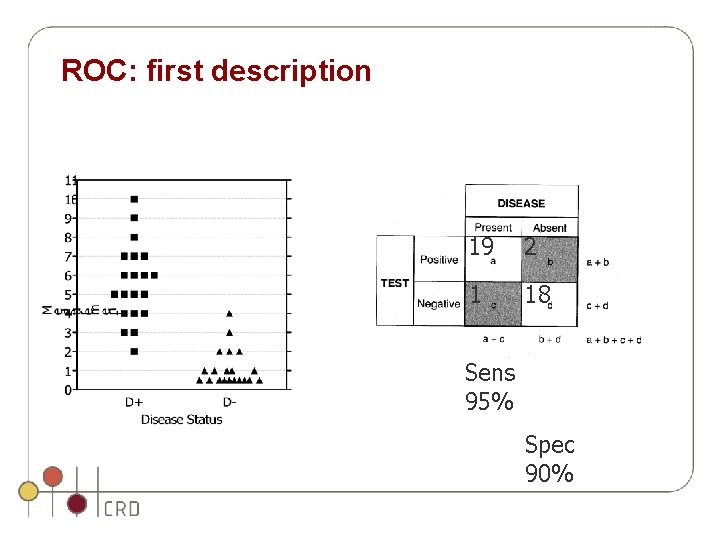
ROC: first description 19 2 1 18 Sens 95% Spec 90%
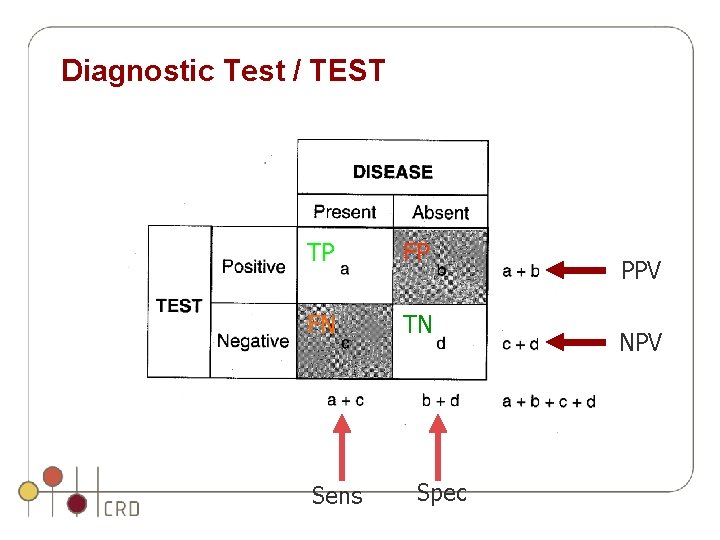
Diagnostic Test / TEST TP FP FN TN Sens Spec PPV NPV
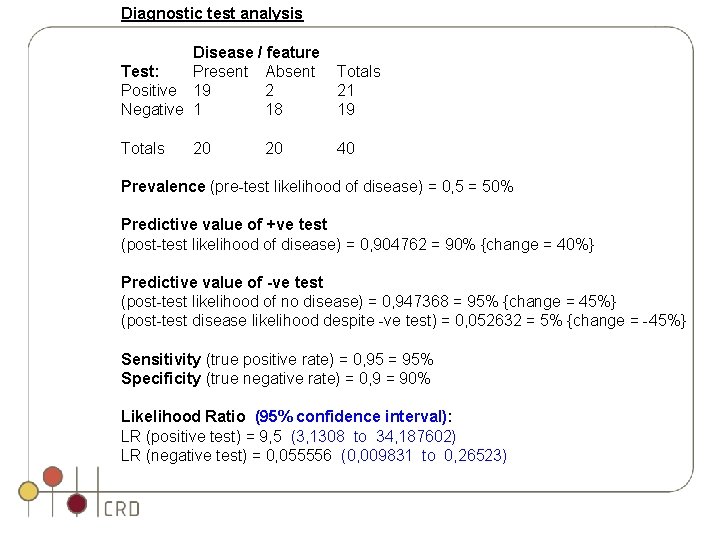
Diagnostic test analysis /h/1402/ Disease / feature Test: Present Absent Positive 19 2 Negative 1 18 Totals 21 19 Totals 40 20 20 Prevalence (pre-test likelihood of disease) = 0, 5 = 50% Predictive value of +ve test (post-test likelihood of disease) = 0, 904762 = 90% {change = 40%} Predictive value of -ve test (post-test likelihood of no disease) = 0, 947368 = 95% {change = 45%} (post-test disease likelihood despite -ve test) = 0, 052632 = 5% {change = -45%} Sensitivity (true positive rate) = 0, 95 = 95% Specificity (true negative rate) = 0, 9 = 90% Likelihood Ratio (95% confidence interval): LR (positive test) = 9, 5 (3, 1308 to 34, 187602) LR (negative test) = 0, 055556 (0, 009831 to 0, 26523)
Diagnostic Test / Screening
ROC: first description
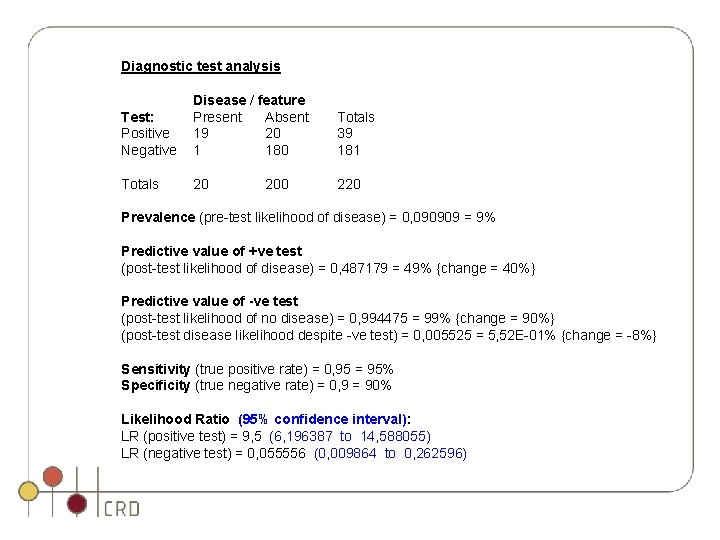
Diagnostic test analysis Test: Positive Negative Disease / feature Present Absent 19 20 1 180 Totals 39 181 Totals 20 200 Prevalence (pre-test likelihood of disease) = 0, 090909 = 9% Predictive value of +ve test (post-test likelihood of disease) = 0, 487179 = 49% {change = 40%} Predictive value of -ve test (post-test likelihood of no disease) = 0, 994475 = 99% {change = 90%} (post-test disease likelihood despite -ve test) = 0, 005525 = 5, 52 E-01% {change = -8%} Sensitivity (true positive rate) = 0, 95 = 95% Specificity (true negative rate) = 0, 9 = 90% Likelihood Ratio (95% confidence interval): LR (positive test) = 9, 5 (6, 196387 to 14, 588055) LR (negative test) = 0, 055556 (0, 009864 to 0, 262596)
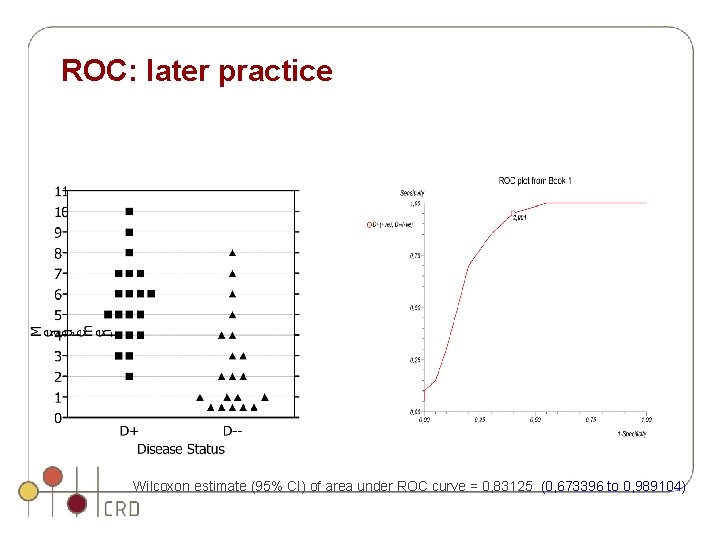
ROC: later practice Wilcoxon estimate (95% CI) of area under ROC curve = 0, 83125 (0, 673396 to 0, 989104)
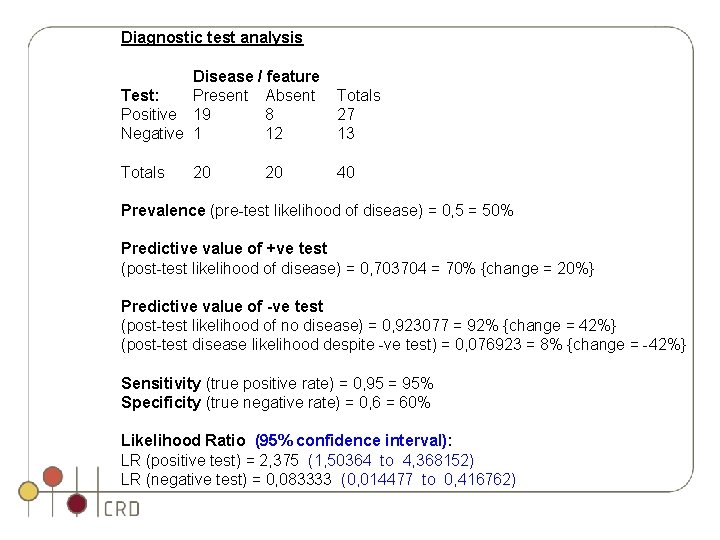
Diagnostic test analysis /h/1402/ Disease / feature Test: Present Absent Positive 19 8 Negative 1 12 Totals 27 13 Totals 40 20 20 Prevalence (pre-test likelihood of disease) = 0, 5 = 50% Predictive value of +ve test (post-test likelihood of disease) = 0, 703704 = 70% {change = 20%} Predictive value of -ve test (post-test likelihood of no disease) = 0, 923077 = 92% {change = 42%} (post-test disease likelihood despite -ve test) = 0, 076923 = 8% {change = -42%} Sensitivity (true positive rate) = 0, 95 = 95% Specificity (true negative rate) = 0, 6 = 60% Likelihood Ratio (95% confidence interval): LR (positive test) = 2, 375 (1, 50364 to 4, 368152) LR (negative test) = 0, 083333 (0, 014477 to 0, 416762)
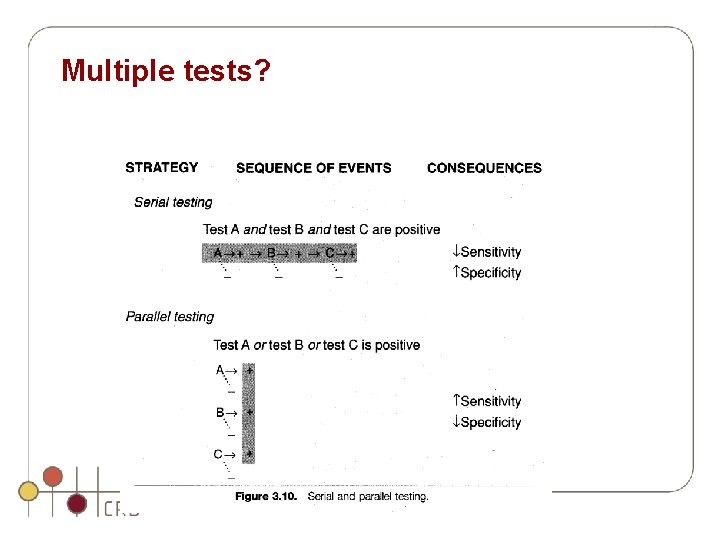
Multiple tests?
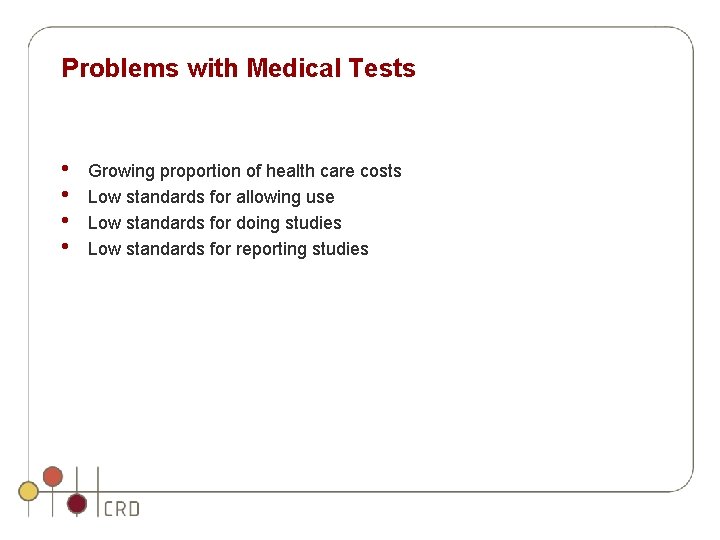
Problems with Medical Tests • • Growing proportion of health care costs Low standards for allowing use Low standards for doing studies Low standards for reporting studies
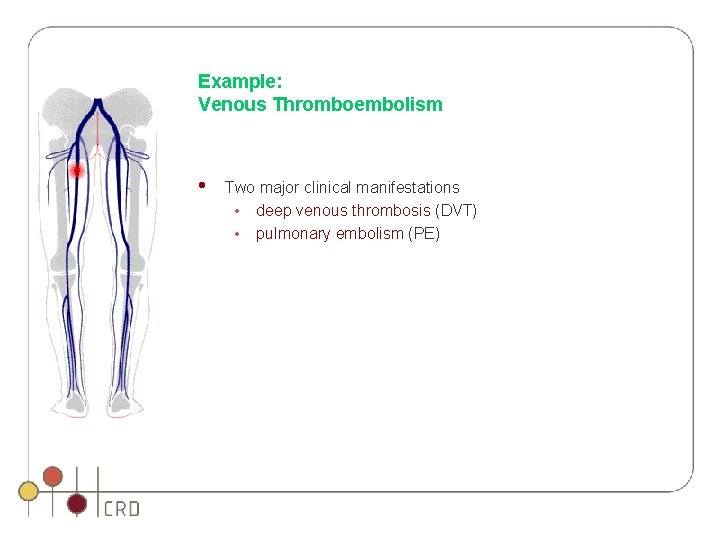
Example: Venous Thromboembolism • Two major clinical manifestations • deep venous thrombosis (DVT) • pulmonary embolism (PE)
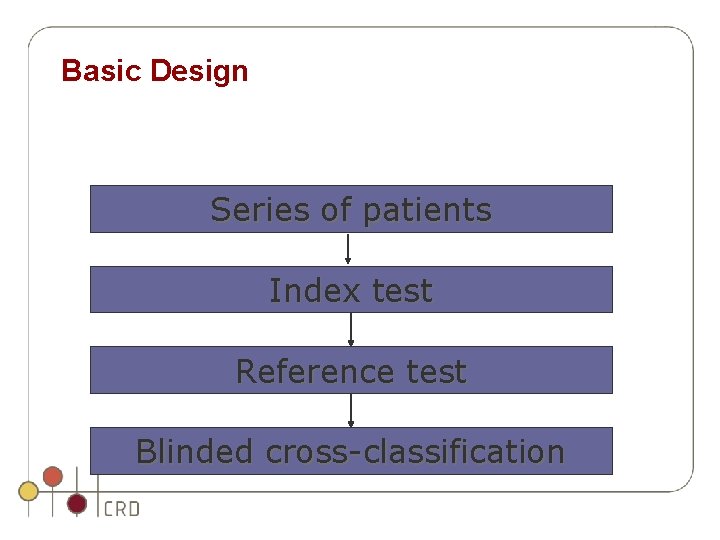
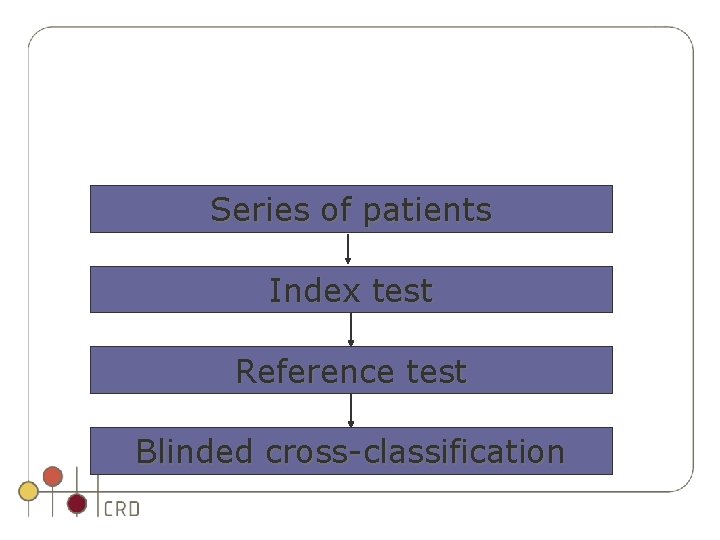
Basic Design Series of patients Index test Reference test Blinded cross-classification
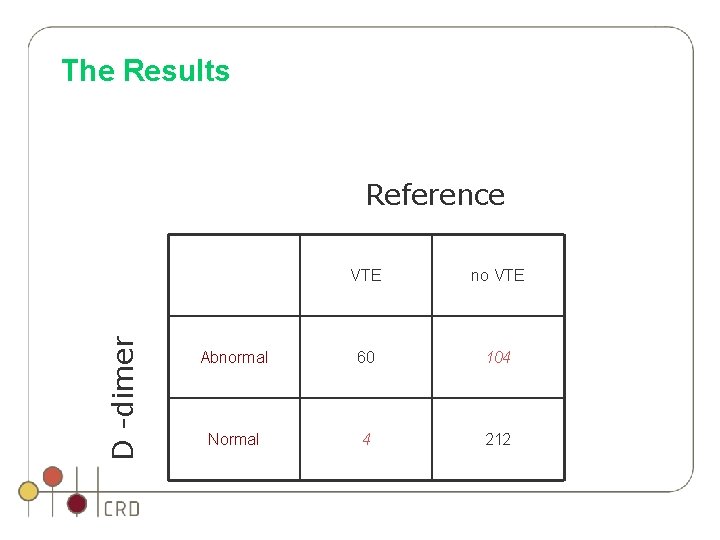
The Results D -dimer Reference VTE no VTE Abnormal 60 104 Normal 4 212
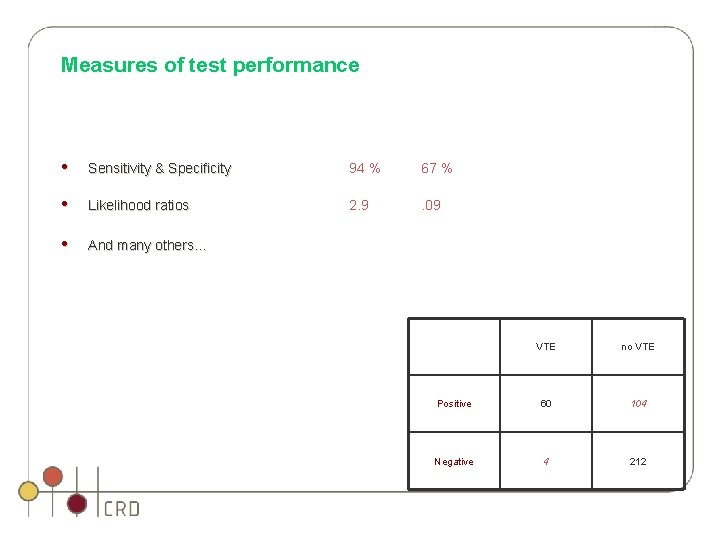
Measures of test performance • Sensitivity & Specificity 94 % 67 % • Likelihood ratios 2. 9 . 09 • And many others… VTE no VTE Positive 60 104 Negative 4 212
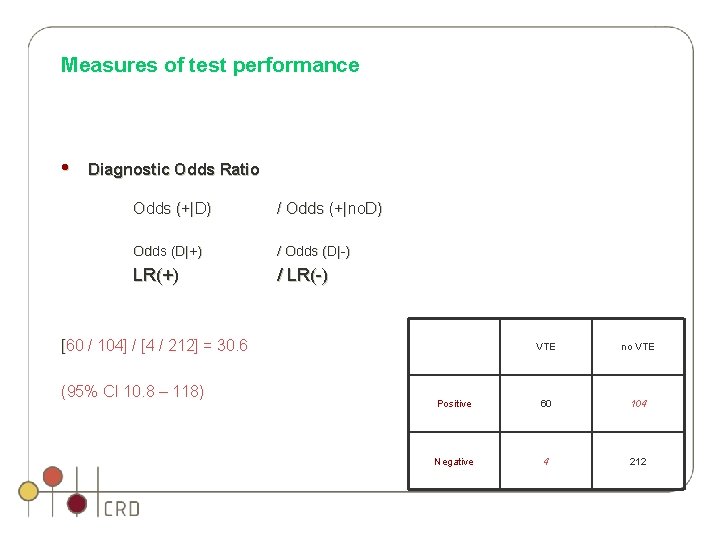
Measures of test performance • Diagnostic Odds Ratio Odds (+|D) / Odds (+|no. D) Odds (D|+) / Odds (D|-) LR(+) / LR(-) [60 / 104] / [4 / 212] = 30. 6 (95% CI 10. 8 – 118) VTE no VTE Positive 60 104 Negative 4 212
Series of patients Index test Reference test Blinded cross-classification
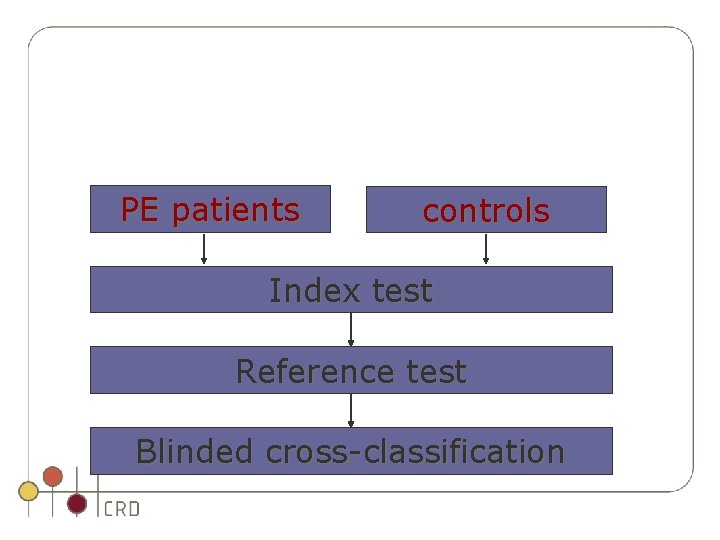
PE patients controls Index test Reference test Blinded cross-classification
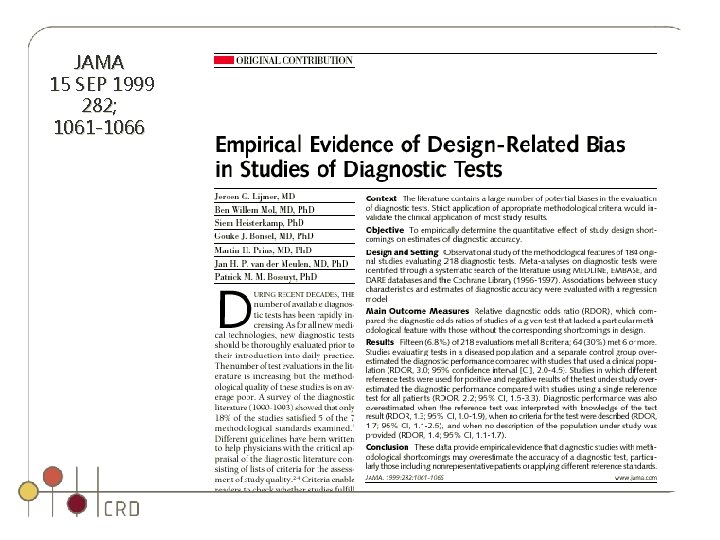
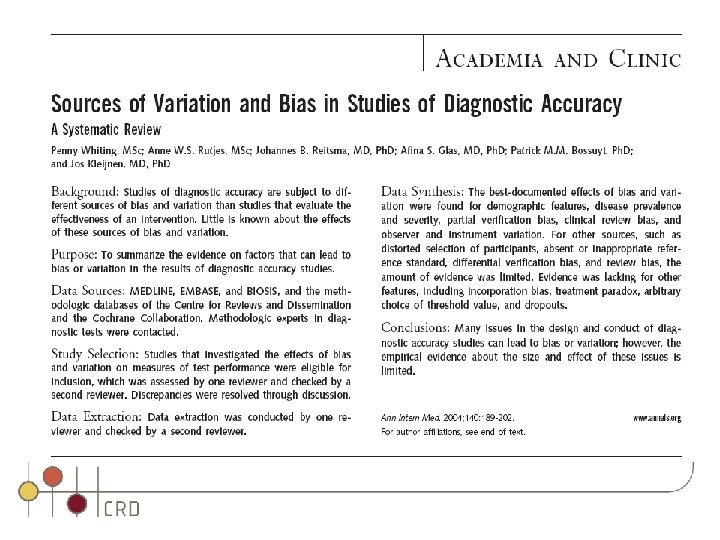
JAMA 15 SEP 1999 282; 1061 -1066
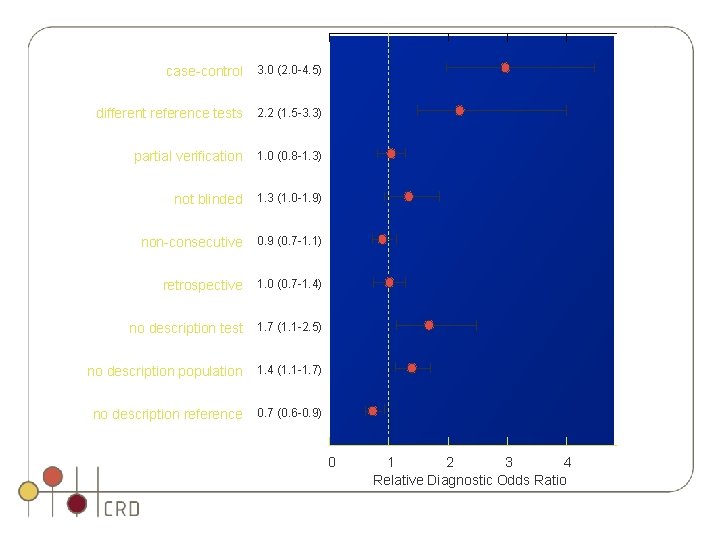
case-control 3. 0 (2. 0 -4. 5) different reference tests 2. 2 (1. 5 -3. 3) partial verification 1. 0 (0. 8 -1. 3) not blinded 1. 3 (1. 0 -1. 9) non-consecutive 0. 9 (0. 7 -1. 1) retrospective 1. 0 (0. 7 -1. 4) no description test 1. 7 (1. 1 -2. 5) no description population 1. 4 (1. 1 -1. 7) no description reference 0. 7 (0. 6 -0. 9) 0 1 2 3 4 Relative Diagnostic Odds Ratio
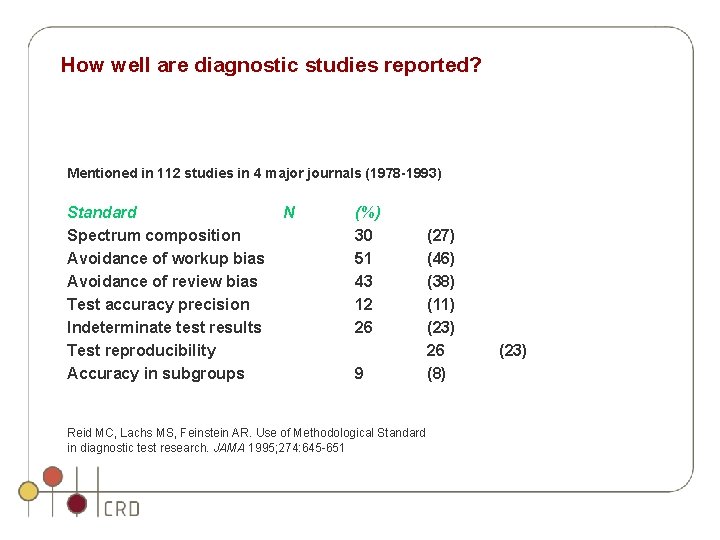
How well are diagnostic studies reported? Mentioned in 112 studies in 4 major journals (1978 -1993) Standard Spectrum composition Avoidance of workup bias Avoidance of review bias Test accuracy precision Indeterminate test results Test reproducibility Accuracy in subgroups N (%) 30 51 43 12 26 9 Reid MC, Lachs MS, Feinstein AR. Use of Methodological Standard in diagnostic test research. JAMA 1995; 274: 645 -651 (27) (46) (38) (11) (23) 26 (8) (23)
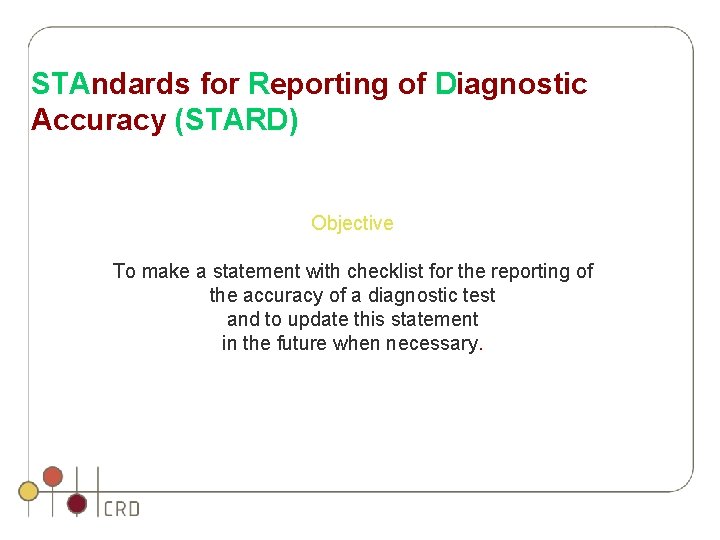
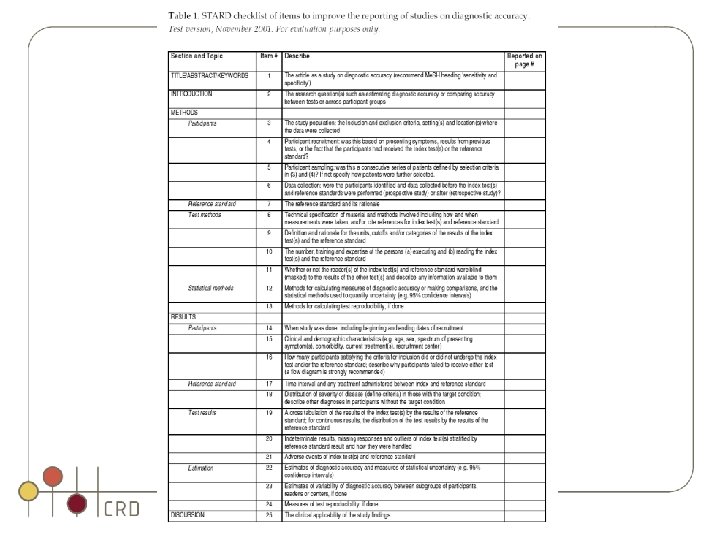
STAndards for Reporting of Diagnostic Accuracy (STARD) Objective To make a statement with checklist for the reporting of the accuracy of a diagnostic test and to update this statement in the future when necessary.
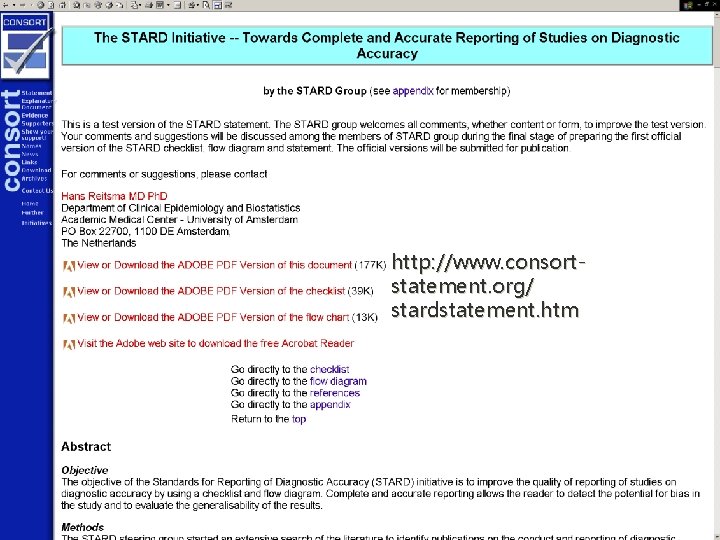
http: //www. consortstatement. org/ stardstatement. htm
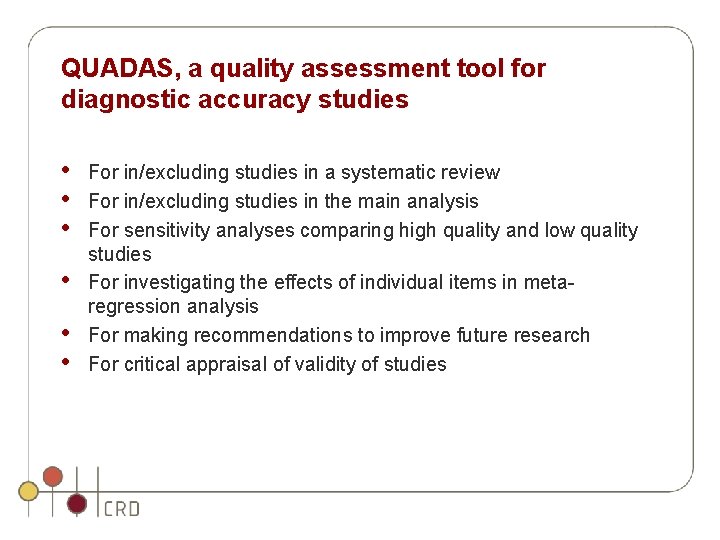
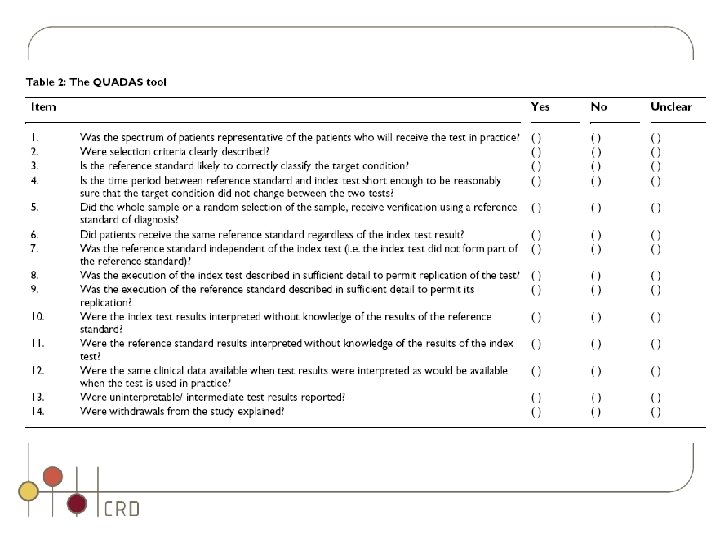
QUADAS, a quality assessment tool for diagnostic accuracy studies • • • For in/excluding studies in a systematic review For in/excluding studies in the main analysis For sensitivity analyses comparing high quality and low quality studies For investigating the effects of individual items in metaregression analysis For making recommendations to improve future research For critical appraisal of validity of studies
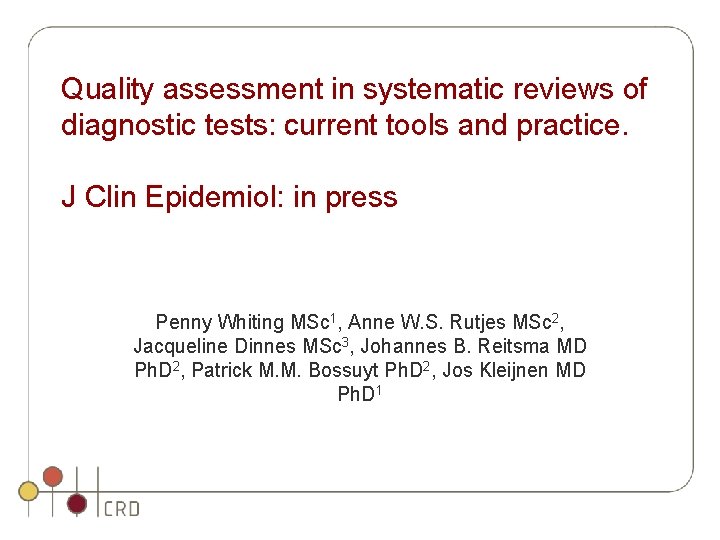
Quality assessment in systematic reviews of diagnostic tests: current tools and practice. J Clin Epidemiol: in press Penny Whiting MSc 1, Anne W. S. Rutjes MSc 2, Jacqueline Dinnes MSc 3, Johannes B. Reitsma MD Ph. D 2, Patrick M. M. Bossuyt Ph. D 2, Jos Kleijnen MD Ph. D 1
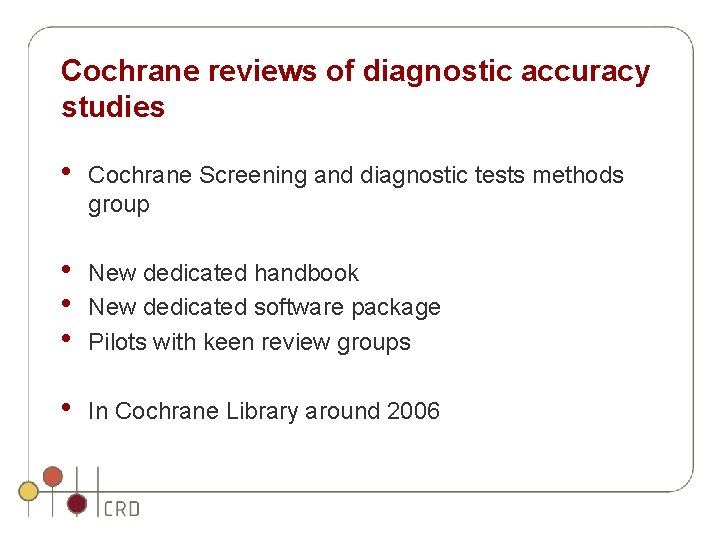
Cochrane reviews of diagnostic accuracy studies • Cochrane Screening and diagnostic tests methods group • • • New dedicated handbook New dedicated software package Pilots with keen review groups • In Cochrane Library around 2006
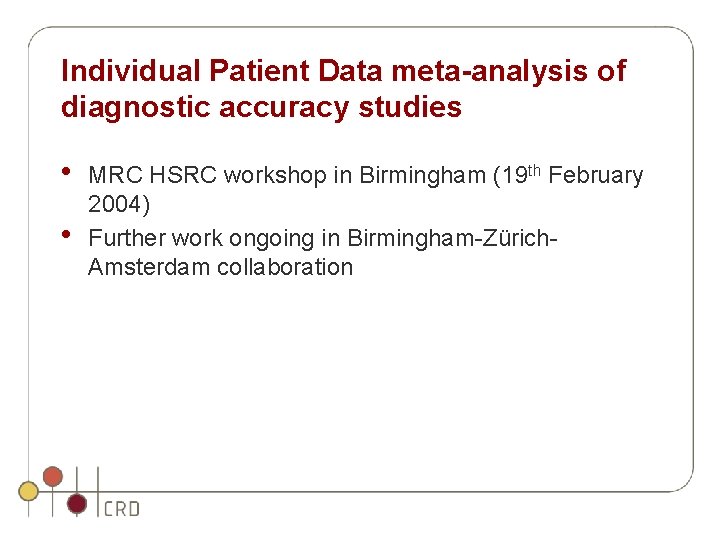
Individual Patient Data meta-analysis of diagnostic accuracy studies • • MRC HSRC workshop in Birmingham (19 th February 2004) Further work ongoing in Birmingham-Zürich. Amsterdam collaboration
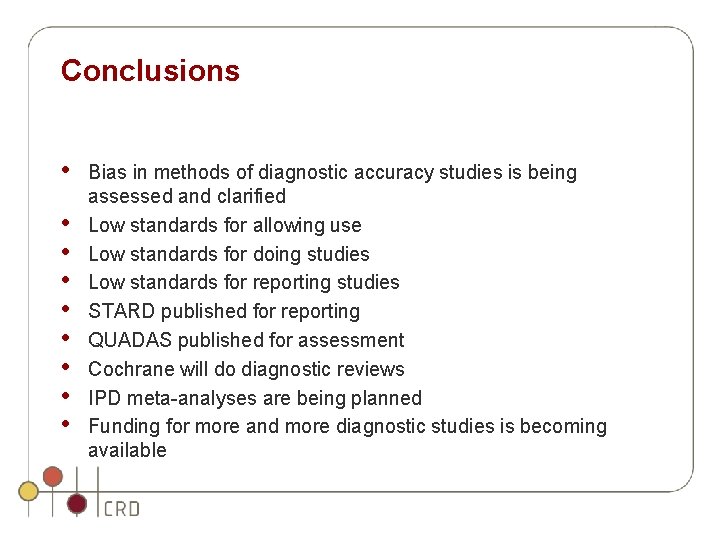
Conclusions • • • Bias in methods of diagnostic accuracy studies is being assessed and clarified Low standards for allowing use Low standards for doing studies Low standards for reporting studies STARD published for reporting QUADAS published for assessment Cochrane will do diagnostic reviews IPD meta-analyses are being planned Funding for more and more diagnostic studies is becoming available