14 odds 15 odds ratio 1 0 23

")
")
 ロジスティック関数 (logistic function) 0. 5 0.")


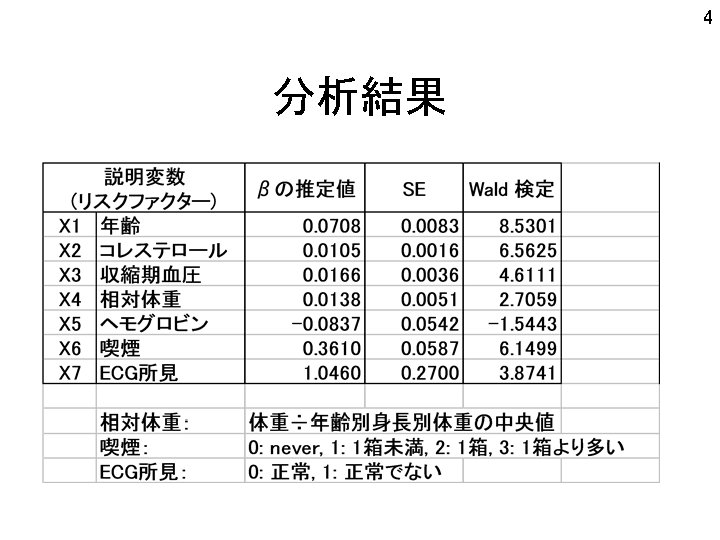
 Analysis of Maximum Likelihood Estimates Parameter Standard Wald Variable")


 0. 82 probit 0. 70 0.")
- Slides: 47
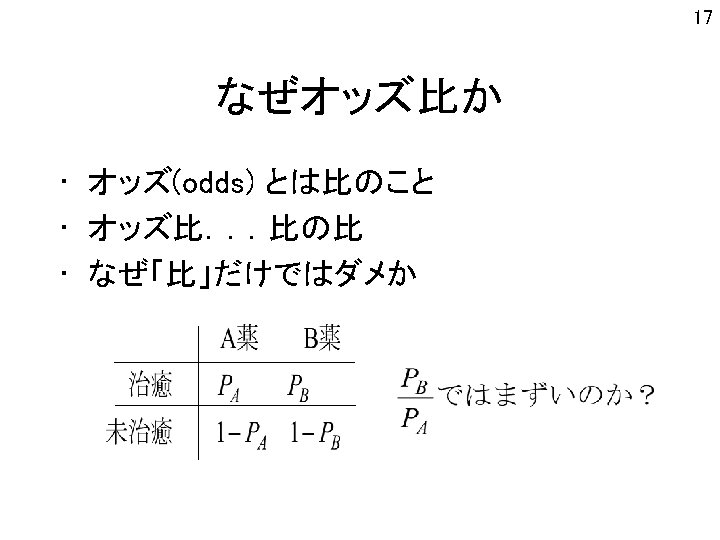
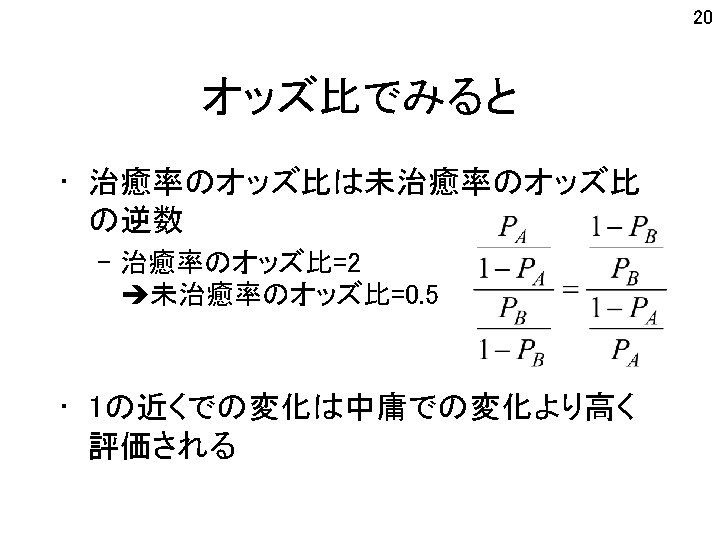
14 オッズ(odds)
15 オッズ比(odds ratio)
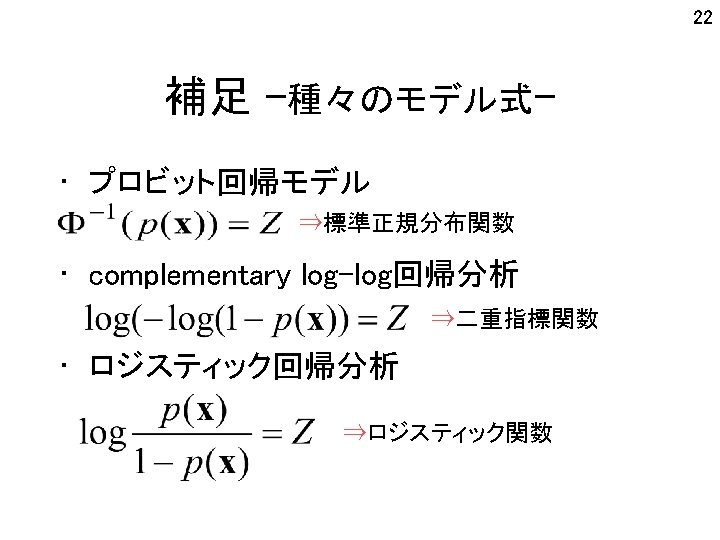
1. 0 23 p 二重指数関数 (double exponential function) ロジスティック関数 (logistic function) 0. 5 0. 0 Z 標準正規分布関数 (standardized normal distribution function) p: 確率値 Z: 変数の線形な合成変数
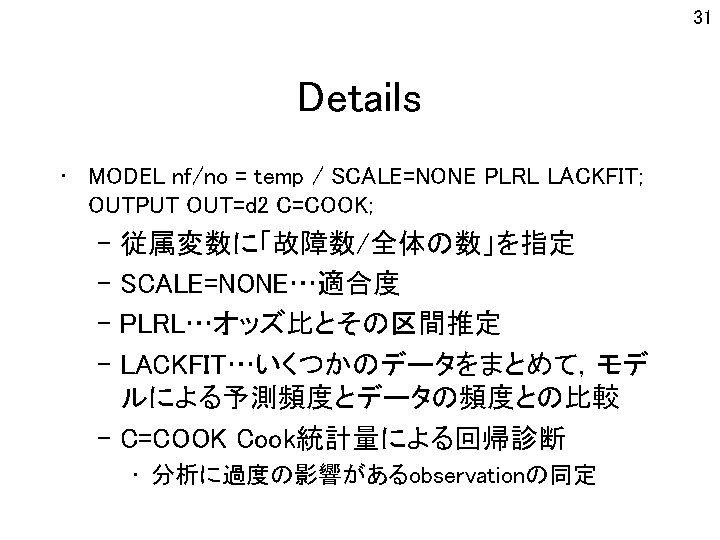
30 SASプログラム- proc logistic. OPTIONS NOCENTER PS=54 LS=90; DATA d 1; INPUT num nf no temp @@; CARDS; 1 6 11 16 21 2 0 0 6 6 6 53 78 75 72 70 2 7 12 17 22 0 1 0 0 0 6 6 66 57 79 76 73 3 8 13 18 23 0 0 1 0 0 6 6 68 67 58 81 76 4 9 14 19 1 0 0 1 6 6 70 69 67 63 ; PROC LOGISTIC DATA=d 1; MODEL nf/no = temp / SCALE=NONE COVB PLRL LACKFIT; OUTPUT OUT=d 2 C=COOK; PROC PRINT DATA=d 2; RUN; 5 10 15 20 0 1 0 0 6 6 75 70 70 67
33 SAS出力:適合度 ロジスティック関数と線型回帰モデルのよさを吟味 Deviance and Pearson Goodness-of-Fit Statistic Pr > Criterion DF Value/DF Chi-Square Deviance 21 18. 0863 0. 8613 Pearson 21 29. 9803 1. 4276 Number of events/trials observations: 23 0. 6435 0. 0924 モデルの適合度を調べる 統計量=デビアンス(のp値) 大きいほど良い
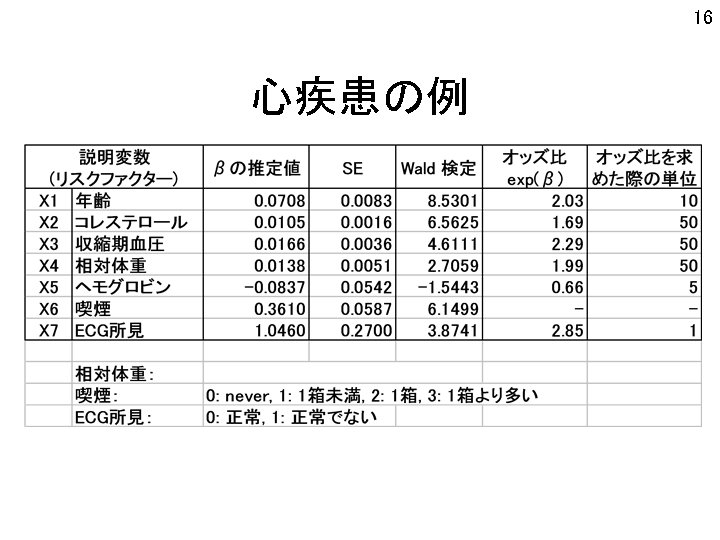
34 SAS出力:偏回帰係数 exp(-0. 1156) Analysis of Maximum Likelihood Estimates Parameter Standard Wald Variable DF Estimate Error Chi-Square INTERCPT 1 5. 0850 3. 0525 2. 7751 temp 1 -0. 1156 0. 0470 6. 0435 Pr > Standardized Odds Chi-Square Estimate Ratio 0. 0957. . 0. 0140 -0. 441494 0. 891 回帰式 Estimated Covariance Matrix Variable INTERCPT 9. 3176671947 TEMP -0. 142565536 TEMP -0. 142565536 0. 002211241
35 SAS出力:オッズ比の区間推定 Profile Likelihood Confidence Limits Variable temp Unit 1. 0000 Odds Ratio 0. 891 Lower 0. 809 Upper 0. 970
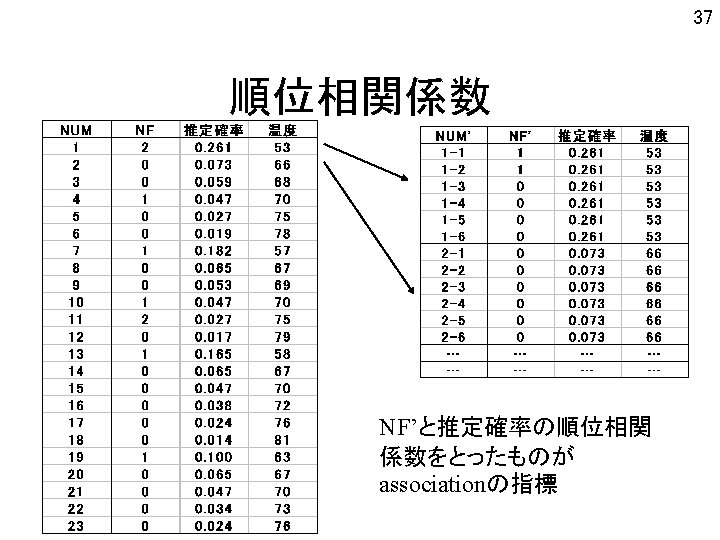
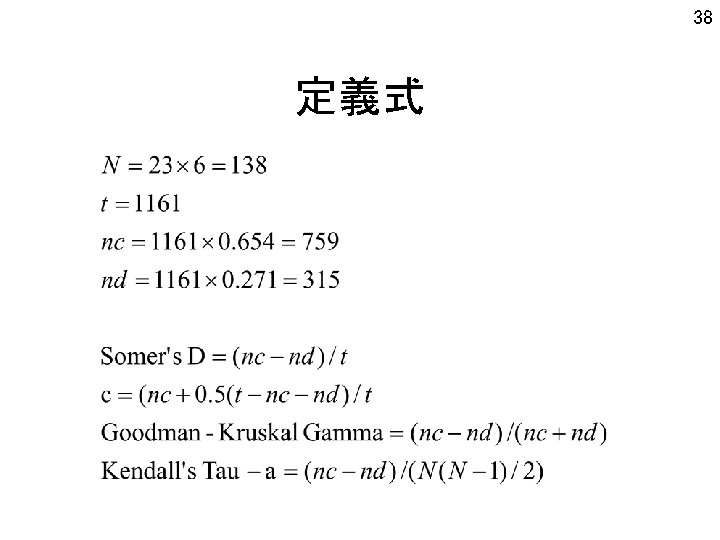
36 SAS出力:予測の「よさ」をみる Association of Predicted Probabilities and Observed Responses Concordant = 65. 4% Somers' D = 0. 382 Discordant = 27. 1% Gamma = 0. 413 Tied Tau-a = 0. 047 c = 0. 691 = (1161 pairs) 7. 5%
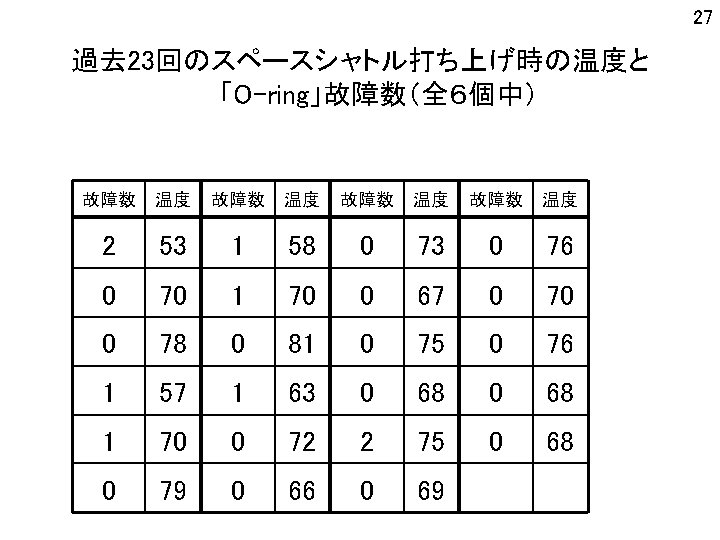
OBS 1 2 3 4 5 6 7 8 9 10 11 12 13 14 15 16 17 18 19 20 21 22 23 NUM 1 2 3 4 5 6 7 8 9 10 11 12 13 14 15 16 17 18 19 20 21 22 23 NF 2 0 0 1 2 0 1 0 0 0 0 NO 6 6 6 6 6 6 TEMP 53 66 68 70 75 78 57 67 69 70 75 79 58 67 70 72 76 81 63 67 70 73 76 COOK 0. 29503 0. 02790 0. 02110 0. 11088 0. 01097 0. 00799 0. 00340 0. 02395 0. 01894 0. 11088 1. 41421 0. 00712 0. 00002 0. 02395 0. 01721 0. 01443 0. 00993 0. 00555 0. 02428 0. 02395 0. 01721 0. 01322 0. 00993 39 COOKの統計量 • 当分析に対する影響度の大 きなobservation を同定する • No. 11 (t=75) は容疑者 • 分析者に都合のよいデータ 除去は,慎むべき
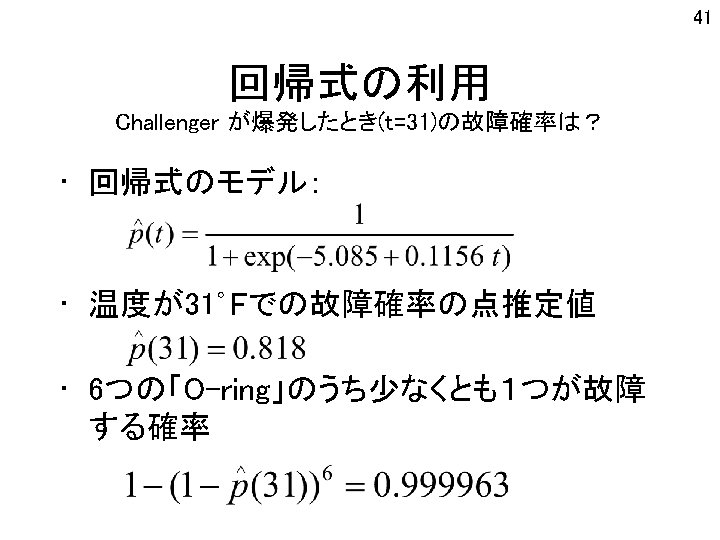
45 6個のうち少なくとも1つが 故障する確率 感度分析 表2.温度31 Fでの予測確率 Logistic p(31) 0. 82 probit 0. 70 0. 97 0. 12 -0. 99 0. 19 -1. 000 95% CI 0. 16 -0. 99 Pr(少 1|6) 1. 000 0. 999 0. 65 -1. 00 0. 54 -1. 00 95% CI comp. log-log 0. 71 -1. 00