Presenters Stephen Haskins Adam Edmonds Philip Halsmer Kwan


/engine) 44.")


 were considered. �Avoid engine")
![BFL Constraint Crossplots d_to Crossplot, T/W =. 3 d_TO [ft] The W/S that violates](https://slidetodoc.com/presentation_image_h/951e793ce6a2f28e789bcc1a7d66f464/image-27.jpg "BFL Constraint Crossplots d_to Crossplot, T/W =. 3 d_TO [ft] The W/S that violates")
![Sizing Plot 237 W/S vs TOGW with Performance Constraints TOGW [1000 lbs] 232 T/W](https://slidetodoc.com/presentation_image_h/951e793ce6a2f28e789bcc1a7d66f464/image-28.jpg "Sizing Plot 237 W/S vs TOGW with Performance Constraints TOGW [1000 lbs] 232 T/W")


 � Sum of the subsonic parasite")

 �Double Slotted Flaps �CLmax �Cruise: . 95")


 �Wing, Horizontal Tail and Vertical tail")


 Total Direct Operating Cost Variable Cost")


- Slides: 68
Presenters: Stephen Haskins Adam Edmonds Philip Halsmer Kwan Chan Tyler Hall Sirisha Bandla Chris Mueller Jeff Intagliata Shaun Hunt 1
Outline �Mission Statement and Design Mission �Best Aircraft Selection �Aircraft Sizing, Carpet Plots, and Performance �Aerodynamic Design Details 2
Mission Statement �Bring aircraft developments into the modern age of environmental awareness by means of innovative design and incorporating the next generation of technologies and configurations to meet NASA’s ERA N+2 guidelines. �Reduce operating cost in face of rising fuel prices and consumer pressures to reduce fares. New ERA Technologies 3
Compliance Matrix *Boeing 777200 LR NASA Goals Compliance Target Threshold Take-off (Nox (g/kg_fuel)/engine) 44. 44 -75% 11. 11 -50% Climb-out (Nox (g/kg_fuel)/engine) 33. 85 -75% 8. 4 -50% Approach (Nox (g/kg_fuel)/engine) 15. 78 -75% 3. 9 -50% 5. 11 -75% 1. 2 -50% -60% 282. 10 -42 241. -20 Decreased 45. 2*** Fuel Performance (lb_pay. nm/lb_fuel) 2300. Increase 50% 2500. Increase 30% 2900. Take-Off length (ft) 11600. -50% 5800 <7800 Goals New Era **Emissions Indices (GE 90 -110 B 1) Idle (Nox (g/kg_fuel)/engine) -60% Noise (Overhead + Sideline + Approach) Overhead (d. B) 87. 50 Sideline (d. B) 96. 70 Approach (d. B) ***Total (d. B) *Project specific reference aircraft. 97. 9 **Relative to CAEP 6 ***Relative to Stage 4 4
Requirement Benchmarking Matrix Mission Specific Parameters Boeing 777 737 -9001 757 -2001 -200 LR 1 MD-831 A 3212002 A 330 Threshold 3002 Cruise Mach 0. 785 0. 76 0. 78 0. 82 >0. 7 Maximum Passenger Capacity 215 234 440 172 220 335 >200 MTOGW w/ 200 passengers (lb) 174200 255000 766000 160000 200000 460765 - Max Range at MTOGW w/ 200 pax (nm) *n/a 3600 9200 *n/a 2500 5800 >3500 Take-Off Length at Sea Level at MTOGW (ft) *n/a 9500 14200 *n/a 7500 6800 <7000 *cannot exceed 200 passengers w/o exceeding MTOGW 1 Courtesy 2 Courtesy of Boeing online documentation of Airbus online documentation
Design Mission Concept 1 Cruise > 0. 7 M Direct Descent Climb Loiter Design Range ≈ 3300 nmi <7000 ft Taxi and Take Off ≈ 200 nmi Land Taxi (0) -> (4) : ‘Basic Mission’ 1 Extrapolated Missed Approach Land Taxi (5) -> (9) : ‘Reserve Segments’ from Raymer, Daniel Aircraft Design: A Conceptual Approach Fig. 3. 2
Market Opportunity �Market niche � Creating an aircraft that can replace large portions of major airlines’ aging fleets such as MD-80, Boeing 757, 767 due to evolving market and economic needs � Potential customers include airlines such as Delta, American, and Continental 7
Target Markets �North America �Europe � Predicted second most in demand of new aircraft between 2010 -2029 *(7200 new a/c) � 78% of single aisle purchases are for airline fleet replacement � Single aisle a/c market is predicted to grow from 56% to 71% in next 20 years * Airlines in both the North American and European markets are looking for more fuel efficient and less pollutant a/c. � Predicted third most in demand of new aircraft between 2010 -2029 *(7190 new a/c) � Single aisle a/c are forecasted to make up 75% of new purchases in next 20 years � According to Boeing market forecast, only 4% of current a/c in current use will still be flying in 2029 � The European domestic air routes are all short enough that our a/c can cover them *References: Boeing future market forecast, Airbus future market forecast 8
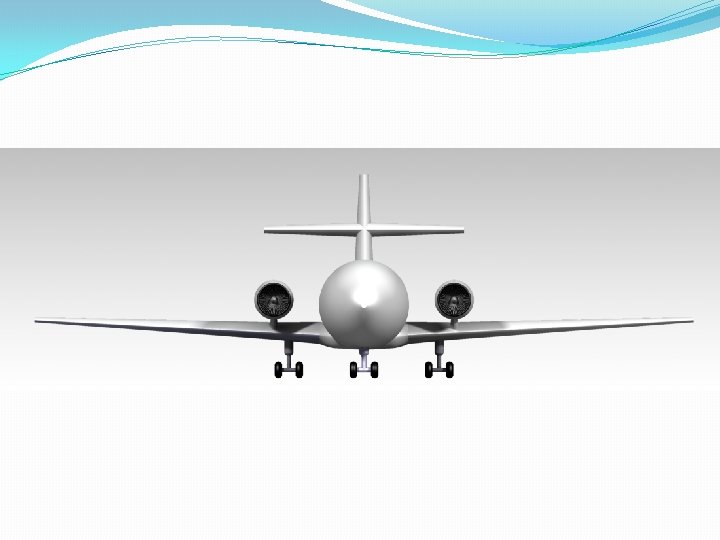
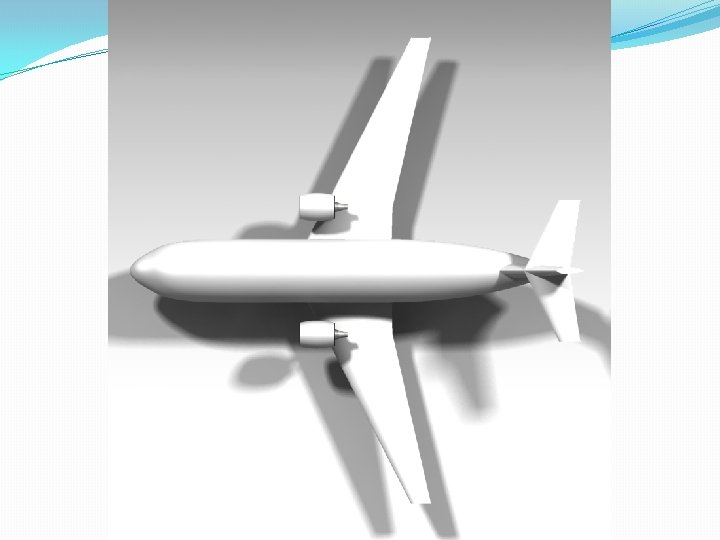
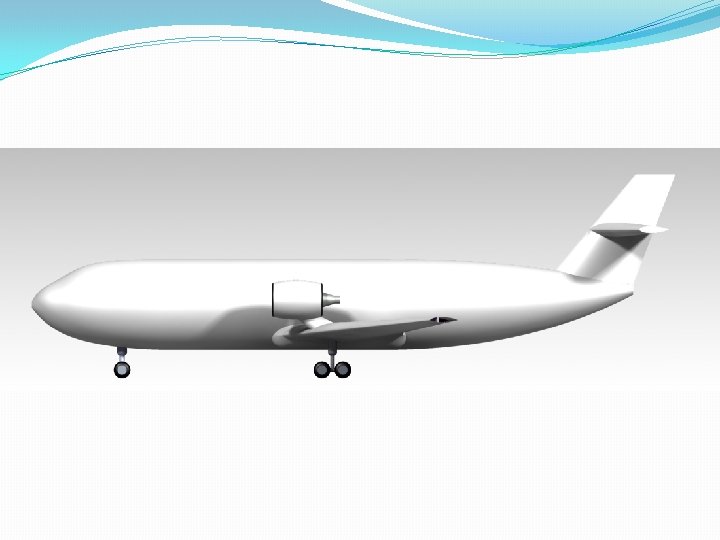
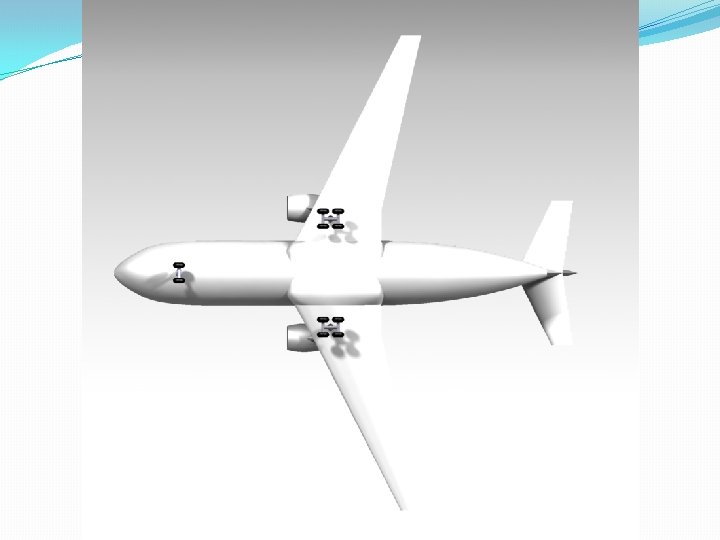
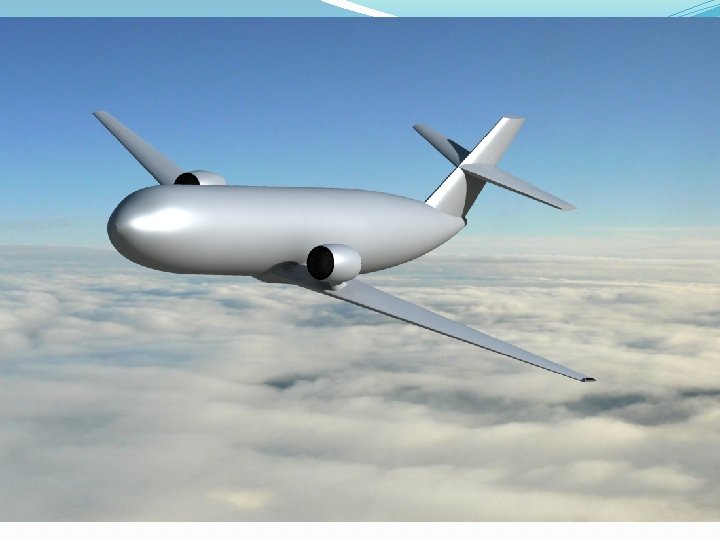
Best Aircraft Concept Walk around Advanced Features 9
Final Concept �Trade Studies on Final Design �Eliminated Twin Fuselage – Too Heavy – Extra Parasite Drag �HBB - During the trade study of sizing the body, justification of the faired wing-fuselage intersection was lacking. (In the process of deciding how big the fairings should be, we discovered errors in our prior reasoning. We could not fully justify having such large fairings. ) 10
Technologies �Majority Composite Construction �Engine Selection �Geared Turbofan �Aerodynamics �Passive Laminar Flow Control �Boundary layer control �Noise Reductions �Engine-Air Brake / Quiet Drag Applications �Pratt & Whitney Pure. Power 11
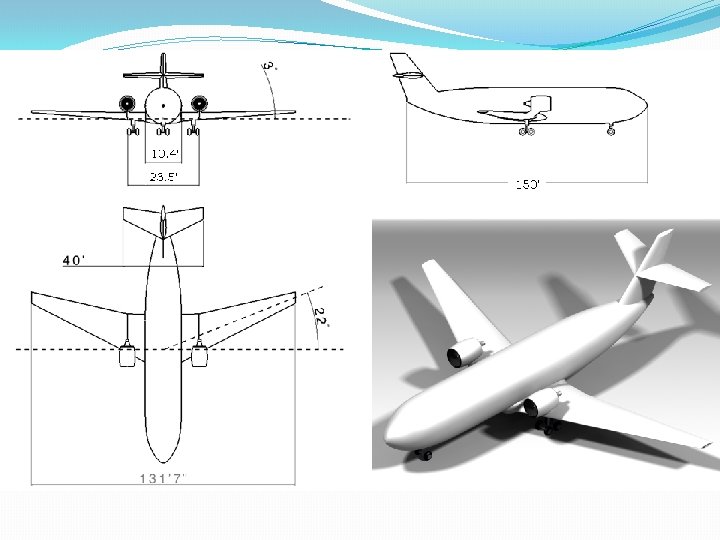
Cabin Dimensions and Layout Dimensions Total Length: 150 ft 20 First Class Passengers Total Width: 10. 4 ft Cabin Length: 118 ft Cabin Width: 11. 1 ft 180 Economy Class Passengers 4 in 67 in 78 in 47 in Reference: www. seatguru. com 125 in 18
Aircraft Sizing and Carpet Plots 19
Sizing Approach �Based on Raymer’s sizing approach �Empty Weight Buildups �Mission Segment Fuel Weight Buildups �Drag breakdown � C DO + C DI approach �Curve fits for engine data �Carpet plots to optimize W/S and T/W 20
Engine Modeling � Partial Power Model is Semi-Empirical � Verify Model with NASA Engine. Sim 1. 7 a � Use General Electric CF 6 as baseline engine � Partial Power Model with new Coefficients fitted � Apply New Technology to Partial Power Model Daniel Raymer Aircraft Design: A Conceptual Approach. p 378. Courtesy NASA. 21
Cruise Performance
Tail sizing strategy �Using B 757 as a reference �Calculate Tail volume coefficient �Compare to Raymer
Tail sizing strategy �One engine out and crosswind: �Vertical tail large enough to provide side force with rudder deflection less than 20 deg �Consider crosswind about 20% Vto �Rotation authority: �Calculate moment of horizontal tail when take off �Compare with moment of c. g. �Main landing gear is the moment reference point
Tail sizing strategy �Tail volume coefficients: Cht = 1. 02 Cvt = 0. 11 �Moment arm about 50% of fuselage length Area (ft^2) Vertical Tail Horizontal Tail 348 414
Effect of tail configuration �T-tail, V-tail and cruciform tail (mid-tail) were considered. �Avoid engine exhaust �Cruciform tail: �Reduce weight penalty to the vertical tail �Reduce chance of flutter �Heavier than V-tail �Will not provide a tail-area reduction due to endplate effect as will a T-tail
BFL Constraint Crossplots d_to Crossplot, T/W =. 3 d_TO [ft] The W/S that violates the constraint is recorded and plot on the final sizing plot. 10000 9500 9000 8500 8000 7500 7000 6500 6000 d. TO <= 7800 [ft] 100 d_to Crossplot, T/W =. 32 d_to Crossplot, T/W =. 34 10000 9000 T/W =. 32 8000 7000 6000 120 140 W/S [lb/ft^2] d. TO <= 7800 [ft] d_TO [ft] 10000 d_TO [ft] 120 140 W/S [lb/ft^2] 9000 T/W=. 34 8000 7000 d. TO <= 7800 [ft] 6000 120 140 W/S [lb/ft^2] 27
Sizing Plot 237 W/S vs TOGW with Performance Constraints TOGW [1000 lbs] 232 T/W = 0. 3 227 T/W =. 32 222 T/W=. 34 d_TO <= 7800[ft] 217 212 100 110 120 130 140 150 W/S [lb/ft^2] Minimum TOGW occurs at W/S = 128 lb/ft^2, T/W =. 31, TOGW = 224, 000 lbs 28
Sizing Plot Constraints �Balanced field length for takeoff � 7800 ft �Second segment climb �Gamma >. 024 �Landing Ground Roll �d. Land < 5800 ft �Not a function of T/W �Found the max W/S to be 129 lb/ft^2 29
Current Weight Conclusions �SFC – i 16% �CD 0 – i 10% �Laminar Control �Composites �Higher AR �Reductions in various component weights Bench mark New Era Savings OEW 131, 200 123, 000 6% Wfuel 79, 300 51, 000 36% GTOW 260, 300 224, 000 14% 30
VN Diagram � Used to show the limitations with regard to speeds/acceleration � Shows the amount of positive or negative lift that can be generated n while showing maximum G the aircraft can sustain. Never Exceed Speed Acceleration Stall Structural Damage C A U T I O N Normal Operating Range � N+ = 2. 5 � N- = -1 Structural Damage � VS – 130 kts � VA – 166 kts � VNO – 469 kts � VNE – 522 kts Indicated Airspeed VS Stall Speed VA Maneuver Speed VNO Max Structural Cruise Speed VNE Max Speed
Drag 32
Drag Prediction �Describe Approach �Component Build-up Method (CDo) � Sum of the subsonic parasite drag from each component � Skin Friction, Form Factor, Interference Scaling Factor, and Wetted Area � CDmisc added: upsweep, landing gear, leaks/protuberances �CLalpha estimation (K*CL^2) � Based on Aspect Ratio, Sweep, Mach Number, Airfoil Efficiency, and Fuselage Lift Factor �Transonic Wave Drag (CDwave) � Divergence Mach Number, Crest Critical Mach Number, Critical Pressure Coefficient, Sweep Angle � Mostly Empirical Data
Airfoil Selection �Wing - DBLA 238 �Checked Empirical Data based on t/c ratio, Mach design range, max thickness location, and Supercritical effects �Tail – NACA 64 -012 �Checked Empirical Data based on Stall angle and Zero-Lift angle
High-Lift Devices �Slotted Leading Edge Flap (Slat) �Double Slotted Flaps �CLmax �Cruise: . 95 �Takeoff: 2. 3 �Landing: 3. 1
Drag Polars �Estimated by changing Mach, Angle of Attack, and Effective Wetted Area for each different segment �CD values were then found as a function of a range of CL values
Propulsion 37
Propulsion Overview �Geared Turbofan �Technology Readiness Requires �Producibility �Stabilized Performance �Supportability �P&W Pure. Power Specs �Reduced SFC by 16% �High BPR of 12: 1 �NOx emissions 55% below CAEP/6 �Reduced Carbon Emissions �Pure. Solution MRO services MRO - (Maintenance, Repair, and Overhaul) John W. Lincoln – Technology Transition to New Aircraft. 1987 Courtesy: Pratt & Whitney
Installed Performance Assumptions �Future Technology � 32% percent SFC reduction � 50% reduction in NOx �Neglect Subsonic Inlet and Nozzle Pressure Losses �Inlet Drag Estimation* (per engine) �Bleed Power Loss Estimation* (per engine) �Assume Bleed Mass Flow 3% of engine mass flow *Daniel Raymer Aircraft Design: A Conceptual Approach. p 374 & p 377.
Engine Size �-Turbofan empirical data �-Engine weight, length, diameter and fan diameter versus dry thrust. �-Curve fit function Data from http: //www. jet-engine. net/civtfspec. html 40
Engine Dimension Data from http: //www. jet-engine. net/civtfspec. html Dry Thrust 40 k GE CF 6 -6 Estimation Weight (lb) 7350 7090 Length (in) 173 143 Diameter (in) 87 78 Fan Diameter (in) 92 80 41
Engine Emissions Dp/Foo vs Over all pressure ratio NOx 130 120 110 CAEP/2 100 CAEP/4 CAEP/6 90 Dp/Foo (g/KN) 60% Below CAEP/6 80 70% Below CAEP/2 50% Below CAEP/2 70 75% Below CAEP/6 60 50 GE-90 -110 B 1 (B-777200 LR) 40 30 CF 6 -80 C 2 B 8 F 20 10 0 15 20 25 30 35 40 45 50 55 60 OPR 42
Structures
Important Load Paths Lift Drag Thrust Weight Items considered when designing the structure: • Bending and Torsion Loads • Pressure Loads • Buckling of the wing
Internal Structure Windows/Doors: Windshield, doors and windows will have a frame around them to increase the strength in that particular area. Engine Pylons: -Bulk head will reinforce engine mounts in the wing. -Rib and spar design will be implemented in the pylons, constructed of higher strength material. Fuselage: -Semi-Monocoque construction consisting of stressed skin with stringers and longerons attached to hoop-shaped frames Wing: -Ribs will maintain shape of the wing. -Ribs will be supported by spars. -Skin of the wing will carry the pressure loads. -Torsion box structure (not pictured) will be incorporated into wing design
Special Considerations Flat disk Pressure bulkheads will close the cabin on both ends and carry the loads induced by pressurization Wing box has a carry through section in the lower part of the fuselage Landing gear to fuselage intersection will be reinforced with a stiffener made with higher strength material
Material Selection Composites 50% • Light weight • Strong • Higher resistance to corrosion • Costly • Increased options during the lay-up process Advanced Aluminum Alloys 25% • Centr. Al - Fiber metal laminate reinforced by high-quality aluminum • Alleviate fatigue issues • Reduce maintenance costs • Less sensitive to damage caused by Titanium 10% Steel 10% Other 5% Composites Steel Advanced Aluminum Alloys Titanium Other
Weight and Balance 48
Empty Weight Components �Component build up method (Raymer) �Wing, Horizontal Tail and Vertical tail are dynamic �Composite structure was taken into account with a ‘fudge’ factor (Raymer) � 0. 9 for wing � 0. 88 for tails � 0. 95 for fuselage Component Weight (lbs) Wing 28063 Horizontal Tail 1100 Vertical Tail 1948 Fuselage 22572 Nacelles 5073 Landing Gear 1272 Landing Gear 7955 Engine 23746 Engine Controls 51. 36 Starter 312 Fuel System 1714 Flight Controls 2133 Aux Power Unit 1521 Instruments 360 Hydraulics 262 Electrical 2860 Avionics 1962 Furnishings 16725 Air Conditioning 3300 Anti-Ice 560 Handling Gear 84 Total Weight 123573. 36
Location of center of gravity �Weight of parts from empty weight function �Location of all the parts
Location of center of gravity �Four fuel tanks �C. G. shift during flight �Depends on fuel tanks position. Location of C. G. Most forward Most aft 64. 6 ft 63. 7 ft 65. 5 ft * From nose
Longitudinal stability �Neutral point and static margin �Static margin about 15% of the mean aerodynamic chord Neutral point Static margin 67. 3 ft 15%
Control surface size �Elevator: �Begin from the side of the Vertical tail extend to 90% of the horizontal tail span. � 40% of the tail chord �Aileron: �Outboard – low speed * Avoid aileron reversal �Inboard – high speed �From 50% to 90% of wing span � 20% of the wing chord
Control surface size �Rudder: �One engine out and cross wind �Calculate rudder size based on yawing moment from one engine at full thrust and crosswind of 20% Vto. �Begin from fuselage 50% of vertical tail span � 40% of tail chord
Noise 55
Means of Aircraft Noise Reduction �Pratt & Whitney Pure. Power 1 Geared Turbofan Engine �Engine Air Brake 2 �Engine Placement (Due to the Noise Shielding form the Body Itself) 56
Engine Air Brake Integrate swirl vanes into the mixing duct • Swirling exhaust flows can generate drag quietly – demonstrated drag coefficient near one at ~44 d. BA full-scale • Engine air-brake application for quiet, slow / steep approach profiles (estimate up to 6 d. B for 3 degree change in glideslope) 57 Source: http: //ns 1. nianet. org/workshops/docs/QA/presentations/FSIS/Spakovsky. pdf
Method of Calculation Pratt & Whitney Pure. Power 1 Geared Turbofan is projected at 20 d. B below the Stage 4 noise limit The Engine Air Brake 2 is proposed to reduce approach noise by 6 d. B Corrections for sound propagation, engine effect, and airframe effect using an estimation method proposed by Stanford professor Ilan Kroo The sound propagation is attributed to the altitude at flyover and the distance from the sideline 58
Noise Levels NASA N+2 : 241 d. B Current Design: 237. 8 d. B Takeoff [d. B] Sideline [d. B] Approach [d. B] Total [d. B] Stage 4 90 95 98 283 Current Design 77. 4 79. 9 86. 5 243. 8 Current Design (with Engine Air Brake) 77. 4 79. 9 80. 5 237. 8 59
Cost 60
Cost �Methods Used to Estimate Cost �Number of Aircraft in Production Run �Estimated Cost of Development, Manufacturing, and Purchase �Estimated Operating Cost
Cost Estimation Method �RAND DAPCA IV Model used from Raymer’s text. �Estimates Development and Procurement costs. �Includes hours required and wrap rates for labor costs. �Technology Factoring. �Accounts for increases in Development and Manufacturing costs for new technologies. �Also includes reductions for Operating Costs. �Empty Weight, Quantity in Production Run, and Velocity were major contributors.
Cost Assumptions �From market analysis, 2000 a/c are expected to be produced to supply the Asia Pacific and American markets. � 200 a/c for first 5 years production is needed for the DAPCA IV Model. � 5 test aircraft to be produced. �Aircraft assumed to fly 3500 block hours. � 2 pilot crew and 4 flight attendants. �Cost of Jet-A fuel estimated at. 76¢/lb. � From IATA estimations on weekly price average. �Insurance rate: 1. 5%
Development Cost Analysis Development Cost Breakdown 2011 Dollars Development Support Cost 354, 000 Flight Test Cost 112, 000 Manufacturing Materials Cost 3, 215, 000 Engine Production Cost 6, 630, 000 Avionics 700, 000 Interior Furnishings 500, 000 Interior costs estimated at $2500 per passenger from Raymer Hourly Rates 1999 $ 2011 $ Engineering 86 115 Tooling 88 118 Quality 81 109 Manufacturing 73 98 *Wrap rates from Raymer 18: Increased 34% for inflation from United States Department of Labor.
RDT&E and A/C Cost �The total cost of the RDT&E + Flyaway cost is: RDT&E + Flyaway Cost $19. 7 Billion �The cost per aircraft comes to: Cost of A/C $131 million � This is with the inclusion of inflation rates from 1999 to 2011 and an investment rate of 10%. Depreciation/year $8. 9 million Insurance/year $1. 8 million �For our project to reach the breakeven point, 150 a/c will need to be sold.
Operating Cost Estimates Operating Cost Breakdown Value ($) Total Direct Operating Cost Variable Cost 8350/BH 6000/BH Fuel Consumption 4600/BH Tax 200/BH Landing Fee 1200/BH (avg) Fixed Cost *based on MTOW 2350/BH Crew and Attendants 717/BH Maintenance 1600/BH Hangar/Training Fees 35/BH *All calculations done for design mission (3000 nm. )
Conclusion �Thank you Professor Crossley and Stephan Lehner �Thank you Boeing for your feedback and time �Next, NASA’s Environmentally Responsible Aviation Challenge �Gained valuable experience and knowledge �Questions? 67
68