PISA 2015 results and future developments Alfonso Echazarra

- Slides: 44
PISA 2015 results and future developments Alfonso Echazarra Name. PISA-OCDE of Speaker Analista
PISA 2015: A summary • Approximately 540 000 students… Ø representing about 29 million 15 -year-olds in the schools of the 72 participating countries and economies … took a computer-based test lasting a total of 2 hours… Ø Not only evaluates if students can reproduce what they have learned at school… Ø …assesses students’ capacity to apply creatively their knowledge and skills in a variety of situations …and answered questions about their schools, personal context and attitudes towards learning • Parents, principals, teachers and policy-makers provided information about … Ø School policies, practices, resources and institutional factors that can explain the differences in performance
PISA 2015: A summary • New features Ø Science as core subject Ø Computer-based assessment in most education systems Ø Log-file data Ø Collaborative problem-solving Ø Teacher questionnaire • A tool to learn and improve Ø Collaboration between countries, experts and social agents sharing experiences, policies and best practices Ø Data triangulation combining the perspectives from students, teachers, principals, parents and policy-makers Ø Evidence-based and constructive dialogue
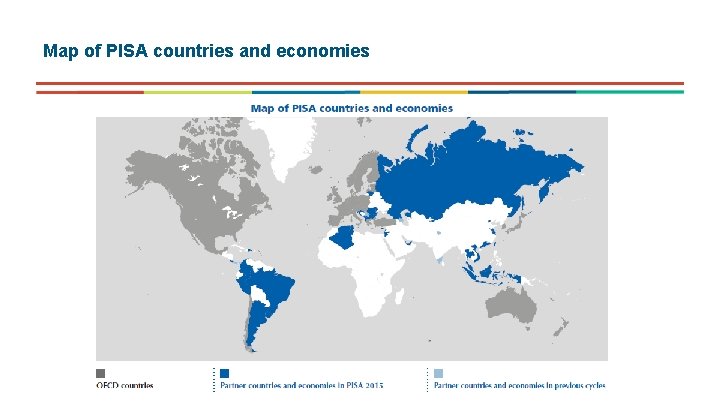
Map of PISA countries and economies
PISA 2015 reports • OECD Reports Ø Volumen I: Excellence and Equity in Education Ø Volumen II: Policies and Practices for Successful Schools Ø Volumen III (Spring 2017): Students’ Well-Being Ø Volumen IV (Spring 2017): Students’ Financial Literacy Ø Volumen V (Autumn 2017): Collaborative Problem Solving Ø Thematic reports (2018/2019): To be decided Ø Options: Teaching and learning in science, rural and urban schools, out-of-school learning, … • National reports. Ø PISA 2015. Programa para la evaluación internacional de alumnos: Informe español Ø …
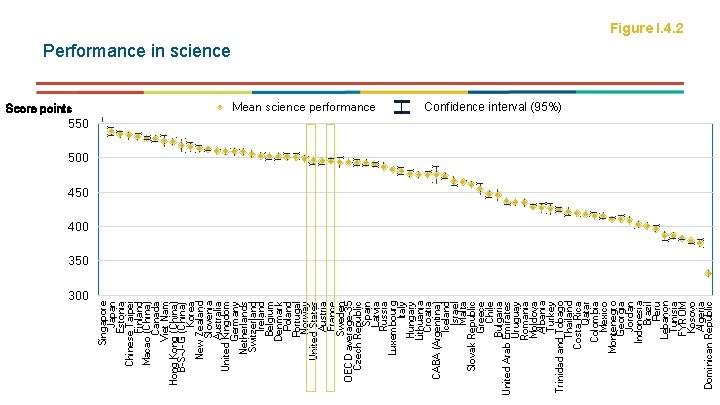
Score points 550 300 Singapore Japan Estonia Chinese Taipei Finland Macao (China) Canada Viet Nam Hong Kong (China) B-S-J-G (China) Korea New Zealand Slovenia Australia United Kingdom Germany Netherlands Switzerland Ireland Belgium Denmark Poland Portugal Norway United States Austria France Sweden OECD average-35 Czech Republic Spain Latvia Russia Luxembourg Italy Hungary Lithuania Croatia CABA (Argentina) Iceland Israel Malta Slovak Republic Greece Chile Bulgaria United Arab Emirates Uruguay Romania Moldova Albania Turkey Trinidad and Tobago Thailand Costa Rica Qatar Colombia Mexico Montenegro Georgia Jordan Indonesia Brazil Peru Lebanon Tunisia FYROM Kosovo Algeria Dominican Republic Figure I. 4. 2 Performance in science Mean science performance Confidence interval (95%) 500 450 400 350
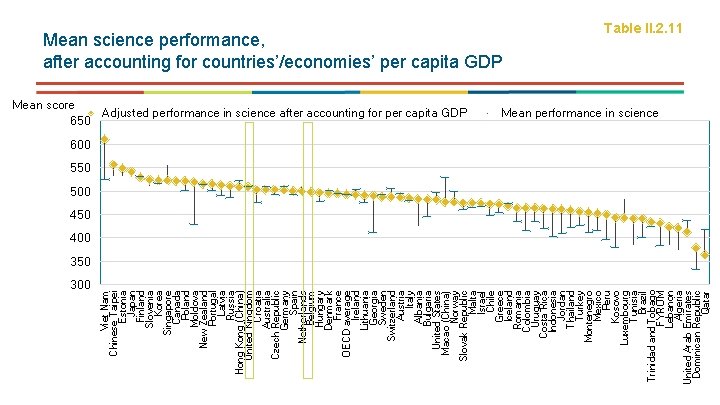
Mean score 650 300 Viet Nam Chinese Taipei Estonia Japan Finland Slovenia Korea Singapore Canada Poland Moldova New Zealand Portugal Latvia Russia Hong Kong (China) United Kingdom Croatia Australia Czech Republic Germany Spain Netherlands Belgium Hungary Denmark France OECD average Ireland Lithuania Georgia Sweden Switzerland Austria Italy Albania Bulgaria United States Macao (China) Norway Slovak Republic Malta Israel Chile Greece Iceland Romania Colombia Uruguay Costa Rica Indonesia Jordan Thailand Turkey Montenegro Mexico Peru Kosovo Luxembourg Tunisia Brazil Trinidad and Tobago FYROM Lebanon Algeria United Arab Emirates Dominican Republic Qatar Mean science performance, after accounting for countries’/economies’ per capita GDP Adjusted performance in science after accounting for per capita GDP Table II. 2. 11 Mean performance in science 600 550 500 450 400 350
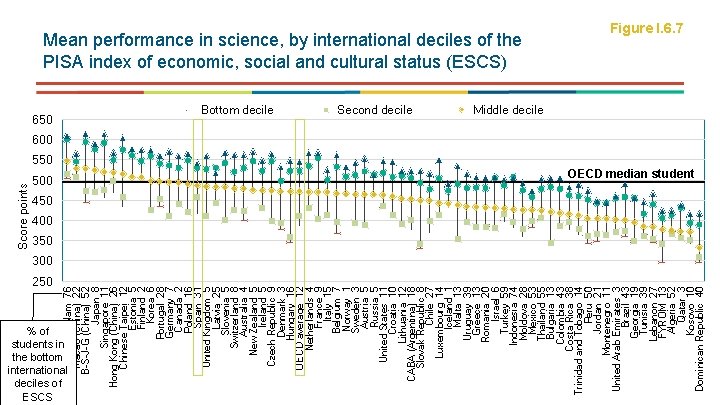
250 % of students in the bottom international deciles of ESCS Viet Nam 76 Macao (China) 22 B-S-J-G (China) 52 Japan 8 Singapore 11 Hong Kong (China) 26 Chinese Taipei 12 Estonia 5 Finland 2 Korea 6 Portugal 28 Germany 7 Canada 2 Poland 16 Spain 31 United Kingdom 5 Latvia 25 Slovenia 5 Switzerland 8 Australia 4 New Zealand 5 Ireland 5 Czech Republic 9 Denmark 3 Hungary 16 OECD average 12 Netherlands 4 France 9 Italy 15 Belgium 7 Norway 1 Sweden 3 Austria 5 Russia 5 United States 11 Croatia 10 Lithuania 12 CABA (Argentina) 18 Slovak Republic 8 Chile 27 Luxembourg 14 Iceland 1 Malta 13 Uruguay 39 Greece 13 Romania 20 Israel 6 Turkey 59 Indonesia 74 Moldova 28 Mexico 53 Thailand 55 Bulgaria 13 Colombia 43 Costa Rica 38 Trinidad and Tobago 14 Peru 50 Jordan 21 Montenegro 11 United Arab Emirates 3 Brazil 43 Georgia 19 Tunisia 39 Lebanon 27 FYROM 13 Algeria 52 Qatar 3 Kosovo 10 Dominican Republic 40 Score points Mean performance in science, by international deciles of the PISA index of economic, social and cultural status (ESCS) 650 Bottom decile 550 500 Second decile Figure I. 6. 7 Middle decile 600 OECD median student 450 400 350 300
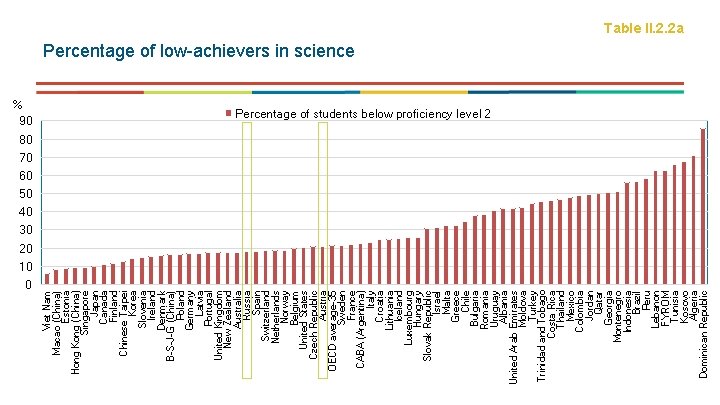
% 90 0 Viet Nam Macao (China) Estonia Hong Kong (China) Singapore Japan Canada Finland Chinese Taipei Korea Slovenia Ireland Denmark B-S-J-G (China) Poland Germany Latvia Portugal United Kingdom New Zealand Australia Russia Spain Switzerland Netherlands Norway Belgium United States Czech Republic Austria OECD average-35 Sweden France CABA (Argentina) Italy Croatia Lithuania Iceland Luxembourg Hungary Slovak Republic Israel Malta Greece Chile Bulgaria Romania Uruguay Albania United Arab Emirates Moldova Turkey Trinidad and Tobago Costa Rica Thailand Mexico Colombia Jordan Qatar Georgia Montenegro Indonesia Brazil Peru Lebanon FYROM Tunisia Kosovo Algeria Dominican Republic Table II. 2. 2 a Percentage of low-achievers in science Percentage of students below proficiency level 2 80 70 60 50 40 30 20 10
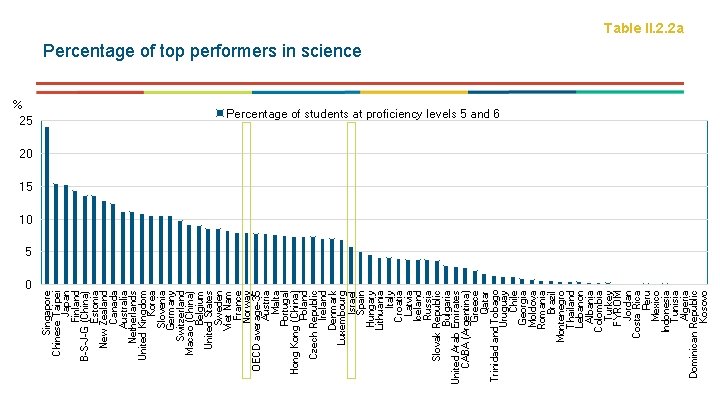
% 25 0 Singapore Chinese Taipei Japan Finland B-S-J-G (China) Estonia New Zealand Canada Australia Netherlands United Kingdom Korea Slovenia Germany Switzerland Macao (China) Belgium United States Sweden Viet Nam France Norway OECD average-35 Austria Malta Portugal Hong Kong (China) Poland Czech Republic Ireland Denmark Luxembourg Israel Spain Hungary Lithuania Italy Croatia Latvia Iceland Russia Slovak Republic Bulgaria United Arab Emirates CABA (Argentina) Greece Qatar Trinidad and Tobago Uruguay Chile Georgia Moldova Romania Brazil Montenegro Thailand Lebanon Albania Colombia Turkey FYROM Jordan Costa Rica Peru Mexico Indonesia Tunisia Algeria Dominican Republic Kosovo Table II. 2. 2 a Percentage of top performers in science Percentage of students at proficiency levels 5 and 6 20 15 10 5
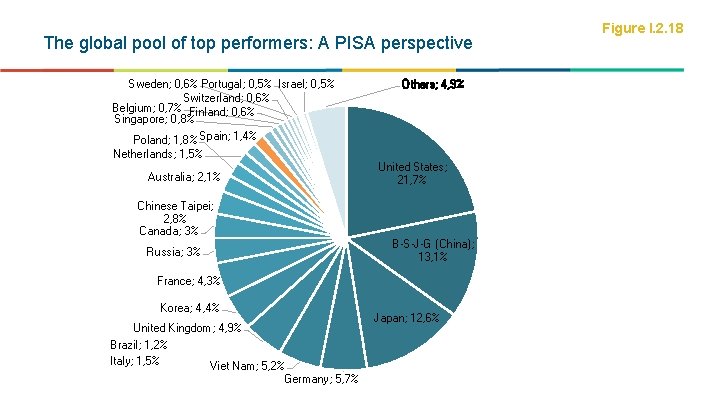
The global pool of top performers: A PISA perspective Sweden; 0, 6% Portugal; 0, 5% Israel; 0, 5% Switzerland; 0, 6% Belgium; 0, 7% Finland; 0, 6% Singapore; 0, 8% Poland; 1, 8% Spain; 1, 4% Others; 4, 9% Netherlands; 1, 5% Australia; 2, 1% United States; 21, 7% Chinese Taipei; 2, 8% Canada; 3% B-S-J-G (China); 13, 1% Russia; 3% France; 4, 3% Korea; 4, 4% United Kingdom; 4, 9% Brazil; 1, 2% Italy; 1, 5% Viet Nam; 5, 2% Germany; 5, 7% Japan; 12, 6% Figure I. 2. 18
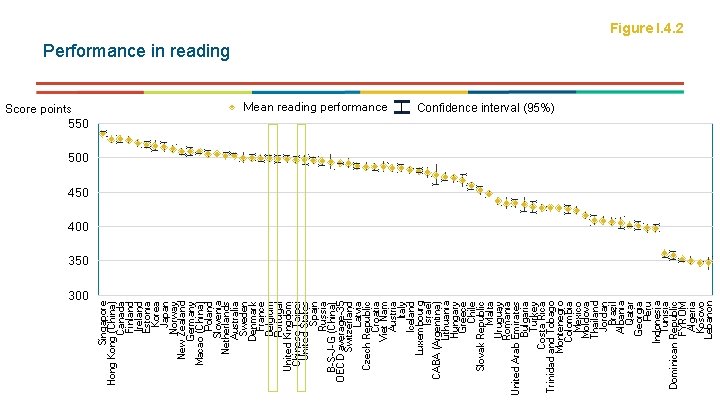
Score points 550 300 Singapore Hong Kong (China) Canada Finland Ireland Estonia Korea Japan Norway New Zealand Germany Macao (China) Poland Slovenia Netherlands Australia Sweden Denmark France Belgium Portugal United Kingdom Chinese Taipei United States Spain Russia B-S-J-G (China) OECD average-35 Switzerland Latvia Czech Republic Croatia Viet Nam Austria Italy Iceland Luxembourg Israel CABA (Argentina) Lithuania Hungary Greece Chile Slovak Republic Malta Uruguay Romania United Arab Emirates Bulgaria Turkey Costa Rica Trinidad and Tobago Montenegro Colombia Mexico Moldova Thailand Jordan Brazil Albania Qatar Georgia Peru Indonesia Tunisia Dominican Republic FYROM Algeria Kosovo Lebanon Figure I. 4. 2 Performance in reading Mean reading performance Confidence interval (95%) 500 450 400 350
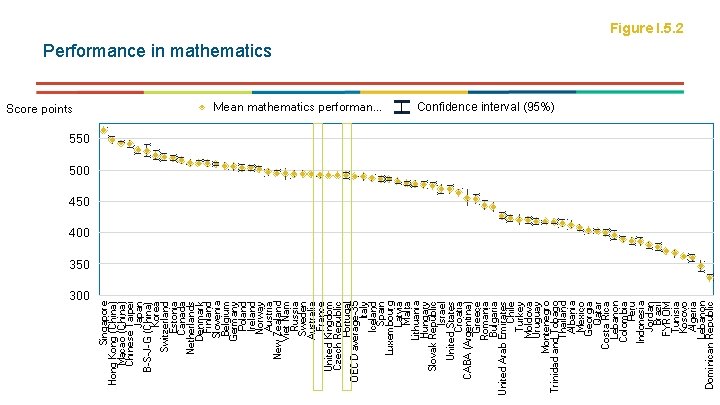
Score points 300 Singapore Hong Kong (China) Macao (China) Chinese Taipei Japan B-S-J-G (China) Korea Switzerland Estonia Canada Netherlands Denmark Finland Slovenia Belgium Germany Poland Ireland Norway Austria New Zealand Viet Nam Russia Sweden Australia France United Kingdom Czech Republic Portugal OECD average-35 Italy Iceland Spain Luxembourg Latvia Malta Lithuania Hungary Slovak Republic Israel United States Croatia CABA (Argentina) Greece Romania Bulgaria United Arab Emirates Chile Turkey Moldova Uruguay Montenegro Trinidad and Tobago Thailand Albania Mexico Georgia Qatar Costa Rica Lebanon Colombia Peru Indonesia Jordan Brazil FYROM Tunisia Kosovo Algeria Lebanon Dominican Republic Figure I. 5. 2 Performance in mathematics Mean mathematics performan. . . Confidence interval (95%) 550 500 450 400 350
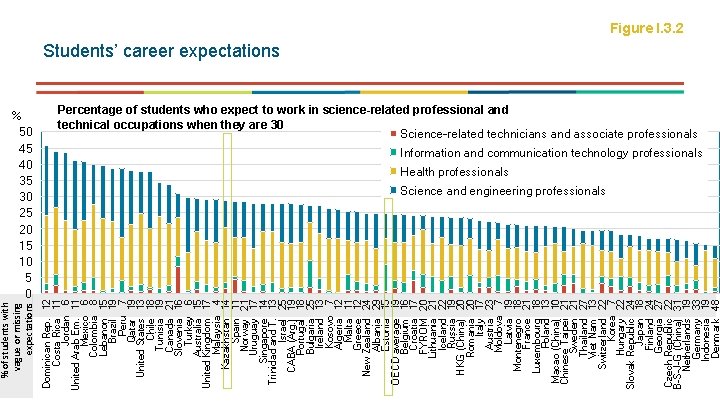
12 11 6 8 15 19 7 19 13 18 19 21 16 6 15 17 4 14 11 21 17 14 13 25 19 18 25 13 7 12 11 12 24 29 15 19 16 17 20 21 22 19 20 20 17 23 7 19 18 21 18 13 10 21 21 27 13 22 7 22 24 18 24 27 22 31 19 33 19 48 % 50 45 40 35 30 25 20 15 10 5 0 Dominican Rep. Costa Rica Jordan United Arab Em. Mexico Colombia Lebanon Brazil Peru Qatar United States Chile Tunisia Canada Slovenia Turkey Australia United Kingdom Malaysia Kazakhstan Spain Norway Uruguay Singapore Trinidad and T. Israel CABA (Arg. ) Portugal Bulgaria Ireland Kosovo Algeria Malta Greece New Zealand Albania Estonia OECD average Belgium Croatia FYROM Lithuania Iceland Russia HKG (China) Romania Italy Austria Moldova Latvia Montenegro France Luxembourg Poland Macao (China) Chinese Taipei Sweden Thailand Viet Nam Switzerland Korea Hungary Slovak Republic Japan Finland Georgia Czech Republic B-S-J-G (China) Netherlands Germany Indonesia Denmark % of students with vague or missing expectations Figure I. 3. 2 Students’ career expectations Percentage of students who expect to work in science-related professional and technical occupations when they are 30 Science-related technicians and associate professionals Information and communication technology professionals Health professionals Science and engineering professionals
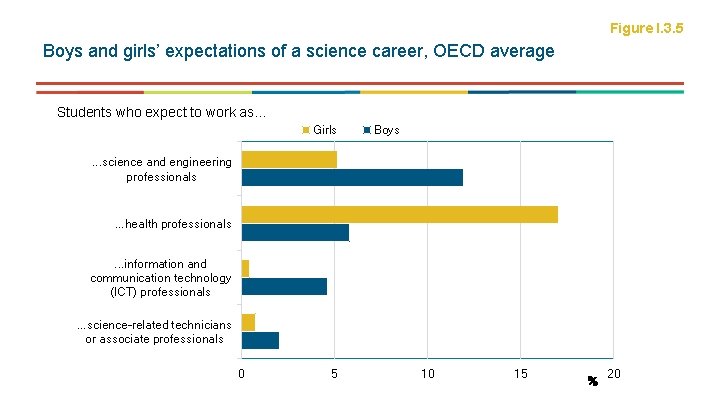
Figure I. 3. 5 Boys and girls’ expectations of a science career, OECD average Students who expect to work as. . . Girls Boys . . . science and engineering professionals . . . health professionals. . . information and communication technology (ICT) professionals. . . science-related technicians or associate professionals 0 5 10 15 % 20
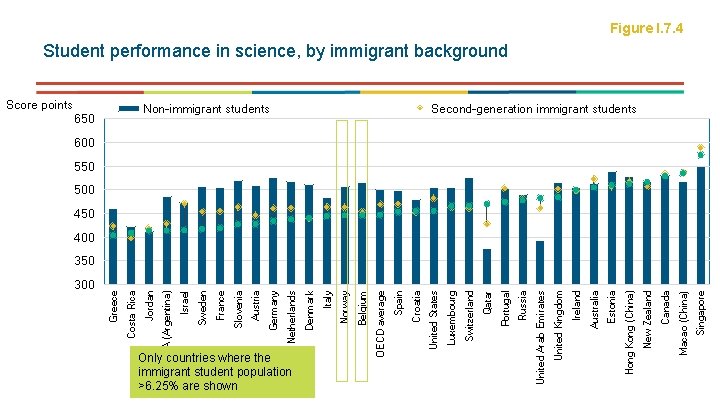
300 Only countries where the immigrant student population >6. 25% are shown Singapore Macao (China) Canada New Zealand Hong Kong (China) Estonia Australia Ireland United Kingdom United Arab Emirates Russia Portugal Qatar Switzerland Luxembourg Non-immigrant students United States Croatia Spain OECD average Belgium Norway Italy Denmark Netherlands Germany Austria Slovenia France Sweden Israel 650 CABA (Argentina) Score points Jordan Costa Rica Greece Figure I. 7. 4 Student performance in science, by immigrant background Second-generation immigrant students 600 550 500 450 400 350
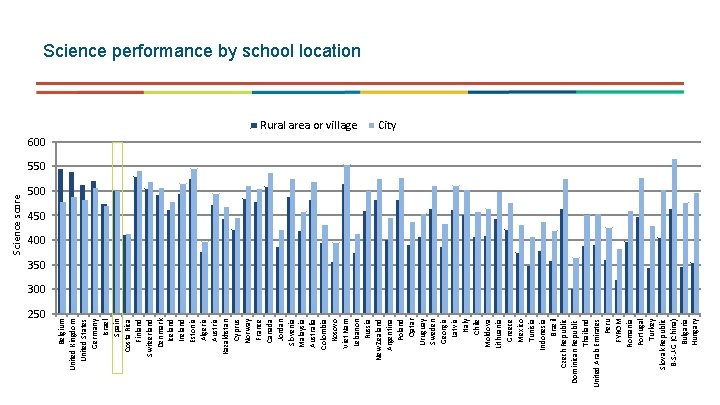
250 Belgium United Kingdom United States Germany Israel Spain Costa Rica Finland Switzerland Denmark Iceland Ireland Estonia Algeria Austria Kazakhstan Cyprus Norway France Canada Jordan Slovenia Malaysia Australia Colombia Kosovo Viet Nam Lebanon Russia New Zealand Argentina Poland Qatar Uruguay Sweden Georgia Latvia Italy Chile Moldova Lithuania Greece Mexico Tunisia Indonesia Brazil Czech Republic Dominican Republic Thailand United Arab Emirates Peru FYROM Romania Portugal Turkey Slovak Republic B-S-J-G (China) Bulgaria Hungary Science score Science performance by school location Rural area or village City 600 550 500 450 400 350 300
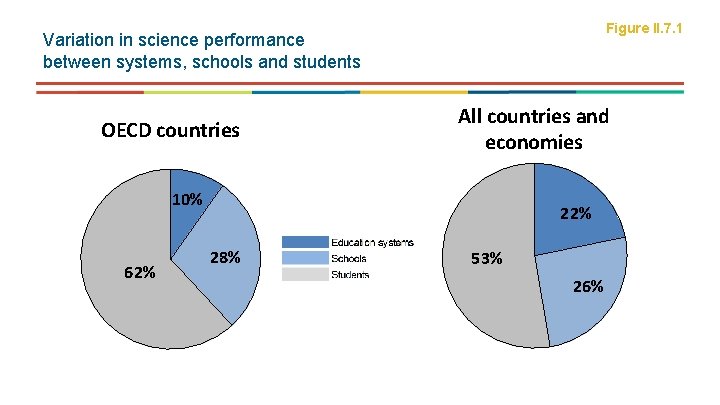
Figure II. 7. 1 Variation in science performance between systems, schools and students OECD countries All countries and economies 10% 62% 28% 53% 26%
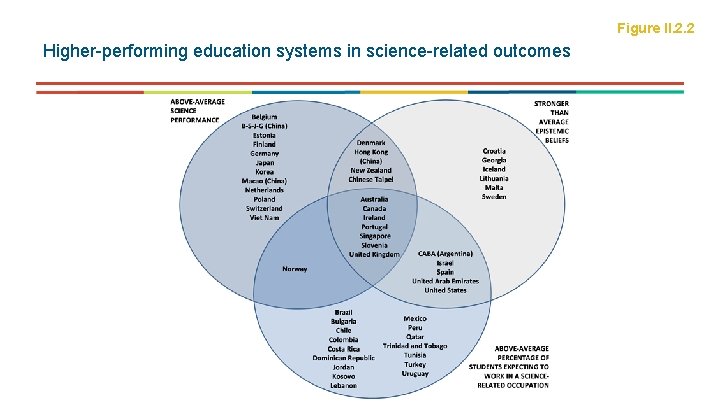
Figure II. 2. 2 Higher-performing education systems in science-related outcomes
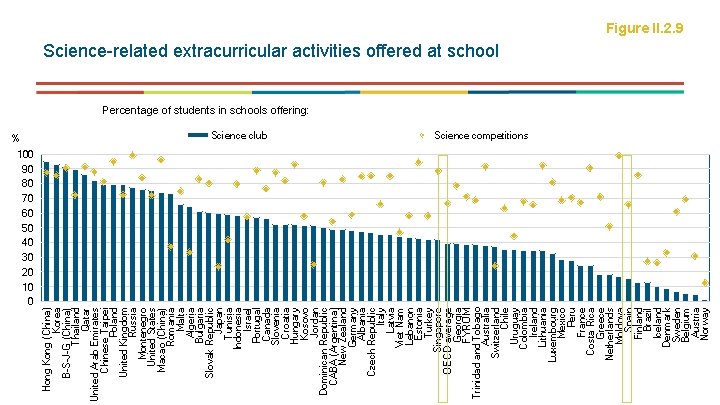
% 100 90 80 70 60 50 40 30 20 10 0 Hong Kong (China) Korea B-S-J-G (China) Thailand Qatar United Arab Emirates Chinese Taipei Poland United Kingdom Russia Montenegro United States Macao (China) Romania Malta Algeria Bulgaria Slovak Republic Japan Tunisia Indonesia Israel Portugal Canada Slovenia Croatia Hungary Kosovo Jordan Dominican Republic CABA (Argentina) New Zealand Germany Albania Czech Republic Italy Latvia Viet Nam Lebanon Estonia Turkey Singapore OECD average Georgia FYROM Trinidad and Tobago Australia Switzerland Chile Uruguay Colombia Ireland Lithuania Luxembourg Mexico Peru France Costa Rica Greece Netherlands Moldova Spain Finland Brazil Iceland Denmark Sweden Belgium Austria Norway Figure II. 2. 9 Science-related extracurricular activities offered at school Percentage of students in schools offering: Science club Science competitions
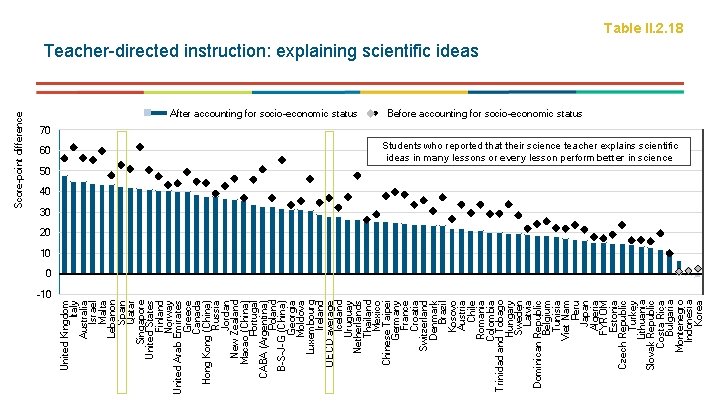
60 -10 United Kingdom Italy Australia Israel Malta Lebanon Spain Qatar Singapore United States Finland Norway United Arab Emirates Greece Canada Hong Kong (China) Russia Jordan New Zealand Macao (China) Portugal CABA (Argentina) Poland B-S-J-G (China) Georgia Moldova Luxembourg Ireland OECD average Iceland Uruguay Netherlands Thailand Mexico Chinese Taipei Germany France Croatia Switzerland Denmark Brazil Kosovo Austria Chile Romania Colombia Trinidad and Tobago Hungary Sweden Latvia Dominican Republic Belgium Tunisia Viet Nam Peru Japan Algeria FYROM Estonia Czech Republic Turkey Lithuania Slovak Republic Costa Rica Bulgaria Montenegro Indonesia Korea Score-point difference Table II. 2. 18 Teacher-directed instruction: explaining scientific ideas After accounting for socio-economic status Before accounting for socio-economic status 70 Students who reported that their science teacher explains scientific ideas in many lessons or every lesson perform better in science 50 40 30 20 10 0
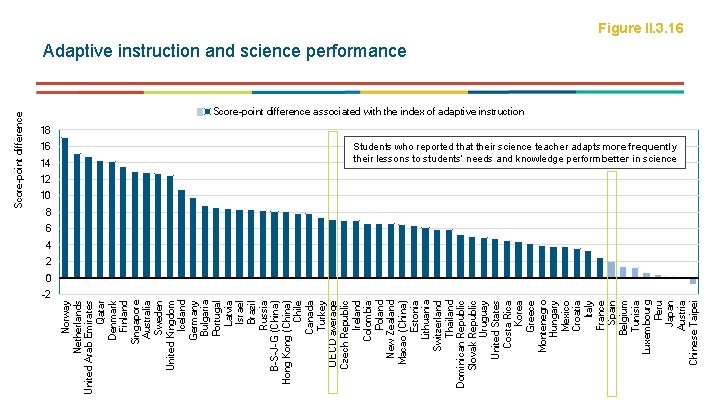
16 14 -2 Norway Netherlands United Arab Emirates Qatar Denmark Finland Singapore Australia Sweden United Kingdom Iceland Germany Bulgaria Portugal Latvia Israel Brazil Russia B-S-J-G (China) Hong Kong (China) Chile Canada Turkey OECD average Czech Republic Ireland Colombia Poland New Zealand Macao (China) Estonia Lithuania Switzerland Thailand Dominican Republic Slovak Republic Uruguay United States Costa Rica Korea Greece Montenegro Hungary Mexico Croatia Italy France Spain Belgium Tunisia Luxembourg Peru Japan Austria Chinese Taipei Score-point difference Figure II. 3. 16 Adaptive instruction and science performance Score-point difference associated with the index of adaptive instruction 18 Students who reported that their science teacher adapts more frequently their lessons to students’ needs and knowledge perform better in science 12 10 8 6 4 2 0
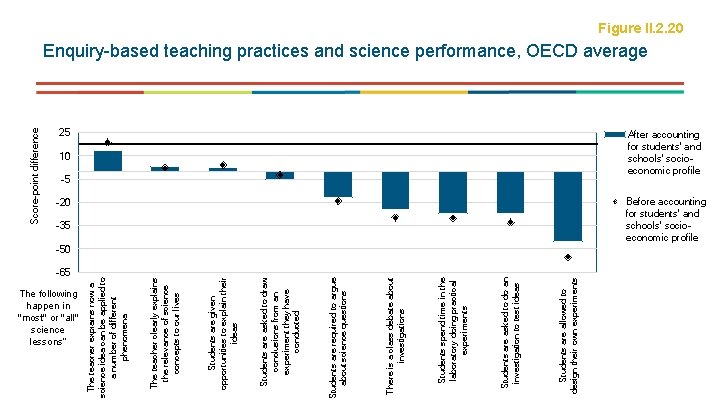
-65 The following happen in "most" or "all" science lessons“ Students are allowed to design their own experiments Students are asked to do an investigation to test ideas Students spend time in the laboratory doing practical experiments There is a class debate about investigations Students are required to argue about science questions Students are asked to draw conclusions from an experiment they have conducted Students are given opportunities to explain their ideas The teacher clearly explains the relevance of science concepts to our lives The teacher explains how a science idea can be applied to a number of different phenomena Score-point difference Figure II. 2. 20 Enquiry-based teaching practices and science performance, OECD average 25 10 -5 After accounting for students' and schools' socioeconomic profile -20 -35 -50 Before accounting for students' and schools' socioeconomic profile
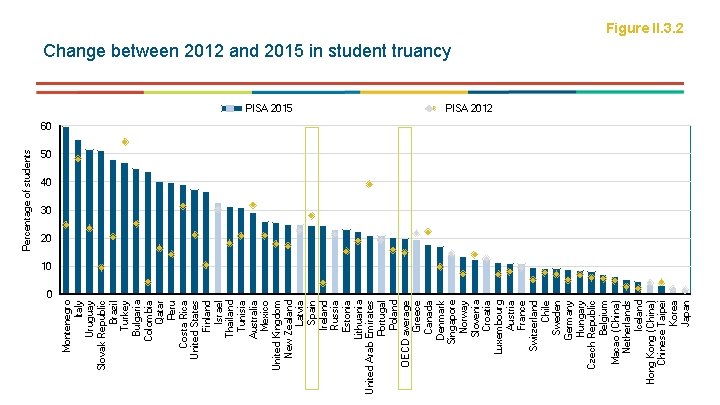
0 Montenegro Italy Uruguay Slovak Republic Brazil Turkey Bulgaria Colombia Qatar Peru Costa Rica United States Finland Israel Thailand Tunisia Australia Mexico United Kingdom New Zealand Latvia Spain Ireland Russia Estonia Lithuania United Arab Emirates Portugal Poland OECD average Greece Canada Denmark Singapore Norway Slovenia Croatia Luxembourg Austria France Switzerland Chile Sweden Germany Hungary Czech Republic Belgium Macao (China) Netherlands Iceland Hong Kong (China) Chinese Taipei Korea Japan Percentage of students Figure II. 3. 2 Change between 2012 and 2015 in student truancy PISA 2015 PISA 2012 60 50 40 30 20 10
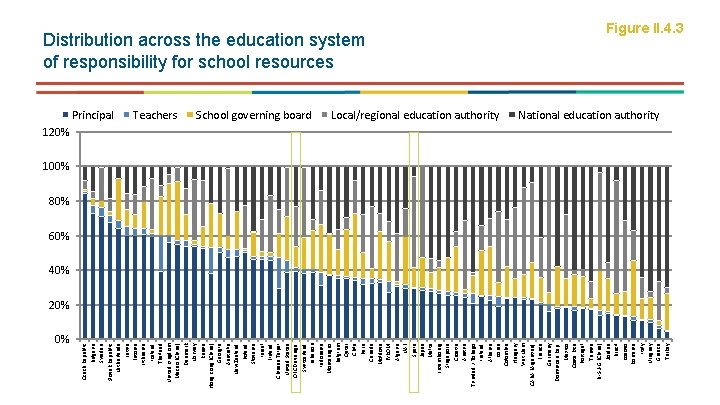
0% Czech Republic Bulgaria Sweden Slovak Republic Netherlands Latvia Estonia Lithuania Iceland Thailand United Kingdom Macao (China) Denmark Norway Russia Hong Kong (China) Georgia Australia New Zealand Poland Slovenia Israel Finland Chinese Taipei United States OECD average Switzerland Lebanon Indonesia Montenegro Belgium Qatar Chile Peru Canada Moldova FYROM Algeria UAE Spain Japan Malta Luxembourg Singapore Croatia Austria Trinidad / Tobago Ireland Albania Korea Colombia Hungary Viet Nam CABA (Argentina) France Germany Dominican Rep. Mexico Costa Rica Portugal Tunisia B-S-J-G (China) Jordan Brazil Kosovo Romania Italy Uruguay Greece Turkey Distribution across the education system of responsibility for school resources Principal Teachers School governing board Local/regional education authority Figure II. 4. 3 National education authority 120% 100% 80% 60% 40% 20%
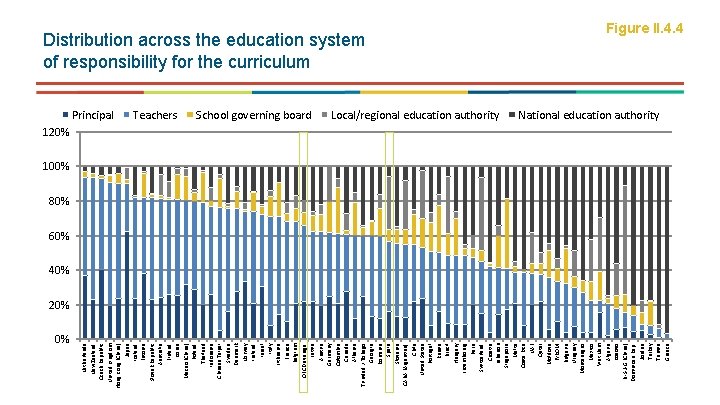
0% Netherlands New Zealand Czech Republic United Kingdom Hong Kong (China) Japan Iceland Estonia Slovak Republic Australia Finland Korea Macao (China) Poland Thailand Indonesia Chinese Taipei Sweden Denmark Norway Ireland Israel Italy Lithuania France Belgium OECD average Latvia Austria Germany Colombia Canada Albania Trinidad / Tobago Georgia Romania Spain Slovenia CABA (Argentina) Chile United States Portugal Russia Brazil Hungary Luxembourg Peru Switzerland Croatia Lebanon Singapore Malta Costa Rica UAE Qatar Moldova FYROM Bulgaria Uruguay Montenegro Mexico Viet Nam Algeria Kosovo B-S-J-G (China) Dominican Rep. Jordan Turkey Tunisia Greece Distribution across the education system of responsibility for the curriculum Principal Teachers School governing board Local/regional education authority Figure II. 4. 4 National education authority 120% 100% 80% 60% 40% 20%
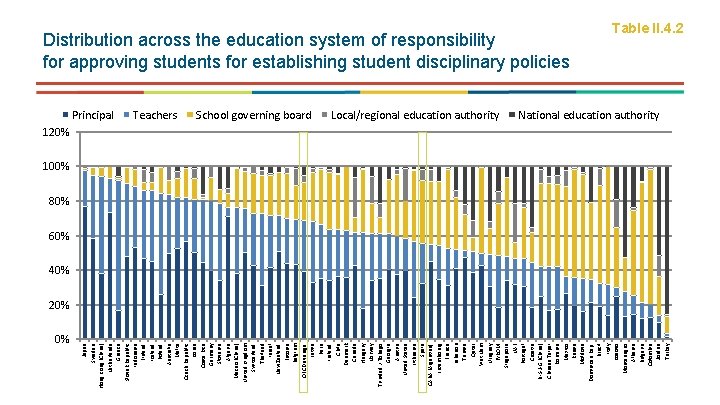
0% Japan Sweden Hong Kong (China) Netherlands Greece Slovak Republic Indonesia Finland Iceland Poland Australia Malta Czech Republic Korea Costa Rica Germany Slovenia Algeria Macao (China) United Kingdom Switzerland Thailand Israel New Zealand Estonia Belgium OECD average Latvia Peru Ireland Chile Denmark Canada Hungary Norway Trinidad / Tobago Georgia Austria United States Lithuania Spain CABA (Argentina) Luxembourg France Lebanon Tunisia Qatar Viet Nam Uruguay FYROM Singapore UAE Portugal Croatia B-S-J-G (China) Chinese Taipei Romania Mexico Russia Moldova Dominican Rep. Brazil Italy Kosovo Montenegro Albania Bulgaria Colombia Jordan Turkey Distribution across the education system of responsibility for approving students for establishing student disciplinary policies Principal Teachers School governing board Local/regional education authority Table II. 4. 2 National education authority 120% 100% 80% 60% 40% 20%
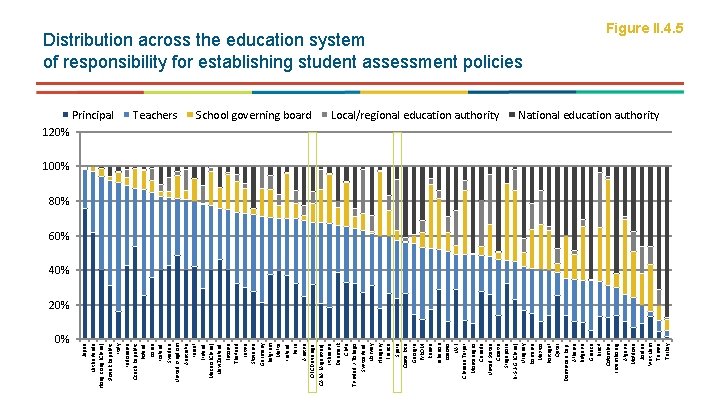
0% Japan Netherlands Hong Kong (China) Slovak Republic Italy Indonesia Czech Republic Poland Korea Iceland Sweden United Kingdom Australia Israel Finland Macao (China) New Zealand Estonia Thailand Latvia Slovenia Germany Belgium Malta Ireland Peru Austria OECD average CABA (Argentina) Lithuania Denmark Chile Trinidad / Tobago Switzerland Norway Hungary France Spain Costa Rica Georgia FYROM Russia Lebanon Kosovo UAE Chinese Taipei Montenegro Canada United States Croatia Singapore B-S-J-G (China) Uruguay Romania Mexico Portugal Qatar Dominican Rep. Albania Bulgaria Greece Brazil Colombia Luxembourg Algeria Moldova Jordan Viet Nam Tunisia Turkey Distribution across the education system of responsibility for establishing student assessment policies Principal Teachers School governing board Local/regional education authority Figure II. 4. 5 National education authority 120% 100% 80% 60% 40% 20%
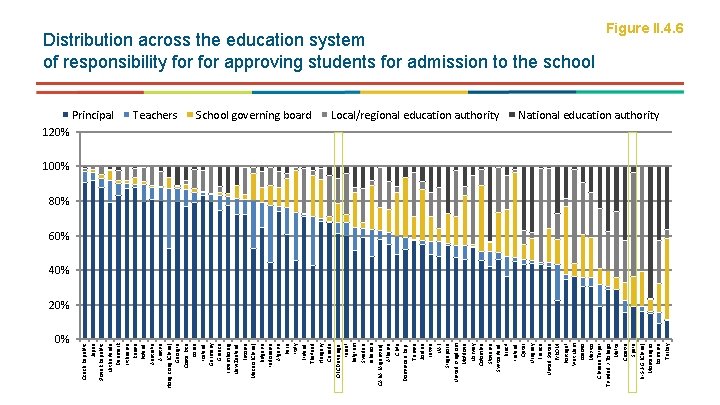
0% Czech Republic Japan Slovak Republic Netherlands Denmark Lithuania Russia Poland Australia Austria Hong Kong (China) Georgia Costa Rica Korea Iceland Germany Greece Luxembourg New Zealand Estonia Macao (China) Bulgaria Indonesia Algeria Peru Italy Finland Thailand Hungary Canada OECD average Israel Belgium Sweden Lebanon CABA (Argentina) Albania Chile Dominican Rep. Tunisia Jordan Latvia UAE Singapore United Kingdom Moldova Norway Colombia Slovenia Switzerland Brazil Ireland Qatar Uruguay France United States FYROM Portugal Viet Nam Kosovo Mexico Chinese Taipei Trinidad / Tobago Malta Croatia Spain B-S-J-G (China) Montenegro Romania Turkey Distribution across the education system of responsibility for approving students for admission to the school Principal Teachers School governing board Local/regional education authority Figure II. 4. 6 National education authority 120% 100% 80% 60% 40% 20%
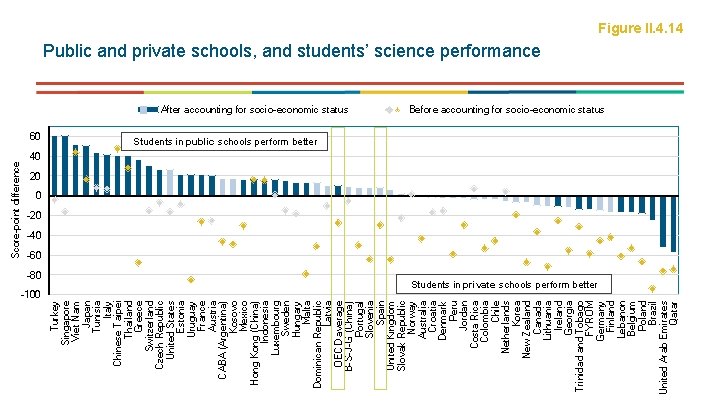
60 -80 -100 Turkey Singapore Viet Nam Japan Tunisia Italy Chinese Taipei Thailand Greece Switzerland Czech Republic United States Estonia Uruguay France Austria CABA (Argentina) Kosovo Mexico Hong Kong (China) Indonesia Luxembourg Sweden Hungary Malta Dominican Republic Latvia OECD average B-S-J-G (China) Portugal Slovenia Spain United Kingdom Slovak Republic Norway Australia Croatia Denmark Peru Jordan Costa Rica Colombia Chile Netherlands Korea New Zealand Canada Lithuania Ireland Georgia Trinidad and Tobago FYROM Germany Finland Lebanon Belgium Poland Brazil United Arab Emirates Qatar Score-point difference Figure II. 4. 14 Public and private schools, and students’ science performance After accounting for socio-economic status Before accounting for socio-economic status 40 Students in public schools perform better 20 0 -20 -40 -60 Students in private schools perform better
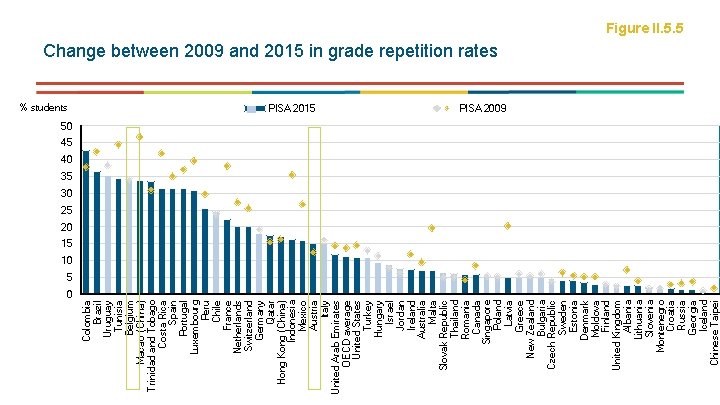
% students 0 Colombia Brazil Uruguay Tunisia Belgium Macao (China) Trinidad and Tobago Costa Rica Spain Portugal Luxembourg Peru Chile France Netherlands Switzerland Germany Qatar Hong Kong (China) Indonesia Mexico Austria Italy United Arab Emirates OECD average United States Turkey Hungary Israel Jordan Ireland Australia Malta Slovak Republic Thailand Romania Canada Singapore Poland Latvia Greece New Zealand Bulgaria Czech Republic Sweden Estonia Denmark Moldova Finland United Kingdom Albania Lithuania Slovenia Montenegro Croatia Russia Georgia Iceland Chinese Taipei Figure II. 5. 5 Change between 2009 and 2015 in grade repetition rates PISA 2015 PISA 2009 50 45 40 35 30 25 20 15 10 5
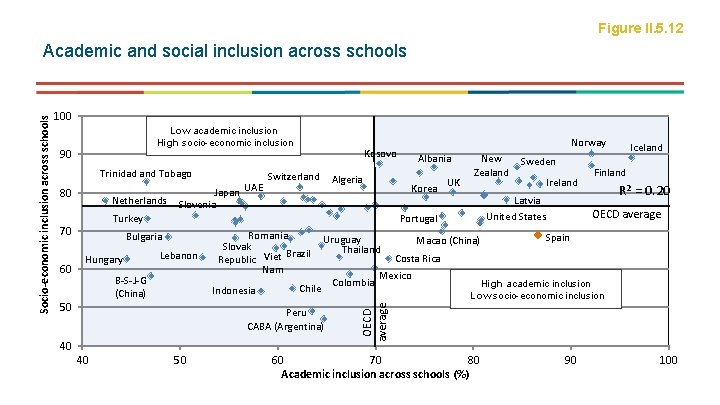
Figure II. 5. 12 100 Low academic inclusion High socio-economic inclusion 90 Trinidad and Tobago 80 Netherlands Switzerland Algeria Lebanon B-S-J-G (China) 50 Romania Slovak Brazil Republic Viet Nam Indonesia Uruguay Thailand Chile Peru CABA (Argentina) 40 40 Albania UK New Zealand 50 Colombia Ireland Iceland Finland R 2 = 0. 20 OECD average United States Macao (China) Costa Rica Mexico Sweden Latvia Portugal Bulgaria Hungary Norway Korea Turkey 70 60 Japan UAE Slovenia Kosovo Spain High academic inclusion Low socio-economic inclusion OECD average Socio-economic inclusion across schools Academic and social inclusion across schools 60 70 80 Academic inclusion across schools (%) 90 100
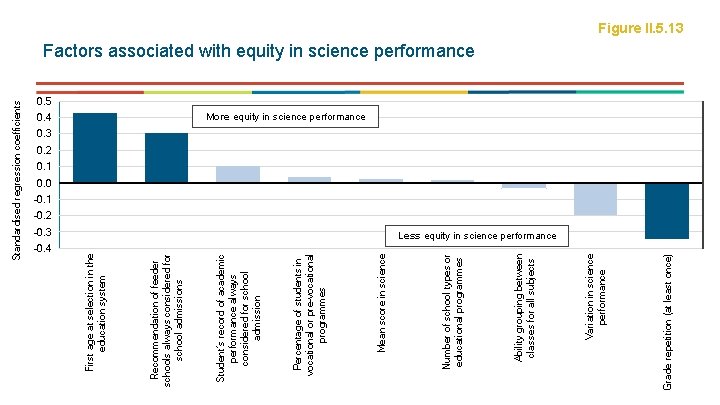
Standardised regression coefficients -0. 4 Grade repetition (at least once) Variation in science performance Ability grouping between classes for all subjects -0. 3 Number of school types or educational programmes Mean score in science Percentage of students in vocational or pre-vocational programmes 0. 4 Student’s record of academic performance always considered for school admission Recommendation of feeder schools always considered for school admissions First age at selection in the education system Figure II. 5. 13 Factors associated with equity in science performance 0. 5 More equity in science performance 0. 3 0. 2 0. 1 0. 0 -0. 1 -0. 2 Less equity in science performance
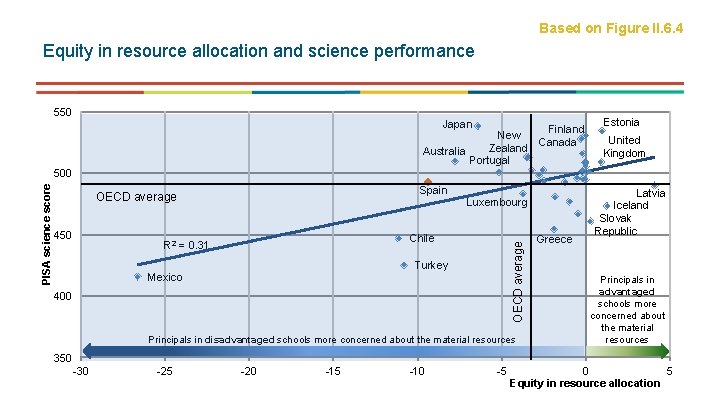
Based on Figure II. 6. 4 Equity in resource allocation and science performance 550 Japan Finland New Canada Zealand Australia Portugal Estonia United Kingdom Spain OECD average 450 Luxembourg Chile R 2 = 0. 31 OECD average PISA science score 500 Turkey Mexico 400 Principals in disadvantaged schools more concerned about the material resources Greece Latvia Iceland Slovak Republic Principals in advantaged schools more concerned about the material resources 350 -30 -25 -20 -15 -10 -5 0 5 Equity in resource allocation
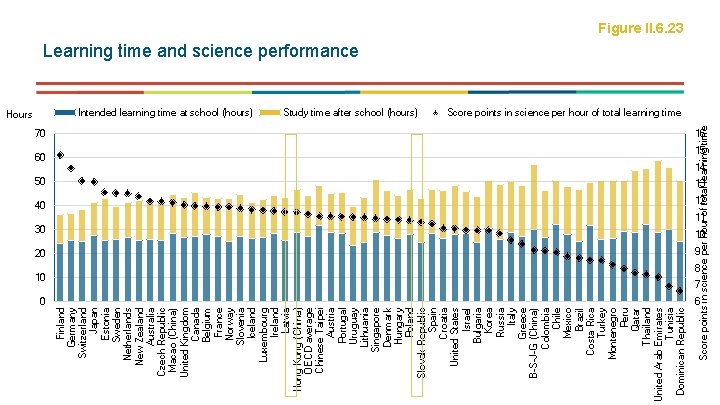
Intended learning time at school (hours) 0 Study time after school (hours) 70 16 60 15 14 50 13 40 12 30 11 10 20 9 10 8 7 6 Score points in science per hour of total learning time Hours Finland Germany Switzerland Japan Estonia Sweden Netherlands New Zealand Australia Czech Republic Macao (China) United Kingdom Canada Belgium France Norway Slovenia Iceland Luxembourg Ireland Latvia Hong Kong (China) OECD average Chinese Taipei Austria Portugal Uruguay Lithuania Singapore Denmark Hungary Poland Slovak Republic Spain Croatia United States Israel Bulgaria Korea Russia Italy Greece B-S-J-G (China) Colombia Chile Mexico Brazil Costa Rica Turkey Montenegro Peru Qatar Thailand United Arab Emirates Tunisia Dominican Republic Figure II. 6. 23 Learning time and science performance Score points in science per hour of total learning time
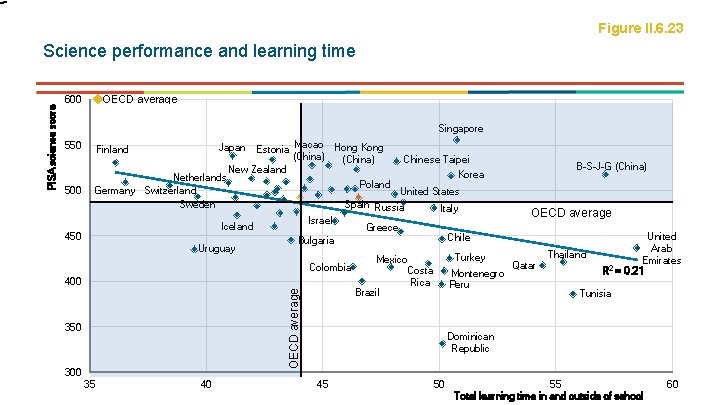
Figure II. 6. 23 OECD average 600 Singapore 550 500 Estonia Macao Hong Kong (China) Chinese Taipei (China) New Zealand Korea Netherlands Poland Germany Switzerland United States Spain Sweden Russia Italy Japan Finland Israel Iceland 450 Uruguay Colombia 400 350 300 35 40 Greece B-S-J-G (China) OECD average Chile Bulgaria OECD average PISA science score Science performance and learning time Turkey Mexico Costa Rica Brazil Montenegro Peru Thailand Qatar United Arab Emirates R 2 = 0. 21 Tunisia Dominican Republic 45 50 55 Total learning time in and outside of school 60
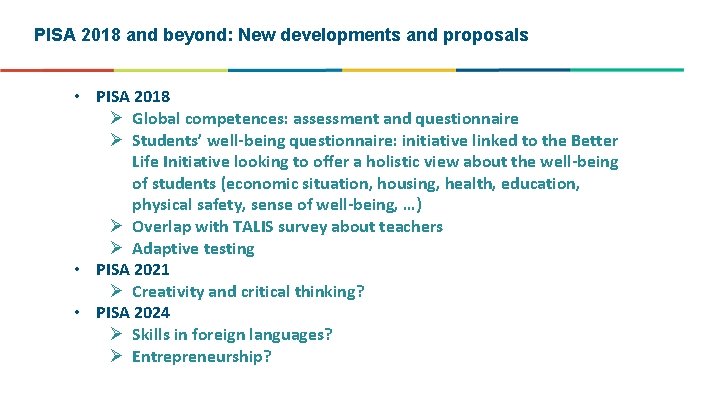
PISA 2018 and beyond: New developments and proposals • PISA 2018 Ø Global competences: assessment and questionnaire Ø Students’ well-being questionnaire: initiative linked to the Better Life Initiative looking to offer a holistic view about the well-being of students (economic situation, housing, health, education, physical safety, sense of well-being, …) Ø Overlap with TALIS survey about teachers Ø Adaptive testing • PISA 2021 Ø Creativity and critical thinking? • PISA 2024 Ø Skills in foreign languages? Ø Entrepreneurship?
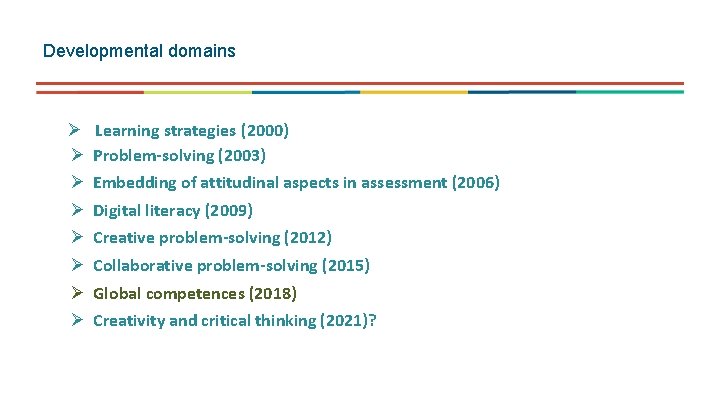
Developmental domains Ø Ø Ø Ø Learning strategies (2000) Problem-solving (2003) Embedding of attitudinal aspects in assessment (2006) Digital literacy (2009) Creative problem-solving (2012) Collaborative problem-solving (2015) Global competences (2018) Creativity and critical thinking (2021)?
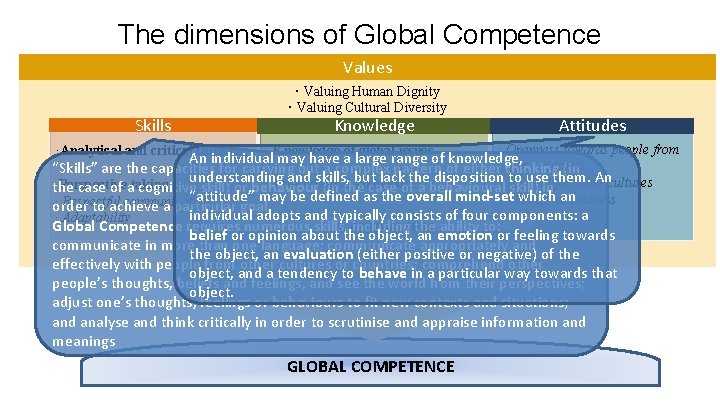
PISA definition of Global Competence Global competence is the capacity to analyse global and intercultural issues critically and from multiple perspectives, to understand how differences affect perceptions, judgments, and ideas of self and others, and to engage in open, appropriate and effective interactions with others from different backgrounds on the basis of a shared respect for human dignity.
Some questions PISA seeks to answer Ø How well are students prepared for life and employment in culturally diverse societies and in a globalised world? Ø How much are students exposed to global news and how do they understand critically analyse intercultural and global issues? Ø What approaches to multicultural, intercultural and global education are used at school? Ø What approaches are used to educate culturally diverse students and how are schools leveraging this diversity to develop students’ global competence? Ø What approaches are used to stimulate peer-to-peer learning between students from different cultures? Ø How well are schools contesting cultural and gender biases and stereotypes, including their own?
Schools can make a difference Schools can: Ø provide opportunities for young people to learn about global developments that affect the world and their lives Ø teach students how they can develop a fact-based and critical worldview of today Ø equip students with the means to access and analyse a broad range of cultural practices and meanings Ø engage students in experiences that facilitate international and intercultural relations Ø promote the value of diversity, which in turn encourages sensitivity, respect and appreciation.
The dimensions of Global Competence Values Skills · Valuing Human Dignity · Valuing Cultural Diversity Knowledge Attitudes · Openness towards people from · Knowledge of global issues An individual may have a large range of knowledge, cultures “Skills” are the capacities for carrying out a complex pattern of eitherother thinking (in understanding and skills, but lack the disposition to use them. An · · Intercultural knowledge ·Perspective the case of ataking cognitive skill) or behaviour (in the case of a behavioural Respect skill) in for other cultures “attitude” may be defined as the overall mind-set which an · Global-mindedness · Respectful communication order to achieve a particular goal. individual adopts and typically consists of four components: a · Adaptability Global Competence requires numerous skills, including the ability to: Components belief or opinion about the object, an emotion or feeling towards communicate in more than one language; communicate appropriately and the object, an evaluation (either positive or negative) of the effectively with people from other cultures or countries; comprehend other object, and a tendency to behave in a particular way towards that people’s thoughts, beliefs and feelings, and see the world from their perspectives; object. adjust one’s thoughts, feelings or behaviours to fit new contexts and situations; and analyse and think critically in order to scrutinise and appraise information and meanings ·Analytical and critical thinking GLOBAL COMPETENCE
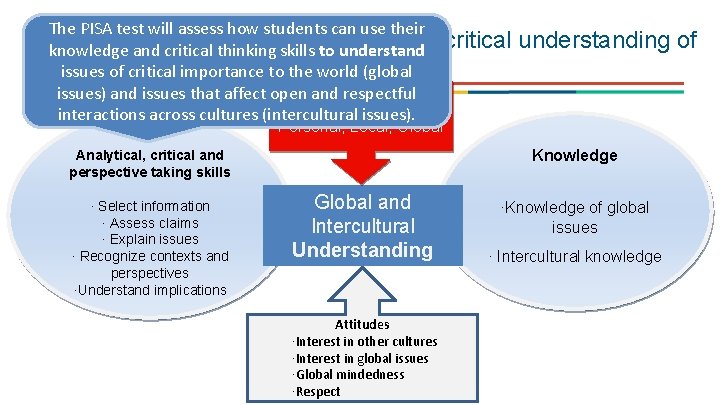
The PISA test will assess how students can use their The cognitive test – fromskills information knowledge and critical thinking to understandto critical understanding of global and intercultural issues of critical importance to the world (global issues) and issues that affect open and respectful Contexts interactions across cultures (intercultural issues). Personal, Local, Global Knowledge Analytical, critical and perspective taking skills · Select information · Assess claims · Explain issues · Recognize contexts and perspectives ·Understand implications Global and Intercultural Understanding Attitudes ·Interest in other cultures ·Interest in global issues ·Global mindedness ·Respect ·Knowledge of global issues · Intercultural knowledge
Muchas gracias