2015 NCAE National Test Results NUMBER OF EXAMINEES

2015 NCAE National Test Results

NUMBER OF EXAMINEES: Public Private 1368467 324970 TOTAL 1693437 DATE OF EXAMINATION: August 26, 2015

NATIONAL PERFORMANCE BY DOMAINS Areas 2014 2015 # of items MRS SD MPS # of item s 155 56. 21 17. 59 36. 27 155 55. 01 16. 88 35. 49 • Scientific Ability 40 13. 37 5. 25 33. 42 40 13. 65 5. 15 34. 13 • Reading Comprehension 30 13. 21 5. 12 44. 04 30 12. 76 5. 29 42. 53 • Verbal Ability 30 11. 43 3. 80 38. 10 30 10. 91 3. 65 36. 37 • Mathematical Ability 40 12. 73 5. 09 31. 83 40 12. 85 5. 14 32. 13 • Logical Reasoning Ability 15 5. 47 2. 88 36. 47 15 4. 84 2. 28 32. 26 Non-verbal Ability 30 10. 34 4. 90 51. 71 30 8. 60 4. 01 43. 00 Technical- Vocational Aptitude 60 31. 00 12. 21 51. 66 60 27. 36 11. 10 45. 60 150 56. 84 18. 83 37. 89 150 55. 63 18. 08 37. 08 50 22. 17 8. 90 44. 33 50 20. 86 41. 72 General Scholastic Aptitude Academic Tracks • HUMSS MR S SD 7. 75 MPS

PERFORMANCE IN MEAN PERCENTAGE SCORE National Mean Performance by Domain What is the performance of junior high school students in Mean Percentage Scores in the NCAE subtests? 60. 00 52. 55 50. 00 45. 60 43. 00 42. 53 40. 00 36. 37 34. 13 41. 72 41. 27 32. 13 32. 26 MA LRA 37. 08 36. 70 35. 49 32. 84 30. 00 20. 00 10. 00 SA RC VA GSA CA NVA VMS TVA HUMSS STEM ABM AT
 What is the")
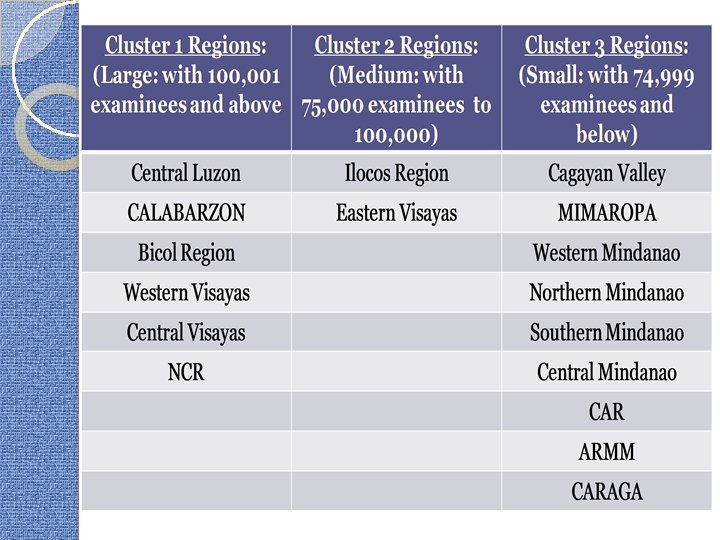
FREQUENCY DISTRIBUTION OF EXAMINEES IN GSA BY CLUSTER OF REGIONS (PS) What is the percentage distribution of NCAE examinees by aptitude level in GSA and cluster of regions? APTITUDE LEVEL HIGH REGIONAL CLUSTER 1 n 60611 2 % n 5. 88 14384 TOTAL 3 % n % 3. 74 16982 6. 11 91977 5. 43 MODERATE 864932 83. 87 316192 82. 29 224341 80. 70 1405465 82. 99 LOW 105678 10. 25 53650 13. 96 36667 13. 19 195995 11. 57 TOTAL 1031221 60. 90 384226 22. 69 277990 16. 42 1693437 Cluster of Regions: 1 = Large (100, 001 examinees and above) 2 = Medium (75, 000 examinees to 100, 000) 3 = Small (74, 999 examinees and below) 100. 0 0
 What is the")
FREQUENCY DISTRIBUTION OF EXAMINEES IN TVA BY CLUSTER OF REGIONS (PS) What is the percentage distribution of NCAE examinees by aptitude level in TVA and cluster of regions? REGIONAL CLUSTER APTITUDE LEVEL HIGH 1 2 TOTAL 3 n % n % 26840 2. 60 4488 1. 17 4284 1. 54 35612 2. 10 MODERATE 839147 81. 37 288934 75. 20 206523 74. 29 1334604 78. 81 LOW 165234 16. 02 90804 23. 63 67183 24. 17 323221 19. 09 TOTAL 1031221 60. 90 384226 22. 69 277990 16. 42 1693437 100. 00 Cluster of Regions: 1 = Large (100, 001 examinees and above) 2 = Medium (75, 000 examinees to 100, 000) 3 = Small (74, 999 examinees and below)
 What is the")
FREQUENCY DISTRIBUTION OF EXAMINEES IN NVA BY CLUSTER OF REGIONS (PS) What is the percentage distribution of NCAE examinees by aptitude level in NVA and cluster of regions? APTITUDE LEVEL HIGH REGIONAL CLUSTER 1 2 TOTAL 3 n % n % 28931 2. 81 5314 1. 38 4694 1. 69 38939 2. 30 MODERATE 855404 82. 95 300936 78. 32 217199 78. 13 1373539 81. 11 LOW TOTAL 146886 14. 24 77976 20. 29 56097 20. 18 280959 16. 59 1031221 60. 90 384226 22. 69 277990 16. 42 1693437 100. 00 Cluster of Regions: 1 = Large (100, 001 examinees and above) 2 = Medium (75, 000 examinees to 100, 000) 3 = Small (74, 999 examinees and below)
 What is the")
FREQUENCY DISTRIBUTION OF EXAMINEES IN LRA BY CLUSTER OF REGIONS (PS) What is the percentage distribution of NCAE examinees by aptitude level in LRA and cluster of regions? APTITUDE LEVEL HIGH REGIONAL CLUSTER 1 2 TOTAL 3 n % n % 40161 3. 89 9313 2. 42 10306 3. 71 59780 3. 53 MODERATE 852015 82. 62 316014 82. 25 225823 81. 23 1393852 82. 31 LOW 139045 13. 48 58899 15. 33 41861 15. 06 239805 14. 16 TOTAL 1031221 60. 90 384226 22. 69 277990 16. 42 1693437100. 00 Cluster of Regions: 1 = Large (100, 001 examinees and above) 2 = Medium (75, 000 examinees to 100, 000) 3 = Small (74, 999 examinees and below)
 What is the")
FREQUENCY DISTRIBUTION OF EXAMINEES IN AT BY CLUSTER OF REGIONS (PS) What is the percentage distribution of NCAE examinees by aptitude level in AT and cluster of regions? APTITUDE LEVEL HIGH REGIONAL CLUSTER 1 n 59398 2 % n 5. 76 12051 TOTAL 3 % n % 3. 14 10865 3. 91 82314 4. 86 MODERATE 846001 82. 04 309490 80. 55 222177 79. 92 1377668 81. 35 LOW 125822 12. 20 62685 16. 31 44948 16. 17 233455 13. 79 TOTAL 1031221 60. 90 384226 22. 69 277990 16. 42 1693437100. 00 Cluster of Regions: 1 = Large (100, 001 examinees and above) 2 = Medium (75, 000 examinees to 100, 000) 3 = Small (74, 999 examinees and below)

FREQUENCY DISTRIBUTION OF EXAMINEES BY APTITUDE LEVEL What is the aptitude level of the junior high school students in the NCAE domains? NCAE DOMAIN HIGH APTITUDE LEVEL MODERATE n % TOTAL LOW n % GSA 91977 5. 43 1405465 82. 99 195995 11. 57 1693437 100. 00 TVA 35612 2. 10 1334604 78. 81 323221 19. 09 1693437 100. 00 NVA 38939 2. 30 1373539 81. 11 280959 1693437 100. 00 LRA 59780 3. 53 1393852 82. 31 239805 14. 16 1693437 100. 00 AT 82314 4. 86 1377668 81. 35 233455 13. 79 1693437 100. 00 Legend: High Aptitude (75%-100%) Moderate Aptitude (50%-74%) Low Aptitude (0%-49%) n %

PERCENTAGE DISTRIBUTION OF EXAMINEES BY APTITUDE LEVEL A. General Scholastic Aptitude 11. 57 5. 43 High Average Low 82. 99 Legend: APTITUDE LEVEL in MPS by NCAE DOMAINS: HIGH Above 75% AVERAGE 50% to 74% LOW 0% to 49%
 2.")
PERCENTAGE DISTRIBUTION OF EXAMINEES BY APTITUDE LEVEL B. Technical and Vocational Aptitude (TVA) 2. 10 19. 09 High Average Low 78. 81 Legend: APTITUDE LEVEL in MPS by NCAE DOMAINS: HIGH Above 75% AVERAGE 50% to 74% LOW 0% to 49%
 2. 30 16.")
PERCENTAGE DISTRIBUTION OF EXAMINEES BY APTITUDE LEVEL C. Non–Verbal Ability (NVA) 2. 30 16. 59 High Average Low 81. 11 Legend: APTITUDE LEVEL in MPS by NCAE DOMAINS: HIGH Above 75% AVERAGE 50% to 74% LOW 0% to 49%
 MEAN PERCENTAGE SCORE PUBLIC VS")
PUBLIC SCHOOLS VS. PRIVATE SCHOOLS Mean Percentage Score (MPS) MEAN PERCENTAGE SCORE PUBLIC VS PRIVATE 60. 00 50. 00 40. 00 30. 00 20. 00 10. 00 Public Private GSA 34. 23 40. 79 TVA 43. 55 54. 24 NVA 41. 10 50. 98 LRA 31. 10 37. 16 AT 35. 62 43. 24

Mean Performance of Junior High School Students in NCAE Domains and their Immediate Plan after Graduation What is your immediate plan after completing Grade 9? Legend A. Proceed to Grade 10 B. Enroll in an alternative learning school C. Enroll in a technical-vocational course D. Go into a small scale business / be self-employed E. Work part-time F. Work abroad G. Join show business / modelling industry H. Help in my family's business I. Rely on the decision of my parent(s) / guardian(s) J. I don't know K. None of the above No Response N % 1377615 41968 47542 19170 23804 23945 11257 35649 52125 20403 16665 81. 35 2. 48 2. 81 1. 13 1. 41 0. 66 2. 11 3. 08 1. 20 0. 98 23294 1. 38

Mean Performance of Junior High School Students in NCAE Domains and their Immediate Plan after Graduation
")
2015 NCAE Results on the Occupational Interest Inventory for Students in Secondary Schools (OIISSS) of Examinees vis-a-vis Highly In-Demand Occupations by Industry per Region

SOURCE OF DATA Project Jobs. Fit: DOLE 2020 Vision Summary of Findings and Recommendations Can be accessed thru: http: //ble. dole. gov. ph/ble. d ole/downloads/Publications /Final. Report. pdf

Project Jobsfit: The DOLE 2020 Vision Report - Published in 2010; updated in 2013 - Its main goal is to identify from six to ten years beyond 2010 the preferred skills in priority industries in all regions nationwide that must be produced by putting together a robustly flexible map to guide stakeholders in addressing the talent mismatch.
 to Dep. ED ü ü Information dissemination:")
Significance of the Labor Market Information (LMI) to Dep. ED ü ü Information dissemination: trends, indemand, hard-to-fill Students School officials Parents Community Career counselling Students Ø To avoid job mismatch Ø To ensure employment after graduation
 Agribusiness 2. Cyberservices 3. Health and Wellness 4.")
Top 12 Key Employment Generators (KEGs) Agribusiness 2. Cyberservices 3. Health and Wellness 4. Hotel, Restaurant and Tourism 5. Mining 6. Construction 7. Banking and Finance 8. Manufacturing 9. Ownership Dwellings and Real Estate 10. Transport and Logistics 11. Wholesale and Retail Trade 12. Overseas Employment 1.
 Emerging Industries Creative Industries 2. Diversified/ Strategic Farming and Fishing 3. Power")
Four (4) Emerging Industries Creative Industries 2. Diversified/ Strategic Farming and Fishing 3. Power and Utilities 4. Renewable Energy 1.

PERCENTAGE DISTRIBUTION OF EXAMINEES BY FIELD OF OIISSS NATIONAL
 1. 2. 3. 4. 5.")
Top 5 Most Inclined/ Preferred Occupational Fields (National Level) 1. 2. 3. 4. 5. Spiritual Vocation Natural Sciences Community Services Computers and Technology The Arts

Summary of Highly In-demand Occupations Source: Project Jobs. Fit Regional Consultation A. Key Employment Generators (KEGs) Sector In-demand Occupations 1. Agri-business Animal Husbandry Agricultural Economist Aqua-culturist Coconut farmer Entomologist Farmer (Fruit, Vegetable and Root Crop) Horticulturist Pathologist 2. Health, Wellness and Tourism Nurse Herbologist Optician Optometrist

Source: Project Jobs. Fit Regional Consultation Summary of Highly In-demand Occupations Sector In-demand Occupations 3. Hotel and Restaurant & Tourism Front Office Agent/ Attendant Baker Food Server and Handler/ Food and Beverage Service Attendant/ Waiter Room Attendant/ Housekeeping Services Reservation Officer and Other Frontline Occupation Tour Guide 4. Construction Fabricator Pipefitter Welder 5. Banking and Finance Operations Manager Teller

Source: Project Jobs. Fit Regional Consultation Summary of Highly In-demand Occupations Sector In-demand Occupations 6. Manufacturing Electric Technicians Finance and Accounting Manager Food Technologist Machine Operator Sewer 7. Ownership Dwellings and Real Estate Building Manager Construction Worker Foreman Mason Welder Real Estate Broker/ Agent Marketer

Source: Project Jobs. Fit Regional Consultation Summary of Highly In-demand Occupations Sector In-demand Occupations 7. Transport and Logistics Checker Maintenance Mechanics Stewardess 8. Wholesale and Retail Trade Merchandiser/ Buyer/ Salesman/ Saleslady/ Promodizer

Source: Project Jobs. Fit Regional Consultation Summary of Highly In-demand Occupations B. Emerging Industry Sector In-demand Occupations 1. Creative Industries Broadcast Engineer Video Editor Video Graphic Artist (Animator) Visual Artist Designer 2. Diversified/ Strategic Farming and Fishing Fisherman Aqua culturist Horticulturist Farmer 3. Power and Utilities Electrical Control Operator Equipment Operator Electrical Technician Mechanic 4. Renewable Energy Checker Loader

NCR

PERCENTAGE DISTRIBUTION OF EXAMINEES BY FIELD OF OIISSS NCR

Top 5 Most Inclined/ Preferred Occupational Fields in NCR 1. 2. 3. 4. 5. Spiritual Vocation Natural Sciences Computers and Technology Community Services The Arts
 Source: Project")
Summary of Highly In-demand Occupations in NCR A. Key Employment Generators (KEGs) Source: Project Jobs. Fit Regional Consultation KEGs In-demand Occupations 1. Cyberservices Accountants, HR Analysts, Financial Accountants, Technical Support Engineers, Autocad Operators, Programmers, Systems Analyst, Legal Researchers, Legal Analysts, Entry Level Animators, Directors, etc. 2. Hotel and Restaurant Culinary Chefs, Waiters, Waitresses, Commercial Cooks and Butlers, Tour Guides, and Frontline Occupations 3. Construction Welders, Carpenters, Civil Engineers, Design Engineers, Electrical Engineers, Fabricators, Heavy Equipment Operators, Insulators, Masons, Master Plumbers, Pipe Fitters, etc.
 Source: Project")
Summary of Highly In-demand Occupations in NCR A. Key Employment Generators (KEGs) Source: Project Jobs. Fit Regional Consultation KEGs In-demand Occupations 4. Health and Wellness Nurses, Doctors, Medical Technologists, Radiologists, Laboratory Technicians, Pharmacists, Caregivers, Caretakers, and Surgeons 5. Aviation Pilots and Aircraft Mechanics

Summary of Highly In-demand Occupations in NCR Source: Project Jobs. Fit Regional Consultation B. Emerging Industry Sector In-demand Occupations 1. Creative Industries Broadcast Engineers, Video Editors, Video Graphic Artists (Animators), Visual Artist Designers 2. Ownership Dwellings & Real/Retirement Estates Real Estate agents/brokers, Tour Guides, Marketers, Welders, Carpenters, Civil Engineers, Design Engineers, Electrical Engineers, Fabricators, Heavy Equipment Operators, Insulators, Masons, Master Plumbers, Pipe Fitters, Riggers, Safety Engineers, etc.

- Slides: 37