Recent Trends in ICT Developments Global ICT developments

Recent Trends in ICT Developments

Global ICT developments, 2003 -2013 • • There about 6. 8 billion mobile-cellular subscriptions The challenge is to identify those who are still left without access to ICTs
 and")
Active mobile-broadband subscriptions, world and by level of development, 2007 -2013, penetration (left) and annual growth (right) • 2 billion mobile-broadband subscriptions • Mobile broadband has been the fastest growing market

Active mobile-broadband subscriptions, by region and level of development, 2013 • 75% penetration in developed countries • 20% penetration in developing countries
, total (left) and by end-user device (right) •")
Mobile data traffic, 2012 -2017 (forecasts), total (left) and by end-user device (right) • Cisco forecasts that global mobile data traffic will increase 13 -fold between 2012 & 2017. • Two-thirds of this data traffic will be exchanged through smart phones.
-broadband subscriptions, world and by level of development, 2003 -2013, penetration (left) and")
Fixed (wired)-broadband subscriptions, world and by level of development, 2003 -2013, penetration (left) and annual growth (right) • Fixed broadband subscriptions are growing at a 10% annual average • Worldwide-growth is reducing due to slower growth in developed countries • Growth in developing countries continues at double-digit rates.
-broadband subscriptions, by region and level of development, 2013 • Fixed-network infrastructure is")
Fixed (wired)-broadband subscriptions, by region and level of development, 2013 • Fixed-network infrastructure is less deployed in developing countries. • In Arab States, number of subscriptions is one-third the world average. • The fixed-broadband divide between developed and developing regions remains substantial.
")
Households with Internet access, world and by level of development, 2003 -2013, penetration (left) and annual growth (right) • The number of households with Internet access is increasing in all regions, but large differences persist between developed and developing countries • Penetration rates set to reach almost 80 percent in the former compared to 28 percent in the latter

Households with Internet access, by region and level of development, 2013 • The gap between Africa and Asia is substantial • There are 1. 1 billion households worldwide that are not yet connected to the Internet, 90 percent of which are in the developing world.
")
Individuals using the Internet, world and by level of development, 2003 -2013, penetration (left) and annual growth (right) • Household connections are key for ensuring more inclusive and frequent Internet availability. • People can also access the Internet in other locations when household access is not available. This is particularly the case in rural areas of developing countries.

Individuals using the Internet, world and by level of development, 2003 -2013 • In Africa, the internet-user penetration has doubled in the last 4 years • This trend is largely driven by the emergence of mobile-broadband services • Arab States penetration rate is slightly below world average

The ICT gender gap – Men and Women Online • There is a gender gap in the use of computers, mobile phones and the Internet. • This gender gap is more prevalent in developing than developed countries.
")
The ICT Development Index (IDI)
 is a composite index combining")
Definition and Background • The ICT Development Index (IDI) is a composite index combining 11 indicators into one benchmark measure that serves to monitor and compare developments in information and communication technology (ICT) across countries. • The IDI was developed by ITU in 2008 and first presented in the 2009 edition of “Measuring the Information Society”. • It was established in response to ITU Member States’ request to develop an ICT index and publish it regularly.

Objectives Main objectives of the IDI are to measure: • The level and evolution over time of ICT developments in countries and relative to other countries; • Progress in ICT development in both developed and developing countries: the index should be global and reflect changes taking place in countries at different levels of ICT development; • The digital divide, i. e. differences between countries with different levels of ICT development; • The development potential of ICTs or the extent to which countries can make use of ICTs to enhance growth and development, based on available capabilities and skills.

Conceptual Framework The ICT development process, and a country’s transformation to becoming an information society, can be depicted using the following three-stage model: Stage 1: ICT readiness (reflecting the level of networked infrastructure and access to ICTs) Stage 2: ICT intensity (reflecting the level of use of ICTs in the society) Stage 3: ICT impact (reflecting the result/outcome of efficient and effective ICT use).

Conceptual Framework Three stages in the evolution towards an information society Advancing through these stages depends on a combination of three factors: - 1. The availability of ICT infrastructure, 2. Access a high level of ICT usage, 3. The capability to use ICTs effectively.

IDI Sub-Indices Based on this conceptual framework, the IDI is divided into the following three sub-indices: • Access sub-index: Captures ICT readiness, and includes five infrastructure and access indicators. • Use sub-index: Captures ICT intensity, and includes three ICT intensity and usage indicators. • Skills sub-index: Captures ICT capability or skills as indispensable input indicators.

IDI Indicators, Reference Values and Weights
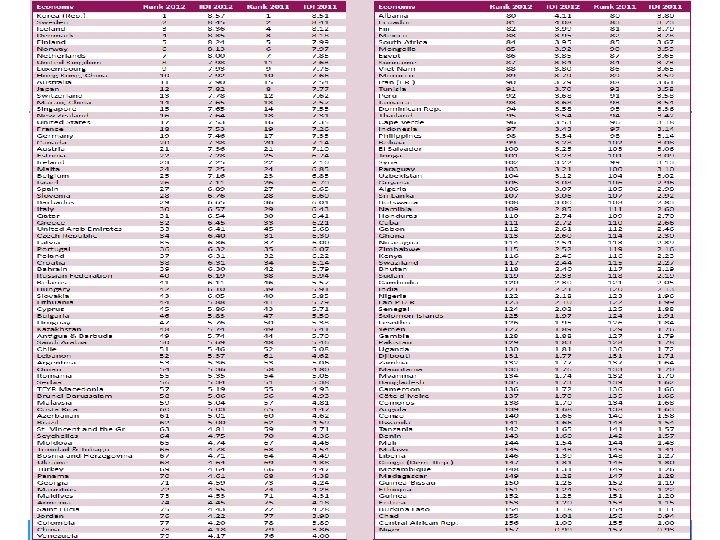
, 2011 and 2012 in Some Selected Countries Country Korea (Rep.")
ICT Development Index (IDI), 2011 and 2012 in Some Selected Countries Country Korea (Rep. ) Singapore United Arab Emirates Lebanon Jordan Morocco Tunisia Syria Sudan Yemen Niger 2012 Rank IDI 1 8. 57 15 7. 65 33 6. 41 52 5. 37 76 4. 22 89 3. 79 91 3. 7 102 3. 22 119 2. 33 127 1. 89 157 0. 99 2011 Rank IDI 1 8. 51 14 7. 55 45 5. 68 61 4. 62 77 3. 90 89 3. 59 92 3. 58 99 3. 13 118 2. 19 129 1. 76 157 0. 93

Thank you for your attention.

Reference • Measuring Information Society, 2013, International Communication Union, Geneva (http: //www. itu. int/en/ITUD/Statistics/Documents/publications/mis 2013/MIS 2013_with out. Annex_4. pdf).
- Slides: 23