Overview of Alevel Our A level specification Geography


 Divides the economically richer countries in the ‘North’ with")

 HPI =Experienced well being (EW) x Life expectancy(LE) Ecological footprint(EF)")
 Takes into account three factors: life expectancy, level of education")
 The monetary ( economic)value of all goods and services")
 Describe people’s quality of life. It")


: the monetary value of all goods and")
Note the only dip on the graph is in")
")


 • https: //www. youtube.")

")


 Takes into account three factors:")
: Composite measure( i. e using more than")

: • Relatively ‘new’ measure of sustainable well")


 E HPI =")


- Slides: 49
Overview of A-level Our A level specification Geography Content overview Dynamic Landscapes 1. Tectonic Processes and Hazards 2. Landscape Systems, Processes and Change (Either 2 A: Glaciated Landscapes or 2 B: Coastal Landscapes) Physical Systems and Sustainability 5. The Water Cycle and Water Insecurity 6. The Carbon Cycle and Energy Security Dynamic Places 3. Globalisation 4. Shaping Places (Either 4 A: Regenerating Places or 4 B: Diverse Places) Global development and connections 7. Superpowers 8. Global Development and Connections (Either 8 A: Health, Human Rights and Intervention or 8 B: Migration, Identity and Sovereignty)
Overview of A-level Our A level specification Geography Assessment overview Paper 1 - 30% of qualification Assessing topics 1, 2, 5, 6 and 7 and geographical skills q q 2 hours and 15 minutes 105 marks Paper 2 - 30% of qualification Assessing topics 3, 4, 8 and 9 and geographical skills q q Paper 3 - 20% of qualification Synoptic Investigation q q 2 hours and 15 minutes 105 marks Coursework - 20% of the qual. Independent Investigation q 70 marks q Internally assessed, externally moderated written report (3000– 4000 words) 70 marks
Getting Started: this is what we will cover this year: Water Cycle and Water Insecurity : CORE Carbon Cycle and Energy Security : CORE Superpowers: OPTION Health, Human Rights and Intervention : OPTION
Topic 8: Option 8 A Lesson 1 Health, Human Rights and Intervention
The topic is based around four enquiry questions: • Enquiry question 1: What is human development and why do levels vary from place to place? • Enquiry question 2: Why do human rights vary from place to place? • Enquiry question 3: How are human rights used as arguments for political and military intervention? • Enquiry question 4: What are the outcomes of geopolitical interventions in terms of human development and human rights?
What kind of questions will I be expected to answer in the exam? • This topic will be examined in Paper 2 ( which is worth 30% of the A level) • Section C • Q 5: Topic 8 A : Health, Human Rights and Intervention • It will typically consist of : • Short answer skills related questions ( e. g. 1 , 3 markers) • Slightly longer levels based questions ( e. g. 6, 8 markers) • A longer essay ( 20 marker) TOTAL = 38 marks
Lessons 1 -2: Objectives To appreciate that concepts and measures of human development are complex and contested in different parts of the world SKILLS: To analyse these differences using a wide selection of geographical skills including global distribution maps , ranked data sets, scattergraphs , correlation techniques and the Gini Coefficient
Enquiry question 1: What is human development and why do levels vary from place to place? • SPECIFICATION CONTENT • Key idea: • 8 A. 1 Concepts of human development are complex and contested. • Detailed content: • a. Human development has traditionally been measured using the growth of GDP as an end in itself but the relationship between human contentment and levels of wealth and income is complex (‘Happy Planet Index’) and many dominant models are contested (Sharia law or Bolivia under Evo Morales).
Starter • Walk around the room and look at the global distribution maps. • Discuss with a partner what you think each map shows. • Are there any similarities or differences? • Are these effective ways of measuring development? • In your opinion which one ( if at all) is the best?
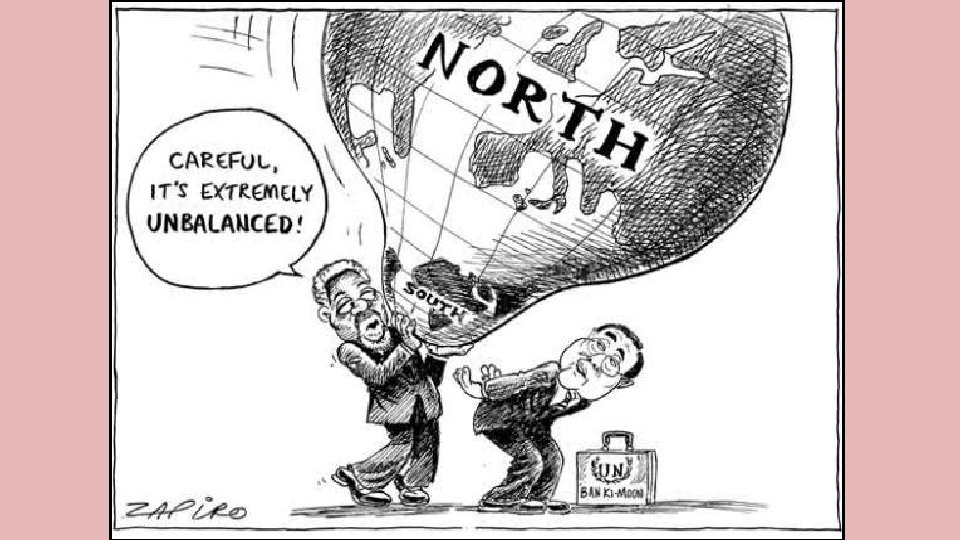
Brandt Line( North/ South Divide) Divides the economically richer countries in the ‘North’ with the economically poorer countries in the ‘South’
Global Distribution to show Mobile Phone Use
Happy Planet Index (HPI) HPI =Experienced well being (EW) x Life expectancy(LE) Ecological footprint(EF)
HDI (Human Development Index) Takes into account three factors: life expectancy, level of education and economic growth(GNI per capita)
GDP ( Gross Domestic Product) The monetary ( economic)value of all goods and services produced by one country in one year.
• PQLI (Physical Quality of Life Index) Describe people’s quality of life. It uses the average of three social indicators: life expectancy, literacy rates infant mortality
Global Distribution of Life Expectancy (Average expected lives of babies born in 2014 on the map below)
WHITEBOARD PAIRED THINKING • 1. What do you think the difference is between: • Standard of living and Quality of life ? • 2. How do you think you can define : • Human development ? • Human Welfare ? • 5 mins…
KEY TERMS • Standard of living – is the economic level of a persons daily life eg. How much they earn, car ownership etc… • (N. B this is ‘quantitative’- objective-easily measured) • Quality of life – How good someone’s life is eg measured by the quality of house or environment, access to education, security. • (N. B this is ‘qualitative’ –subjective- based on personal opinion )
KEY TERMS • Human Development : The process of enlarging people’s freedoms and opportunities as well as improving their well- being and quality of life. It does not just involve levels of economic wellbeing but other factors such as life expectancy, infant and maternal mortality, literacy and healthcare • Human Welfare: The health, happiness, good fortune, prosperity etc of a person or group
So how easy is it to measure Human Development?
Measuring Development using GDP Map to show Real GDP Growth Rate 2016:
Measuring development - GDP • One of the most common ways of measuring development in the past has been by the use of Gross Domestic Product (GDP) per head. GDP measures how wealthy a country is. • However, average GDP/head has its shortcomings: • it hides regional variations • it fails to take into account local costs of living • it does not measure the social and environmental cost of development. • Therefore in more recent years it has been widely recognised that development involves MUCH MORE THAN ECONOMIC PROGRESS!
KEY TERMS: • GDP( Gross Domestic Product): the monetary value of all goods and services produced by one country in one year. (It is then converted to US$ to allow for easy comparisons between countries and is then divided by the population to give a ‘per capita’ ( person) value. ) • GNI ( Gross National Income): the total wealth created by a country, including income from exports ( minus taxes and debts). Since currency exchange rates vary, this measure can change considerably over time.
The Growth of Global GDP(1960 -2015)Note the only dip on the graph is in 2008 -9, after the global financial crisis (See Pearson fig 3 p. 151)
Measuring Human Development -Income Inequality: Global Distribution of Gini Coefficient Values (2009)
Measuring Economic Inequality: ‘The Gini Coefficient’ http: //www. bbc. co. uk/news/blogs-magazine-monitor-31847943 • 1. To assess the degree of economic inequality within any country an indicator known as the GINI COEFFICIENT is used. • 2. It measures the extent to which income distribution deviates from ‘perfect equality’ ( i. e. everyone has the same income) • 3. A Gini Coefficient score of 0 indicates perfect equality whilst a score of 1 indicates maximum inequality ( i. e one person has all the income). • 4. In general, the world’s poorest countries are the most unequal, and in recent years, with a few exceptions such as Greece, wealthier countries have also become more unequal.
The Gini Coefficient For ‘Richer countries’ Late 2000 s The lower the number is to 0 the more equal the income distribution is.
Ways to measure development: GAP MINDER Gap minder: (Hans Rosling) • https: //www. youtube. com/watch ? v=jbk. SRLYSojo (Watch the video) https: //www. ted. com/talks/hans_r osling_shows_the_best_stats_you_ ve_ever_seen#t-220711 • https: //www. gapminder. org/tool s/#_locale_id=en; &charttype=bubbles • (Play with it yourself!)
What does this scatter graph show?
Correlation between development indicators • One indicator will correlate ( have a close relationship) with other similar indicators…. . Eg. The scattergraph shows a positive correlation as a country with a high GDP such as Canada is likely to have high adult literacy levels as the country is more likely to be able to provide education. Conversely a country with a low GDP such as Sierra Leone has very low adult literacy levels as the country is so poor that education is not seen as a priority……
Skills Objective Task 1: • Using the Worked example A and info from table 5. 1 and fig 5. 2, draw a scattergraph plotting two variables of development e. g. GNI per capita and health expenditure per capita against each other to determine the relationship between wealth and human contentment before exploring any anomalous categories. • You have 10 minutes to complete the graph including the line of best fit. (Ref: Essential Maths Skills for AS/A Level Geography Helen Harris p 57 -58 Also see Hodder Skills Focus p. 182)
Economic development doesn’t always improve quality of life though. Why?
WHITEBOARD PAIRED THINKING • In your view what are the • ‘Goals for Human Development / levels of contentment ‘? • Key Discussion points: • What factors ( social, economic, environmental, political? ) make people feel content ? • Do you think these views are universally shared?
Brainstorm……. . eg…. . • Improvements in environmental quality • • ‘Goals Improvements in health for Human Development’ • High levels of life expectancy Economic growth • • • Improvements in education Understanding and assertion of basic human rights
Another measure of development : HDI (Human Development Index) Takes into account three factors: life expectancy, level of education and economic growth(GNI per capita) https: //www. youtube. com/watch? v=g. Ap. Xue. VX-vs
KEY TERM: • HDI( Human Development Index): Composite measure( i. e using more than one indicator)to create a single index figure for each country based on information from three indicators: i)Life expectancy, ii)GDP per capita and iii)Education ( based on literacy and average length of schooling)
n n n The HDI is viewed as a more reliable and accurate measure of development than GDP as it is a much broader measure using three different indices of well-being : 1)Life expectancy 2) Literacy levels ( and years of schooling) 3) Economic growth ( per capita income) These statistics are also collected frequently and widely at a national level. Because of this HDI can be used to monitor development progress over a year or period of years. • Developed countries such as Canada have the highest HDI, with values of over 0. 9 • Developing countries such as Afghanistan, Burkina Faso and Guinea are at the bottom with values of less than 0. 5 • *As with GDP/head national HDIs can conceal inequalities within a country*
KEY TERM: • Happy Planet Index (HPI): • Relatively ‘new’ measure of sustainable well being which shows the extent to which countries deliver long, happy and sustainable lives for the people who live in them. It is based on three indicators: i) Life expectancy (LE)ii) Experienced well- being(EW) and iii) Ecological footprints (EF) • HPI = EW (Experienced well being) x LE ( life expectancy) • EF ( Ecological footprint) • https: //www. youtube. com/watch? v=s. ZPYI 8 Bfn. Bs • *NOTE THAT BOTH HDI AND HPI ARE BASED ON 3 VARIABLES AND THAT THEY HAVE LIFE EXPECTANCY IN COMMON*
ECOLOGICAL FOOTPRINT How much of the Earth’s resources does your lifestyle require? This is called your ‘Ecological Footprint’ ‘ A measure of the area of land or water required to provide a person or society) with the energy, food and resources they consume and the waste they produce. ’ http: //www. footprintnetwork. org/resources/footprint-calculator/ ( Have a go in your spare time!!) What about thinking about this on a GLOBAL SCALE? . . .
Global Topological Map to show Land Area : Ecological Footprint
Who has the largest and smallest footprints? • The countries with the largest ecological footprints are the United States, China and India. • Each person in the USA has a footprint five times bigger than the world average…………… and ten times what would be sustainable!!! • Unlike people in the USA, people in China and India use well below the world average amount of resources- but the large populations all together make the footprint huge!!
HPI Happy Planet Index ( Hodder Fig 10. 3 Page 176) E HPI = EW x LE EF
Skills Objective Task 2 1. Locate the countries listed in the table on the worksheet (Pearson Table 4. 2 p. 189)and on the world outline map colour the top 10 countries from all measures in one colour, and the bottom 10 countries in another colour. Describe and explain the pattern shown by your completed map. 2. Considering the countries listed, suggest the advantages and disadvantages of each measure shown in the table below. You may wish to investigate these measures further. (Ref: Pearson P. 189) Skills Objective ( 1) To be able to identify trends using different types of maps, e. g. choropleth mapping and to make comparisons of different measures of development using ranked data
EXTENSION TASK : PAIRED/ GROUP WORK Research each country below and rank them in accordance with the following development categories: Country Bangladesh Bolivia Brazil Cambodia China Costa Rica Ethiopia Iraq Ivory Coast Japan Nigeria Singapore Turkey UK USA Vietnam Zimbabwe GNI per HDI head ($US) Birth rate Death Infant (per rate (per mortality 1, 000 per (per 1, 000 year) live births per year) Number of Life Literacy doctors (per expectancy rate (%) 1, 000 people) % of HPI population with access to safe water
Task 3 – Measuring development • For each method, explain it, summarise the pros and cons of the method. Then rank from most effective to least effective. See worksheet provided. • Justify why you chose these ranks. Method GDP HDI HAPPY PLANET INDEX GINI COEFFICIENT Explanation Pros Cons Rank
Task 4 : Written Summary : HPI • 1. Read over pages 174 -176 in Hodder then summarise the factors involved in deciding how the Happy Planet Index is calculated. • 2. Evaluate ( i. e highlight strengths and weaknesses) the reasons why countries show up differently in terms of development between the HPI and other development indicators like HDI.
Task 5: Global distribution maps and research • 1. Compare the global views provided by figs 10. 1 (p. 174)10. 3 • ( p. 176) and 10. 9(p. 179) in Hodder Book 2. (TIP: Include names of countries/ continents in your answer- try and describe patterns by using named examples) • 2. With reference to examples ( i. e Sharia Law and Bolivia under Morales) explain how differences in beliefs, values, morals and codes of conduct can lead to very different perceptions as to what human development is all about. • (Ref Hodder p. 177 and Pearson p. 190 - see worksheets) https: //www. theguardian. com/commentisfree/2014/oct/14/evomorales-reelected-socialism-doesnt-damage-economies-bolivia
Plenary • Make your own development tree: • http: //www. zolabo. com/projects /hdi/ What surprised you?