Nutrient Cycles in Marine Ecosystems Inputs and outputs


 19. 345 sodium 10. 752")

 • important for the chemistry")


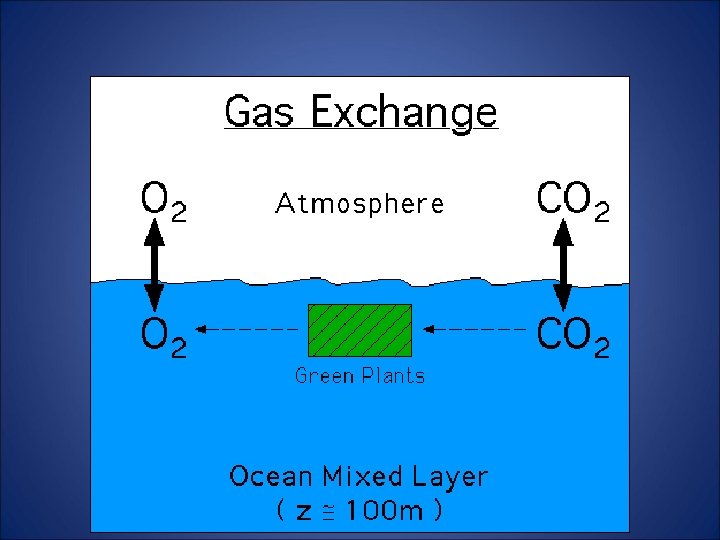
 and dissolved gases (oxygen and carbon")


 of an area is determined by the rate and the duration")

 provide the ultimate combination")


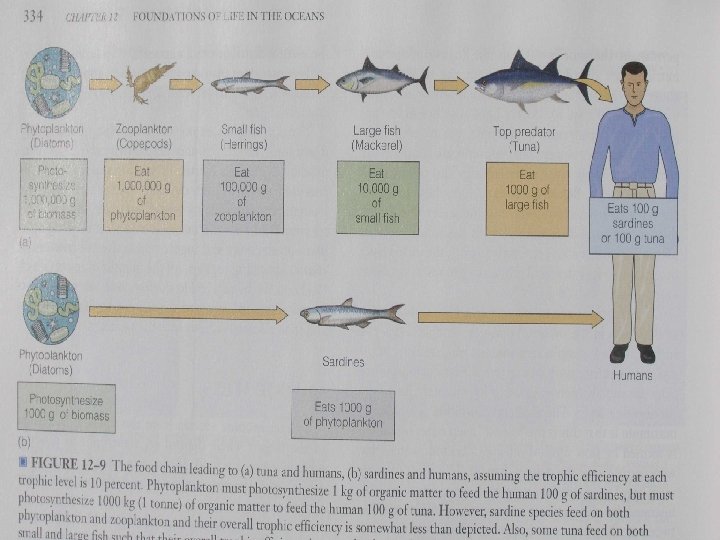

 in grams")


- Slides: 69
Nutrient Cycles in Marine Ecosystems Inputs and outputs to the reservoir of dissolved nutrients The biological uses of nutrients Nutrient Availability and Productivity
Nutrient: chemical that an organisms needs to live and grow (or a substance used in an organisms metabolism) which must be taken from the environment
Demonstrate an understanding that there is a reservoir of nutrients dissolved in the surface layer of the ocean
• Algae require light for photosynthesis – Light intensity decreases with depth so photosynthesis is restricted to the surface layer – Known as the photic zone • Varies from 30 m to 150 m (much less in turbid water) • Surface layer contains many ions
Remember These? Ion chloride Mean concentration in seawater (ppt) 19. 345 sodium 10. 752 sulphate 2. 701 magnesium 1. 295 calcium 0. 416 hydrogen carbonate 0. 145
• These ions, together with nitrate and phosphate ions, form a reservoir of nutrients for the growth of algae and other primary producers – Nitrate and phosphate ions occur at loc concentrations in sea water • Mean concentration of nitrate is 0. 5 ppm • Mean concentration of phosphate is 0. 07 ppm
The Sea-Surface Microlayer • incredibly thin (few hundred µm) • important for the chemistry of the ocean • covers 71% of surface of the planet – therefore it is the largest single ecosystem • not well understood (difficult to sample such a tiny vertical section of the water column) • critical link between ocean and atmosphere • Receives and transmits – – energy gases solids collects matter transported by winds from above and by water below
The Sea-Surface Microlayer • The upper meter of seawater is divided in to sublayers, each with its own biological and chemical features. Within the surface layer, (the upper 60 cm), the first 0. 05 mm contains an especially dense concentration of minerals, organic chemicals, protozoans and micro-organisms. The upper 70 mm has dense concentrations of slightly larger organisms, including fish eggs, fish larvae, and crustaceans. Larger, floating jellyfish and seaweeds are found in the upper 30 cm. There are many transient creatures that move up and down in tune to the sunlight.
The Sea-Surface Microlayer • The plants and animals that live in the water excrete many organic compounds, such as amino acids, proteins, and fatty acids that serve as nutrients for bacterial growth. These rise to the surface where they are concentrated the thin organic skin of the water. This happens in fresh water as well as salt water. • When aquatic organisms die, the oils in their bodies may float to the surface before they completely decompose. • The thin layer of oily material on the surface of the sea is an important part of the water cycle as it helps control the rate of evaporation. It is also a highly nutritious food source for many species of microscopic plants and animals (ie plankton). • On calm days we say the sea is "slick calm" or "oily calm" because the microscopic layer of oil is evenly distributed on the surface.
The Sea-Surface Microlayer • Wind pushes the oil into long ribbons of calm water known as "wind slicks" or "wind rows. " – You can see these on most days when looking at the sea from an overlook or from a boat. – Samples show the plankton and nutrients are thousands of times more concentrated in the windrows than in water only a few cm deeper or in adjacent areas. • Unfortunately, the oily surface of the sea is also the first to receive pollutants from the atmosphere. Scientists believe more than 30 per cent of all ocean pollution comes from tiny particles of dust and smoke in the air - often called fallout. • This settles on the most sensitive and vulnerable part of the ocean - its skin. – The pollutants contain pesticides, heavy metals, and industrial and motor vehicle toxins such as sulphuric acid, chlorine, and dioxin.
Wind Slicks • Windslick research link
The Sea-Surface Microlayer • A polluted surface microlayer has the potential to poison much of the complex marine food web, including fish, crustaceans, whales, and seabirds. • Destruction of the microlayer may alter the exchange of materials between the atmosphere and the ocean, thereby affecting global climate. • Oil pollution also floats on the surface of the sea and quickly contaminates this fragile environment with chemical toxins. • Oil, even a very thin layer, spreading over the surface of the water at the same time fish are releasing their floating eggs can devastate their reproductive success
The Sea-Surface Microlayer • Heavy metals, and other toxins, are hundreds of times more concentrated in the surface windrows of the sea than in deeper water. Pesticides are found concentrated millions of times greater than in the rest of the water. • As the ozone layer in the upper atmosphere breaks down from air pollution, ultraviolet radiation increases. This has been shown to have a severe impact on the phytoplankton and the eggs of sea creatures when they concentrate at the surface.
The Sea-Surface Microlayer • Three processes transport matter to the ocean’s surface from below – Molecular diffusion • Slow process due to random motion of all molecules – Convective motion • Vertical circulation of water from transfer of heat – Rising air bubbles • Bubbles created by waves and wind rise through seawater because of their buoyancy • absorb inorganic/organic matter – which is ejected into air when bubble bursts at surface
The Sea-Surface Microlayer • Result of this atmospheric and oceanic flux of material is the enrichment of both dissolved and particulate matter in the surface microlayer • The concentrated materials represent a surface coating that can reduce significantly the transfer of gases and water vapor across the air -sea interface – Influences the chemistry of lowermost atmosphere and uppermost ocean (and possibly, the climate in the long run)
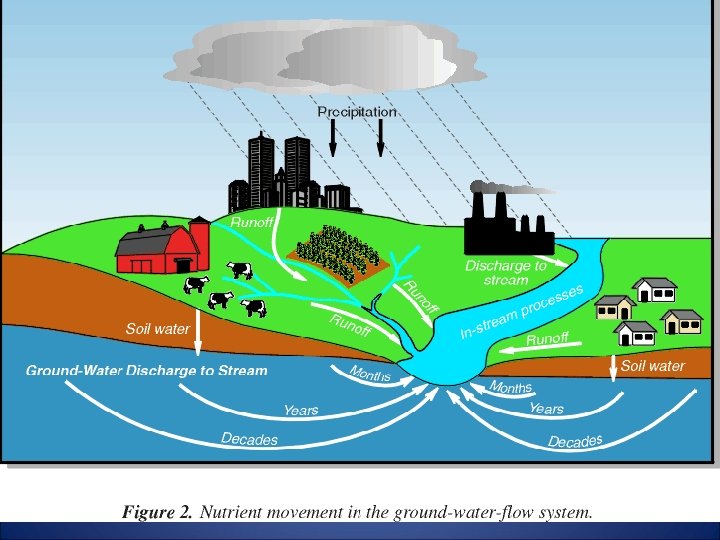
Explain the process by which the reservoir of dissolved nutrients is replenished, including upwelling, runoff from the land, and dissolving of atmospheric gases • Upwelling is the movement of water from deep in the ocean to the surface layer, where the nutrients become available to primary producers – Upwelling brought about by several processes • Deflection of deep water currents upwards • Movement of water away from the coast (due to wind) • Upwelling Animation
Mechanisms that create ocean upwelling • Wind • Coriolis Effect • Ekman Transport
Upwelling refers to deep water that is brought to the surface. Areas of upwelling are created by surface winds that pull water away from an area. This deficit of water on the surface invites water to come up from deeper regions.
To understand upwelling, you must be familiar with how the Coriolis Force affects ocean surface currents. The Coriolis Effect acts on moving water, because it is not attached to the rotating Earth. As water flows over the rotating earth, it appears to deflect to the right in the Northern Hemisphere and the left in the Southern.
• Coriolis Effect link • Coriolis Video
Due to friction between the layers of water in the ocean and the Coriolis Effect, the net result of wind blowing across the surface of the water is transportation of a layer of water 90 degrees to the direction of the wind. This is known as Ekman Transport.
Seasonal upwelling Wind Onshore winds pile water up on shore, thus surface water will be forced downward. This is ‘downwelling’. Wind Offshore winds take water away from shore, thus water from depth will upwell to the surface.
“Upwelled” water also contains nutrients (nitrate, phosphate, silicate) and dissolved gases (oxygen and carbon dioxide) that are not utilized at depth because of a lack of sunlight. Now on the surface, these nutrients and gases help to fuel photosynthesis by small algae called phytoplankton.
Phytoplankton photosynthesize using specialized color pigments called chlorophyll. Thus, “Ocean Color” maps are another way to identify areas of upwelling. Where on this ocean color map are high phytoplankton concentrations?
Even though upwelling areas account for only 1% of the ocean surface, they support 50% of the worlds fisheries.
Productivity (phytoplankton growth) of an area is determined by the rate and the duration of upwelling. • Rate of upwelling • Duration of upwelling determines the total phytoplankton cell size. amount of phytoplankton. small vs. large few vs. many
Classification of upwelling systems in terms of rate and duration: Short High Long DURATION Low RATE Medium After Thurman, H. V. (1994)
-Moderates of upwelling for long duration (8 months or longer) provide the ultimate combination for a large fishery. -With too low or too high a rate, phytoplankton are small, so there is a trophic level between the algae and the fish…. therefore the fish receive less energy.
Stormwater Runoff the most common pollutant of streams, rivers, and oceans.
Demonstrate an understanding that the reservoir of dissolved nutrients is depleted by uptake into organisms in food chains
Explain how productivity may be limited by the availability of dissolved nutrients
General Marine Productivity Primary production is the total amount of carbon (C) in grams converted into organic material per square meter of sea surface per year (gm C/m 2/yr). • Factors that limit plant growth and reduce primary production include solar radiation and nutrients as major factors and upwelling, turbulence, grazing intensity and turbidity as secondary factors. • Only 0. 1 to 0. 2% of the solar radiation is employed for photosynthesis and its energy stored in organic compounds.
• Macronutrients and micronutrients are chemicals needed for survival, growth and reproduction in large and small quantities, respectively. • Upwelling and turbulence return nutrients to the surface. • Overgrazing of autotrophs depletes the population and leads to a decline in productivity. • Turbidity reduces the depth of light penetration and restricts productivity even if nutrients are abundant.
Productivity varies greatly in different parts of the ocean in response to the availability of nutrients and sunlight. • In the tropics and subtropics sunlight is abundant, but it generates a strong thermocline that restricts upwelling of nutrients and results in lower productivity. • High productivity locally occurs in areas of coastal upwelling, in the tropical waters between the gyres, and in coral reefs.
• In temperate regions productivity is distinctly seasonal. • Polar waters are nutrient-rich all year but productivity is only high in the summer when light is abundant.
Variations in Primary Productivity
Mixing plays an important role in the limitation of primary production by nutrients. • Inorganic nutrients, such as nitrate, phosphate, and silicate acid are necessary for phytoplankton to synthesize their cells and cellular machinery. • Because of gravitational sinking of particulate material (such as plankton, dead or fecal material), nutrients are constantly lost from the photic zone, and are only replenished by mixing or upwelling of deeper water. • Summer: increased solar heating, reduced winds leads to vertical stratification (thermocline) – which makes it more difficult for upwellings
Mixing plays an important role in the limitation of primary production by nutrients. – Between mixing events, primary production (and the resulting processes that leads to sinking particulate material) constantly acts to consume nutrients in the mixed layer – In many regions, this leads to nutrient exhaustion and decreased mixed layer production in the summer • Even in the presence of abundant light – not always a limiting factor! • As long as the photic zone is deep enough, primary production may continue below the mixed layer where light-limited growth rates mean that nutrients are often more abundant
Primary productivity varies from 25 to 1250 gm C/m 2/yr in the marine environment and is highest in estuaries and lowest in the open ocean. • In the open ocean primary productivity distribution resembles a “bull’s eye“ pattern with lowest productivity in the center and highest at the edge of the basin. • Water in the center of the ocean is a clear blue because it is an area of downwelling, above a strong thermocline and is almost devoid of biological activity.
• Continental shelves display moderate productivity between 50 and 200 gm C/m 2/yr because nutrients wash in from the land, and tide- and wavegenerated turbulence recycle nutrients from the bottom water. • Polar areas have high productivity because there is no pycnocline to inhibit mixing. • Equatorial waters have high productivity because of upwelling. • Centers of circulation gyres, which occupy most of the open ocean, are biological deserts.
The Sargasso Sea and Vertical Profiles
Remember…. • Although rate of productivity is very low for the open ocean compared to areas of upwelling, the open ocean has the greatest biomass productivity because of its enormous size.
Iron’s Influence • Micronutrient iron (used as cofactor in enzymes and important processes like nitrogen fixation) has been discovered to have a significant role in oceanic primary productivity • Major source of irons to oceans is the dust from the Earth’s deserts (carried through wind) – In regions far removed from deserts or that are not reached by dust carrying winds (eg: North Pacific ocean), lack of iron can severely limit the amount of primary productivity • Known as HNLC (High-Nutrient, Low-Chlorophyll) regions, because the scarcity of iron both limits phytoplankton growth and leaves a surplus of other nutrients • Some scientists have suggested introducing iron to these areas as a means of increasing primary productivity and sequestering carbon dioxide from the atmosphere.
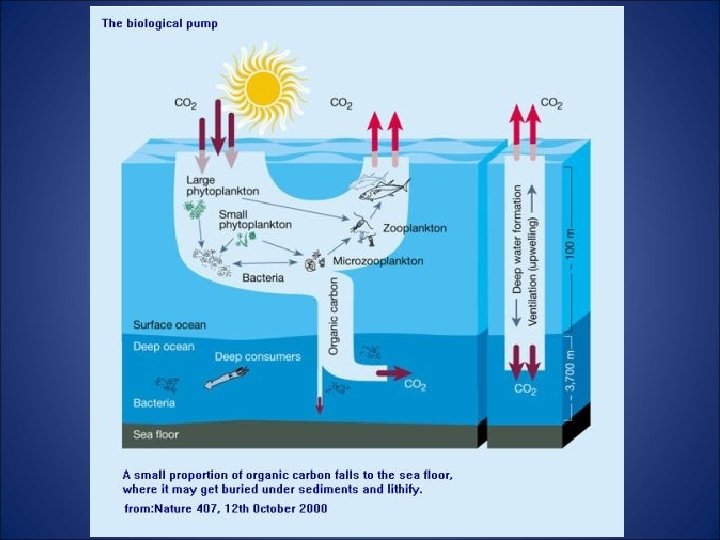
Demonstrate an understanding that the nutrients taken up by organisms in food chains may sink to the sea floor in faeces or after death, may be incorporated into coral reefs, or may be removed by harvesting
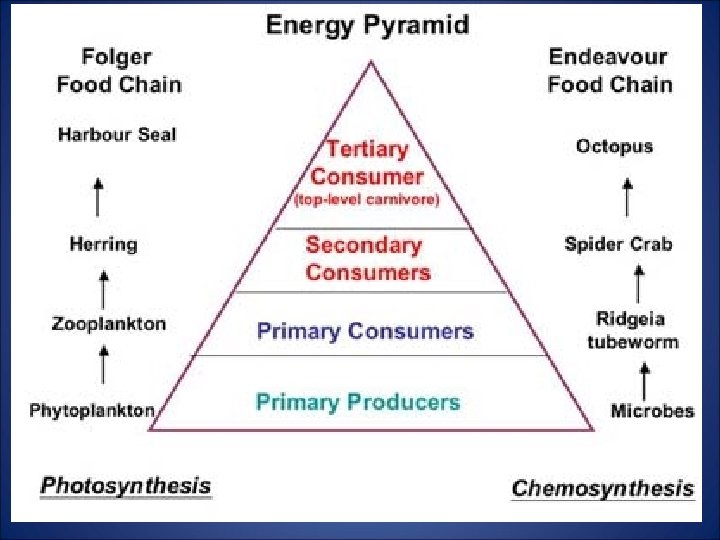
MARINE ENERGY FLOW AND NUTRIENT CYCLES
DETRIVORES AND DETRITUS • Some heterotrophs (e. g. , earthworms, flies, beetles, crabs, sea cucumbers, ants, vultures, hyenas, etc. ) depend on detritus (dead organic material/biomass), rather than live organic material. • Note: animals can be both a herbivore and a detrivore, or a carnivore or omnivore and a detrivore, i. e. , they eat both living and dead organisms.
DETRIVORES AND DETRITUS • In some ecosystems more energy for the support of higher trophic levels in the ecosystem comes from detritus than from living plants and animals (note: this can be true in terrestrial, freshwater and marine ecosystems), with detritus serving as an energy source for an interacting system of herbivores, carnivores and decomposers. E. G. , APHOTIC ZONE
Marine Snow
Marine Snow
DECOMPOSERS • Decomposers play a very important role in mineralisation by breaking down organic substances into inorganic compounds that are again available for reuse by producers.
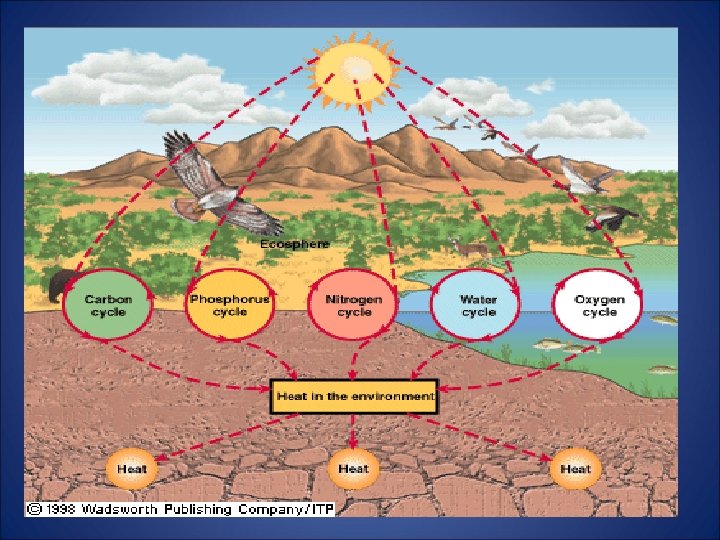
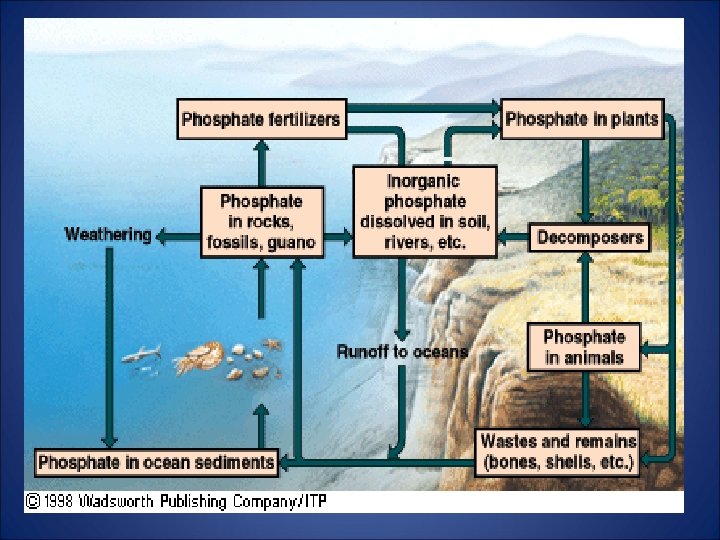
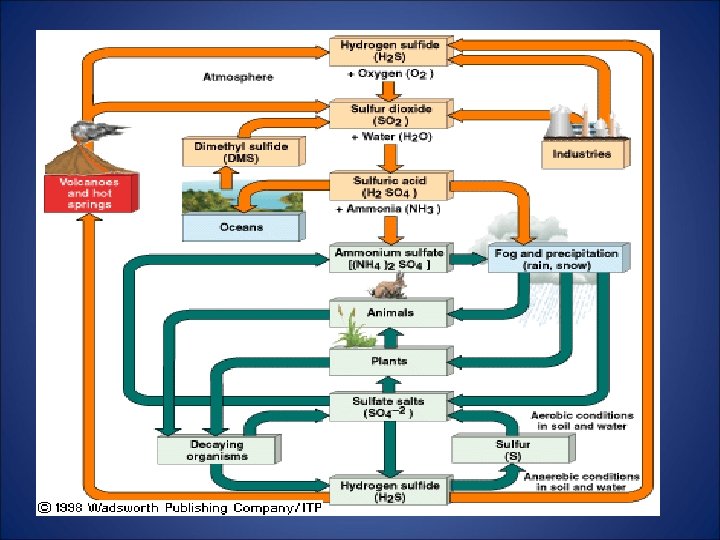
Show that each of the nutrient cycles listed below can be summarized as shown in Fig 4. 1 and state the biological use of each nutrient - nitrogen: which is used to make proteins - carbon: which is used to make all organic materials - magnesium: which is used to make chlorophyll - calcium: which is used to make bones, corals, and shells - phosphorous: which is used to make DNA and bone
Biological Processes Geological Processes Ecology
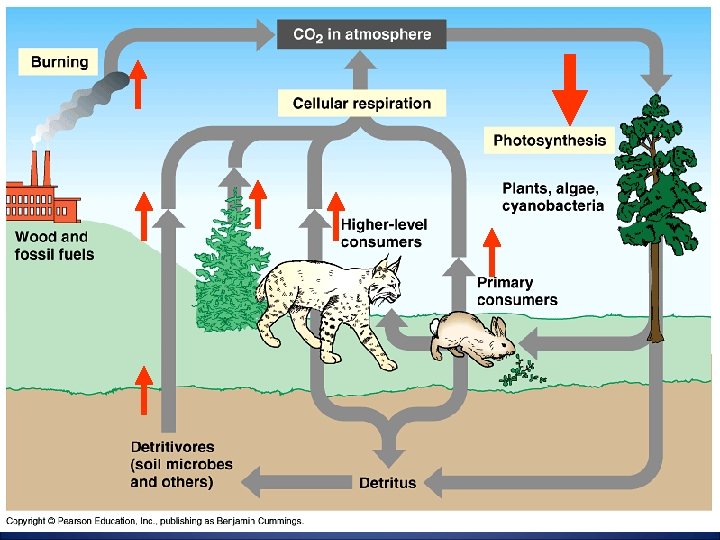
The Carbon Cycle • Key role in Earth’s thermostat – Absorbed by ocean, utilized by plants in photosynthesis, humans in digestion – Sinks (storage) in lithosphere (largest reservoir – limestone and other sedimentary rock), hydrosphere (ocean), atmosphere (CO 2) and in the biosphere (dead animals, wood, plants…) – Released by fires, decomposition, volcanoes, and human respiration
The Oxygen Cycle • Essential for animals – Taken in during respiration – Released by plants in photosynthesis – Disrupted by the same factors that disrupt the carbon cycle • Clear cutting of trees • Increased burning of fossil fuels • Pollution to phytoplankton containing water
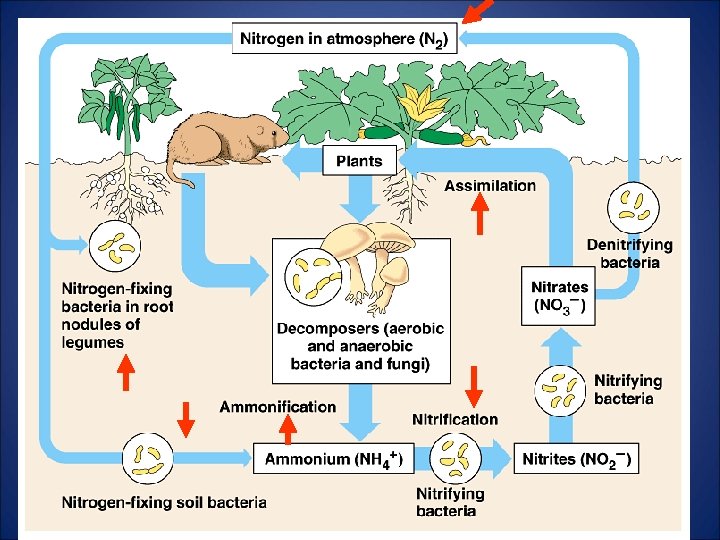
The Nitrogen Cycle • • 78% of troposphere is N 2, 0% utilized in respiration Present in proteins, moves through food chain Most complex cycle Disrupted by – – Burning fuel (releases nitric oxides) Increased use of fertilizer Removal from topsoil Addition to aquatic ecosystems
Conversion of Atmospheric Nitrogen to usage nitrogen N 2 Soil Acid soil bacteria NH 3 NH 4
Nitrogen Cycle • N 2 gas is modified by nitrogen fixing bacteria into ammonia (NH 3) (nitrogen fixation) • Bacteria turn nitrogenous waste and detritus into ammonia (ammonification) • NH 3 is converted into nitrite (N 02) which is used to produce nitrate (N 03) (nitrification) • Other bacteria convert nitrite into gas which enters the air (denitrification)
The Phosphorous Cycle • Very slow process • Found only in sedimentary rocks and water (not in atmosphere) • Released as rocks erode • Travels through food chain • Released by decomposition
The Sulfur Cycle • • • Most stored underground Released by volcanoes and swamps Plants assimilate the sulfur Bacteria break it down 99% of all that reaches atmosphere is by humans (industries, burning fuel, refining petroleum)