Ecosystem Ecology Serengeti at Sunrise Biogeochemistry Energy and

Ecosystem Ecology

Serengeti at Sunrise

Biogeochemistry

Energy and Material Flow in Ecosystems

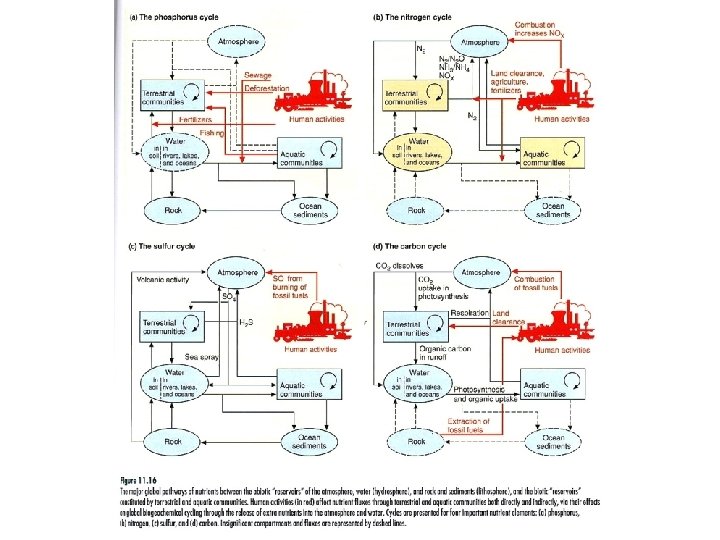
Biogeochemical Cycles Nutrients exist in pools of chemical elements - 3 main compartments where these nutrients exist are: 1) atmosphere - carbon in carbon dioxide, nitrogen in atmospheric nitrogen 2) lithosphere - the rocks - phosphates, calcium in calcium carbonate, potassium in feldspar 3) hydrosphere - the water of oceans, lakes, streams and soil - nitrogen in dissolved nitrate, carbon in carbonic acid

Atmosphere Living Organisms Lithosphere Hydrosphere
 from atmosphere - direct uptake such as")
Nutrients are input to ecosystems via: 1) from atmosphere - direct uptake such as carbon dioxide (photosynthesis) and nitrogen (taken up and fixed by bacteria and blue-green algae); Wetfall (rain, snow, fog) carrying the nutrients and washing them out of the atmosphere; Dryfall - particles directly settle out of the air; 2) from lithosphere - from weathering of rocks - some due to mechanical weathering by freezing and thawing and erosion, most due to chemical weathering by water running over the rocks; 3) from hydrosphere - streamflow carries nutrients into new areas

Living Organisms and Nutrient Cycles • Living organisms are a compartment in which carbon exists in carbohydrates (mainly cellulose) and fats, nitrogen in protein, and phosphorus in ATP

Nutrient Fluxes • For some nutrients in some ecosystems, nutrient fluxes may be in balance so that inputs = outputs • But for other ecosystems and nutrients, the cycle may be out of balance from too much input so that input > output storage • or too much output > input loss

General Scheme for Biogeochemical Cycles Consumers Producers Decomposers Nutrients available to producers Abiotic reservoir Geologic processes

Hydrologic Cycle

Hydrologic Cycle • Evaporation determines the flux of water through the cycle because it is in evaporation that energy is input • The atmosphere holds about 2. 5 cm of water spread evenly over the earth's surface at any one time • 65 cm of rain falls across the earth each year water cycles through atmosphere 25 times a year, each transit takes about 2 weeks • Most of the evaporation on land is due to losses by plants during respiration - 55 x 1018 g while total for land is 59 x 1018

Carbon Cycle

Some Carbon Cycle Numbers • World's terrestrial biota respires about 120 x 109 metric tonnes of carbon per year • Human activities release about 5. 1 to 5. 9 x 10⁹ metric tonnes per year • The observed increase in atmospheric CO 2 is due to about 2. 9 x 10⁹ tonnes per year - which is 39 - 57% of human input • The rest is probably dissolved in the oceans though some is absorbed by terrestrial plants and put into extra biomass. • 1750 atmospheric CO 2 was 280 ppm, 400 ppm in May 2013 • Current estimate is that by 2050 atmospheric CO 2 will reach 660 ppm

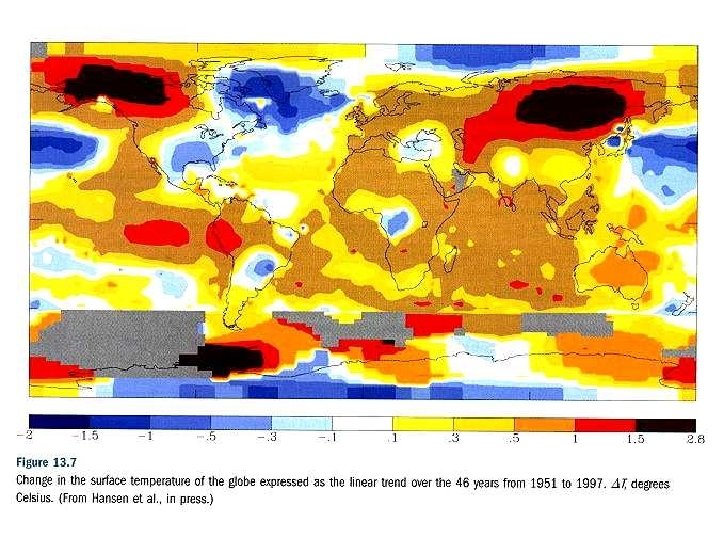
Increase in Atmospheric CO 2 and Global Temperature

Global Carbon Emissions

CO 2 Last 400 K years
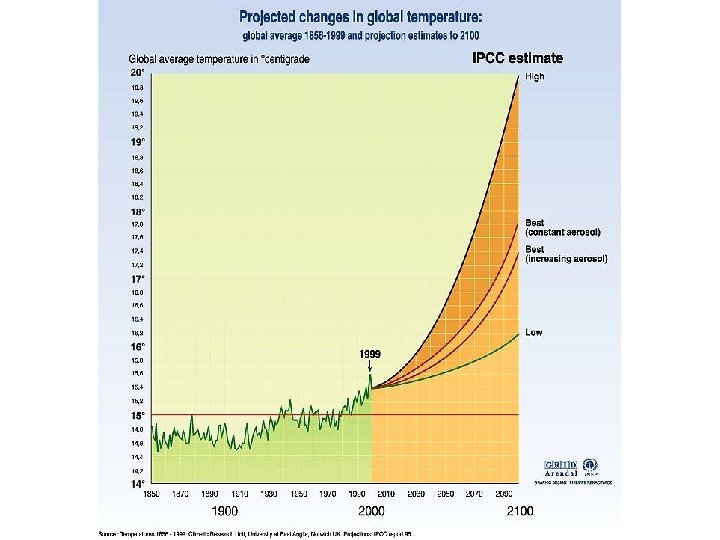

Projected Temperature Changes – B 1 low, A 1 medium, A 2 high

Changes in NPP due to Global Climate Change

Nitrogen Cycle

Ammonia in Agriculture

Nitrogen Cycle • To become a part of an organism, nitrogen must first be fixed or combined with oxygen or hydrogen. • Nitrogen cycle is mainly an atmospheric cycle – Nitrogen fixation mainly occurs by atmospheric N being fixed by microbes in soil; 3 - 4% of annual influx is fixed by lightning and brought to earth by wetfall. • When plants and animals eventually die, their nitrogen compounds are broken down giving ammonia (ammonification). • Some of the ammonia is taken up by the plants; some is dissolved in water or held in the soil where bacteria convert it to nitrates (nitrification). • It may also be converted to free nitrogen (denitrification) and returned to the atmosphere – especially in low oxygen environments.

Phosphorus Cycle

Phosphorus Cycle

The global Phosphorus budget: Pools of available phosphorus, in 1012 grams P • Sediment 4 x 10⁹ • Soils 200, 000 • Sea 90, 000 • Mineable rock 10, 000 • Terrestrial 3, 000 Fluxes (x 1012 g P/yr) • Terrestrial cycle 60 • Mining extraction 12 • Transport airborne dust 1 • Transport rivers 21 • Marine cycle 1000 • Burial 2

Cultural Eutrophication • Eutrophication means well fed and in natural situation is okay • Cultural eutrophication – human sources introduce nutrients, especially phosphorus or nitrogen, to a body of water leading to very high concentrations of the nutrient causing increased growth of algae.

Lake Washington, Seattle

Oscillatoria – Cyanobacteria

Cyanobacteria Blooms

Eutrophication Timeline • Late 1800’s – Seattle starts to grow to city size – raw sewage dumped into Lake Washington • 1926 – Seattle builds sewage treatment plant – sewage sent to Puget Sound • 1940’s – area grows – suburbs build 10 treatment plants that dump treated sewage in Lake Washington between 1941 -1954 • 1955 – Oscillatoria found growing in lake • Action taken to clean lake – 1963 sewage diverted to Puget Sound, 1964 water quality improves, 1968 no sewage dumped into lake; 1975 – back to pre-pollution state

Lake Washington – Reduction in Phosphorus followed by reduction in growth of cyanobacteria measured as amount of chlorophyll in the water
- Slides: 34