Ecosystem Ecology Basic ecosystem nutrient cycling in red

Ecosystem Ecology

Basic ecosystem - nutrient cycling in red, energy flow in grey

Basic Energy Flow

Basic Energy Flow
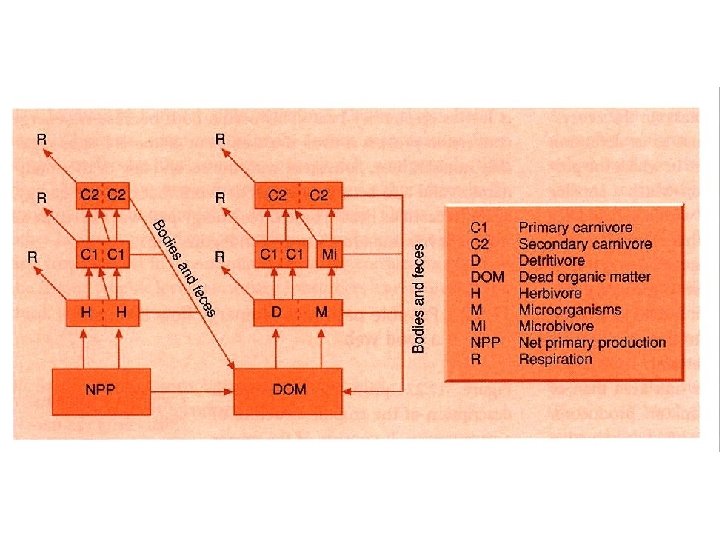

Energy Flow Expanded

Energy Flow in Different Ecosystems

Transfer Efficiency

10% Rule for Transfer Efficiency

Consumption Efficiency • CE = food ingested/food produced • How much of prey population that consumer eats • For herbivores – 5% in forests, 25% in grasslands, 50% in phytoplankton ecosystems • For vertebrate predators – up to 50 -100% vertebrate prey; 5% invertebrate prey • For invertebrate predators – 25% invertebrate prey – maybe, this is a very rough estimate

Assimilation Efficiency • AE = food assimilated/food ingested • How much of prey eaten is digested • AE usually low for herbivores, microbivores, detritivores – 20 -50% • AE usually high for carnivores – 80%

Production Efficiency • PE = new biomass produced/food assimilated • How much of prey digested is converted to consumer biomass and used in reproduction – rest is lost as respiratory heat • PE high for invertebrates – 30 -40% • Intermediate for ectotherm vertebrates – 1020% • Low for endotherm vertebrates – 1 -3%
 where E = efficiency P")
Efficiency of Energy Transfer E = P/(P + R) where E = efficiency P = net production R = respiration • Some representative efficiency values are as follows: • birds 1. 3% • small mammals 1. 5% • large mammals 3. 1% • fish 10. 0% • herbivorous insects 39% • carnivorous insects 56% • detritivore insects 47%

Lindeman’s Efficiency • LE = assimilation at trophic level n – 1 LE examines efficiency of transfer between trophic levels – often assumed to be 10% but…is actually more complex

Light Absorption

Lindeman’s Efficiencies

Decomposition

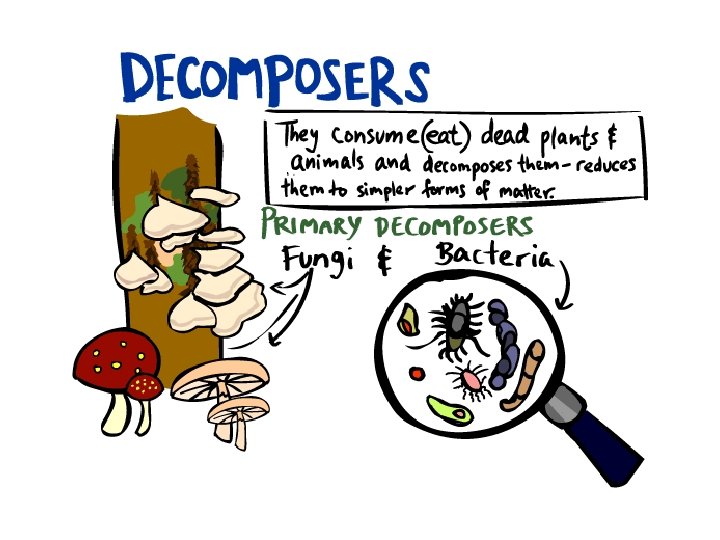
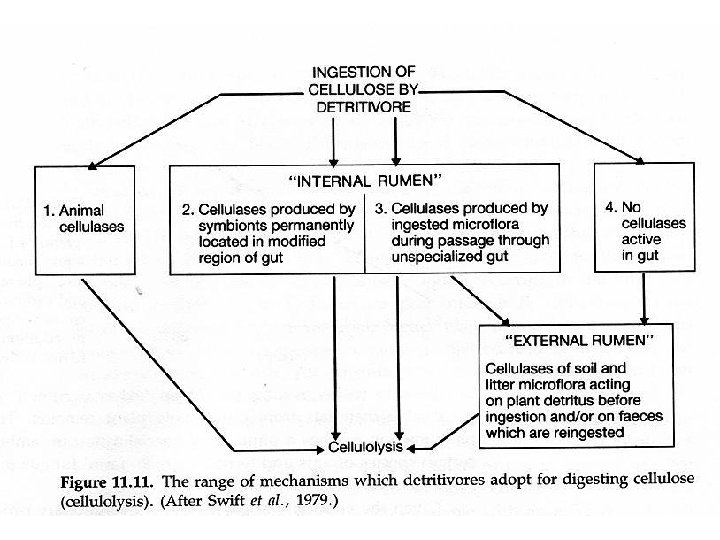
Decomposition • Role in ecosystems – decomposition is gradual disintegration of dead organic matter and is brought about by both physical and biological agents • decomposers - organisms which convert organic elements to inorganic form - mostly bacteria and fungi • detritivores - animals that consume dead organic matter • only decomposers can break down complex organic material releasing nutrients to soil - other organisms can do limited breakdown, but not enough to efficiently recycle nutrients

Resources for decomposers and detritivores • not just dead bodies of plants and animals, but also shed dead body parts such as skin cells (food for mites on humans), feathers, horns, leaves, twigs • loss of cells from root caps creates rhizosphere which is resource rich place for soil bacteria • plant tissues are leaky and release soluble sugars and nitrogen compounds on leaf surface creating rich environment for bacteria and fungi on leaves called phyllosphere

Rhizosphere

Rhizosphere Bacterial Cells in White, Green, Red

Phyllosphere

Phyllosphere

Phyllosphere – Bacteria from Leaf Impressions on Plate

Donor Control • Decomposers and detritivores live in world where resource supply is donor controlled - the donor controls density (population size) of the recipient, but the reverse does not happen - there is no direct feedback between consumer population and resource • In contrast, plants and predators do exert a direct effect on their resources because they reduce amount of resources (population size of the prey) in the environment

Basic Energy Flow

Important Terms for Decomposition Cycle • Immobilization or Fixation - inorganic nutrient element is incorporated into organic form, usually through the growth of green plants - thus not available to other plants • Mineralization - conversion of elements from organic to inorganic form by decomposition

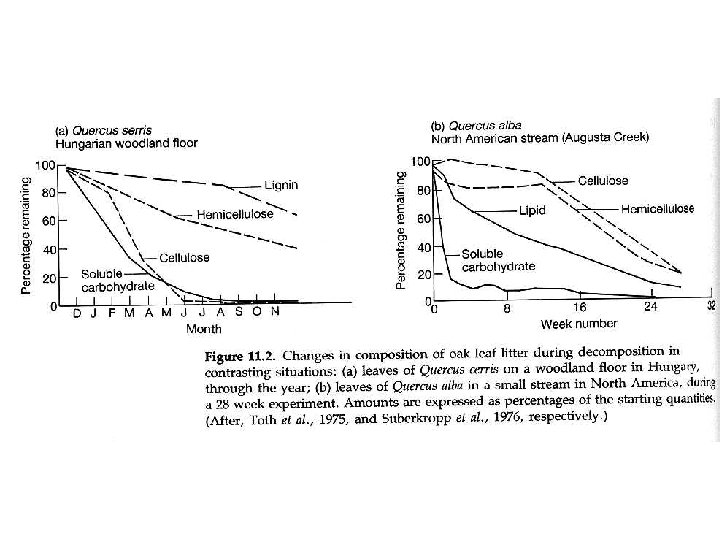
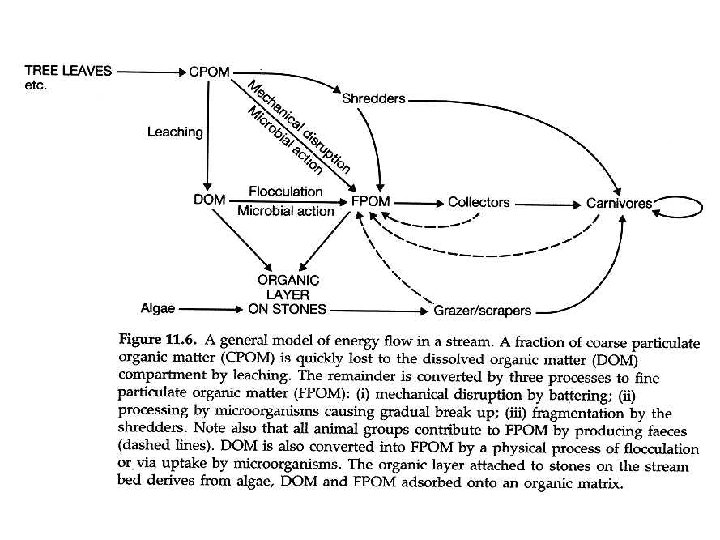
Decomposition of Leaves

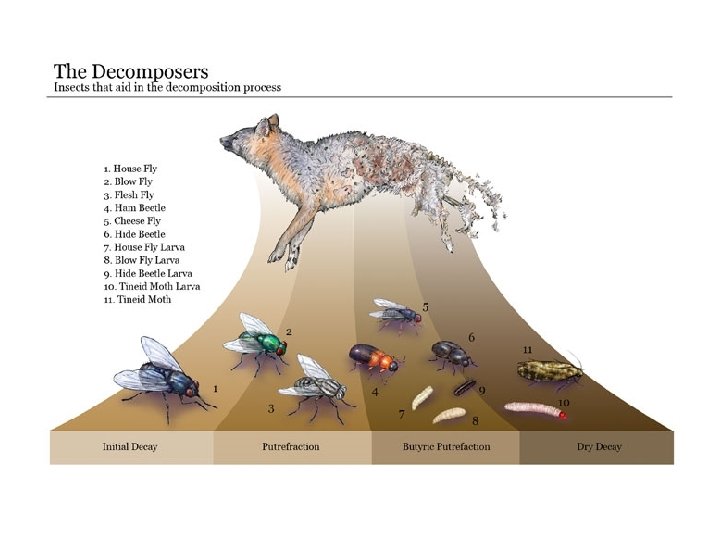
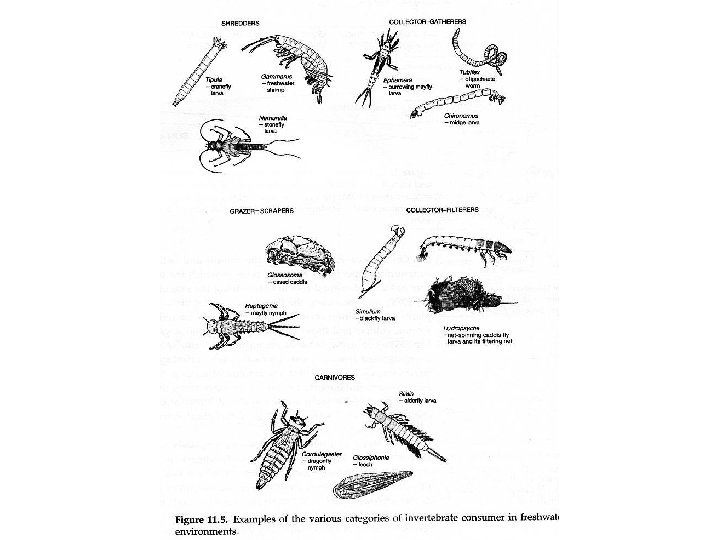
Decomposers And Detritivores

Detritivore Microfauna Nematodes Rotifers

Detritivore Mesofauna Mites Springtails

Macro-fauna - African dung beetle

Otzi the Iceman

African white-backed vulture

African vultures – Masai Mara

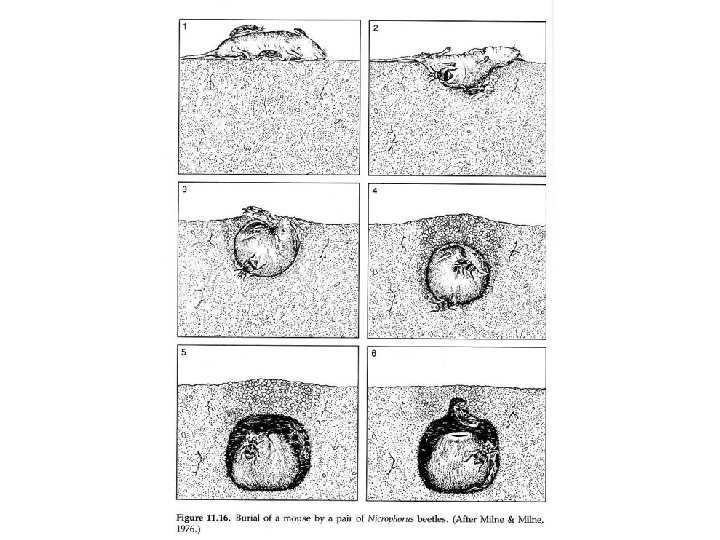
Burying Beetles

Earthworms

Earthworm casts recycle organic matter in soil

Nightcrawlers are new to North America

Composting

Compost Pile Food Web

Soil Food Web Microbes

Ecosystem Ecology

Serengeti at Sunrise

Energy and Material Flow in Ecosystems

Biogeochemistry

Atmosphere Living Organisms Lithosphere Hydrosphere

Biogeochemical Cycles Nutrients exist in pools of chemical elements - 3 main compartments where these nutrients exist are: 1) atmosphere - carbon in carbon dioxide, nitrogen in atmospheric nitrogen 2) lithosphere - the rocks - phosphates, calcium in calcium carbonate, potassium in feldspar 3) hydrosphere - the water of oceans, lakes, streams and soil - nitrogen in dissolved nitrate, carbon in carbonic acid
 from atmosphere - direct uptake such as")
Nutrients are input to ecosystems via: 1) from atmosphere - direct uptake such as carbon dioxide (photosynthesis) and nitrogen (taken up and fixed by bacteria and blue-green algae); Wetfall (rain, snow, fog) carrying the nutrients and washing them out of the atmosphere; Dryfall - particles directly settle out of the air; 2) from lithosphere - from weathering of rocks - some due to mechanical weathering by freezing and thawing and erosion, most due to chemical weathering by water running over the rocks; 3) from hydrosphere - streamflow carries nutrients into new areas

Living Organisms and Nutrient Cycles • Living organisms are a compartment in which carbon exists in carbohydrates (mainly cellulose) and fats, nitrogen in protein, and phosphorus in ATP

Nutrient Fluxes • For some nutrients in some ecosystems, nutrient fluxes may be in balance so that inputs = outputs • But for other ecosystems and nutrients, the cycle may be out of balance from too much input so that input > output storage • or too much output > input loss

General Scheme for Biogeochemical Cycles Consumers Producers Decomposers Nutrients available to producers Abiotic reservoir Geologic processes

Hydrologic Cycle

Hydrologic Cycle • Evaporation determines the flux of water through the cycle because it is in evaporation that energy is input • The atmosphere holds about 2. 5 cm of water spread evenly over the earth's surface at any one time • 65 cm of rain falls across the earth each year water cycles through atmosphere 25 times a year, each transit takes about 2 weeks • Most of the evaporation on land is due to losses by plants during respiration - 55 x 1018 g while total for land is 59 x 1018

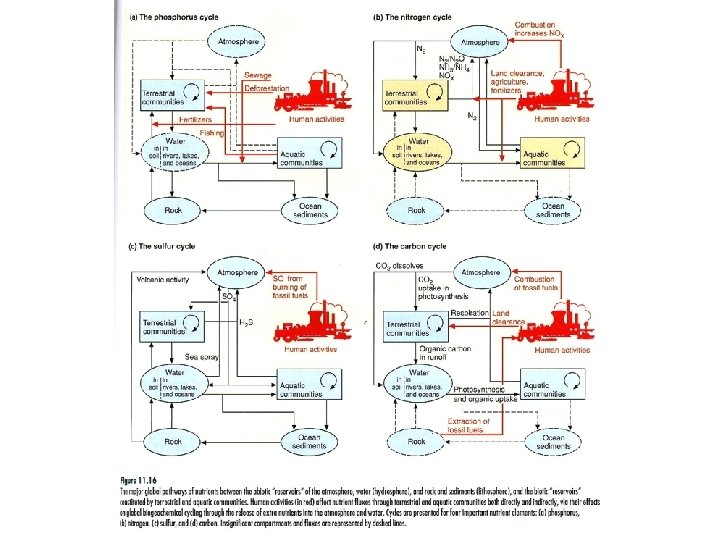
Carbon Cycle

Some Carbon Cycle Numbers • World's terrestrial biota respires about 120 x 109 metric tonnes of carbon per year • Human activities release about 5. 1 to 5. 9 x 10⁹ metric tonnes per year • The observed increase in atmospheric CO 2 is due to about 2. 9 x 10⁹ tonnes per year - which is 39 - 57% of human input • The rest is probably dissolved in the oceans though some is absorbed by terrestrial plants and put into extra biomass. • 1750 atmospheric CO 2 was 280 ppm, 410 ppm in April 2017 • Current estimate is that by 2050 atmospheric CO 2 will reach 500 ppm

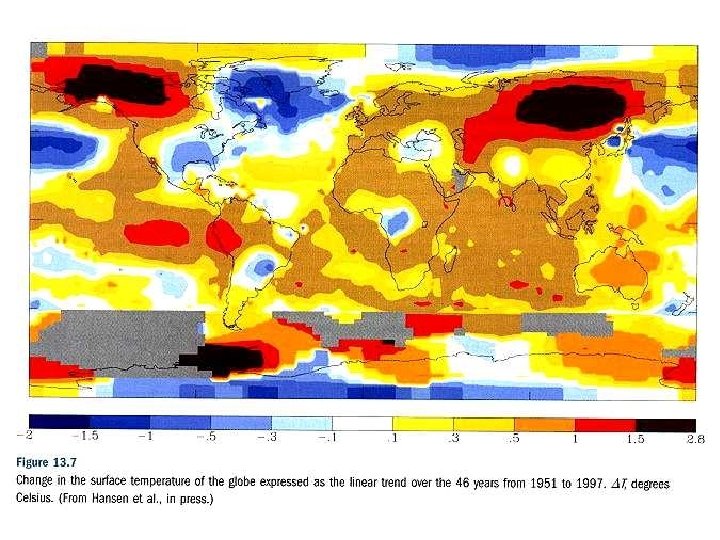
Increase in Atmospheric CO 2 and Global Temperature

Global Carbon Emissions

CO 2 Last 400 K years

Model predictions of global temperature increase

Projected Temperature Changes – B 1 low, A 1 medium, A 2 high

Predicted surface change 1960 -2060
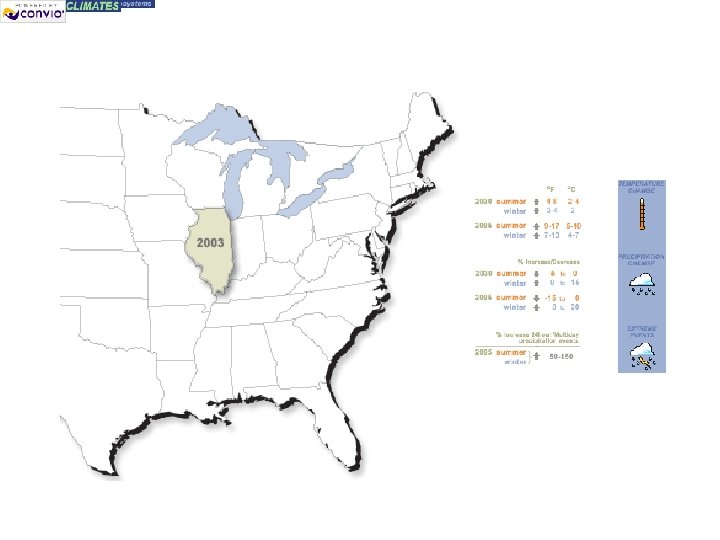
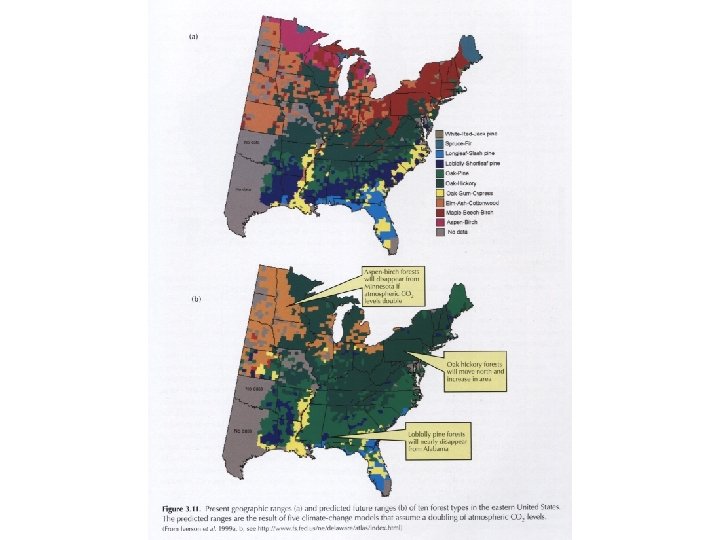

Changes in NPP due to Global Climate Change

Nitrogen Cycle

Ammonia in Agriculture

Nitrogen Cycle • To become a part of an organism, nitrogen must first be fixed or combined with oxygen or hydrogen. • Nitrogen cycle is mainly an atmospheric cycle – Nitrogen fixation mainly occurs by atmospheric N being fixed by microbes in soil; 3 - 4% of annual influx is fixed by lightning and brought to earth by wetfall. • When plants and animals eventually die, their nitrogen compounds are broken down giving ammonia (ammonification). • Some of the ammonia is taken up by the plants; some is dissolved in water or held in the soil where bacteria convert it to nitrates (nitrification). • It may also be converted to free nitrogen (denitrification) and returned to the atmosphere – especially in low oxygen environments.
- Slides: 77