Long term dynamics of the Serengeti Ecosystem SERENGETI


 Serengeti Wildebeest Population 1800 1500 1200 900 600 300 0")


 Serengeti Wildebeest Population 1800 Drought 1500 1200 900 Rinderpest removed")


- Slides: 66
Long term dynamics of the Serengeti Ecosystem
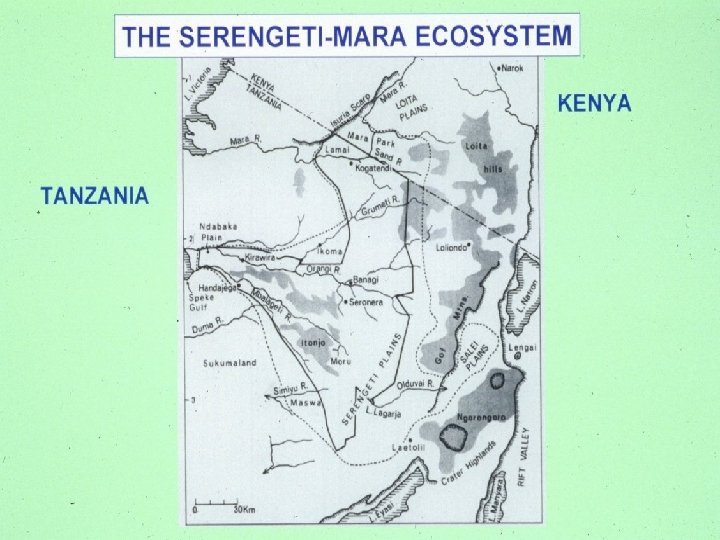
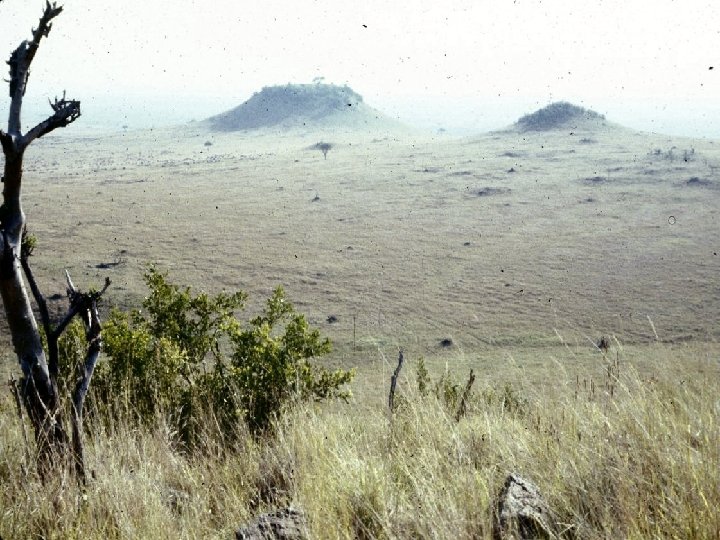
SERENGETI ECOSYSTEM KENYA TANZANIA
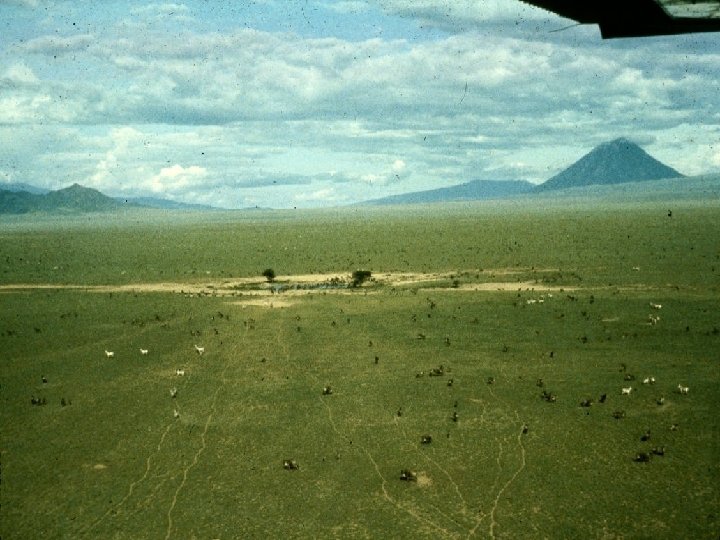
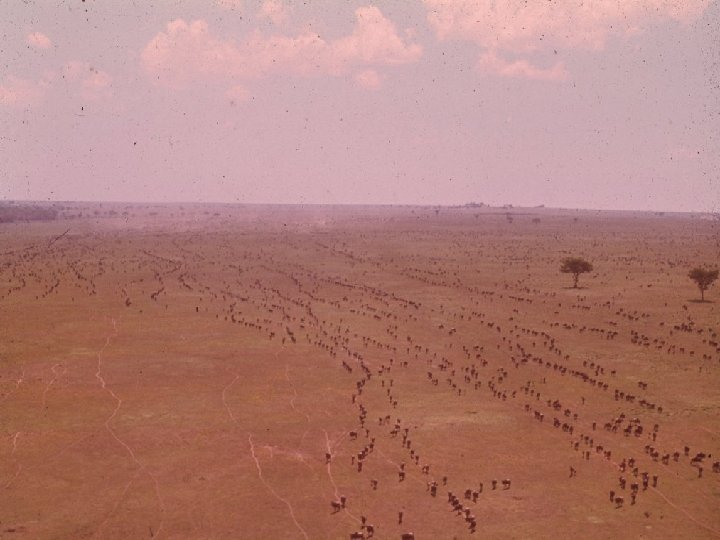
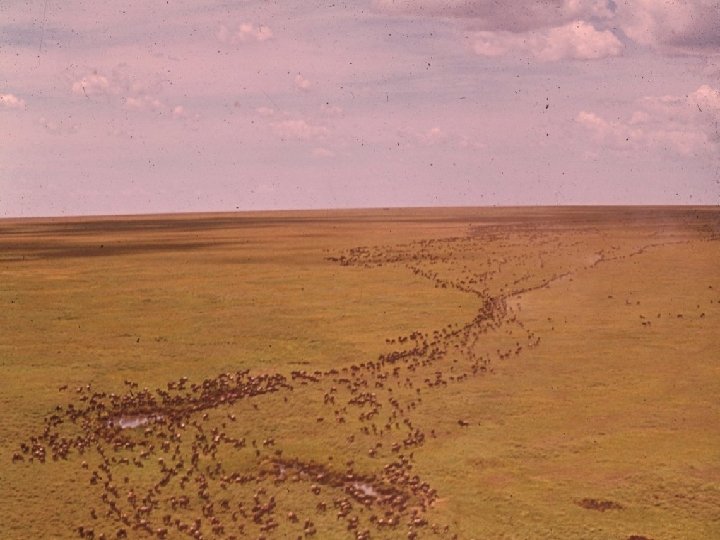
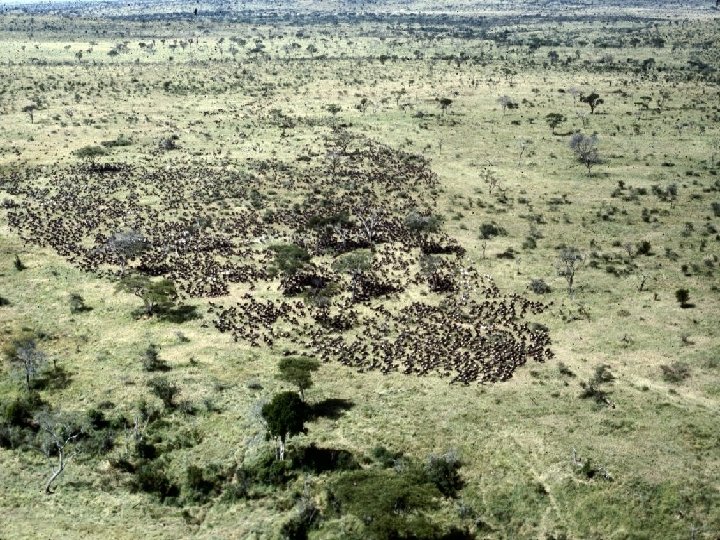
Wildebeest migration patterns
The reason for dry season migration Kris Metzger
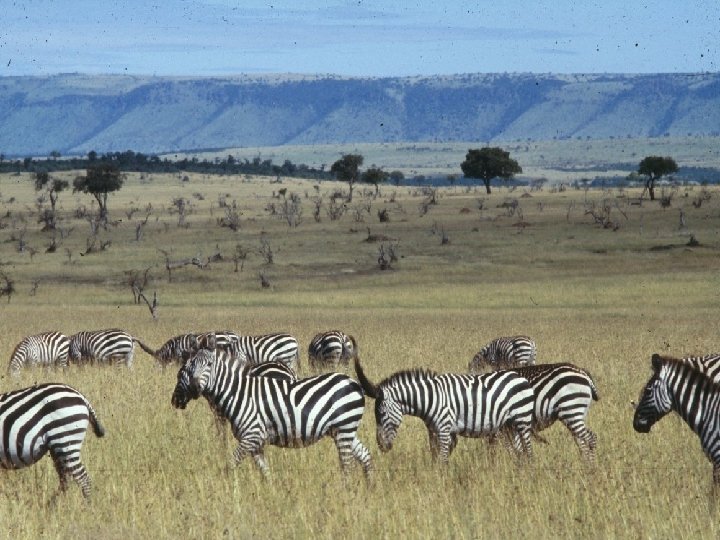
Migration patterns of Zebra and Gazelle
The Serengeti-Mara Ecosystem 24, 000 square kilometers Plains – woodland migration system 28 species of ungulates 10 species large carnivore, hyena most numerous
Population Size (x 1000) Serengeti Wildebeest Population 1800 1500 1200 900 600 300 0 1950 1960 1970 1980 1990 2000
The regulation of the wildebeest population • What caused the increase? • What caused the leveling out?
Population Size (x 1000) Serengeti Wildebeest Population 1800 Drought 1500 1200 900 Rinderpest removed 600 300 0 1950 1960 1970 1980 1990 2000
Serengeti Wildebeest per capita Dry Season Food 350 300 250 200 150 100 50 0 1960 1970 1980 1990 2000
Serengeti wildebeest regulation Food limitation allows regulation of the population so that it levels out at about 1. 3 million animals
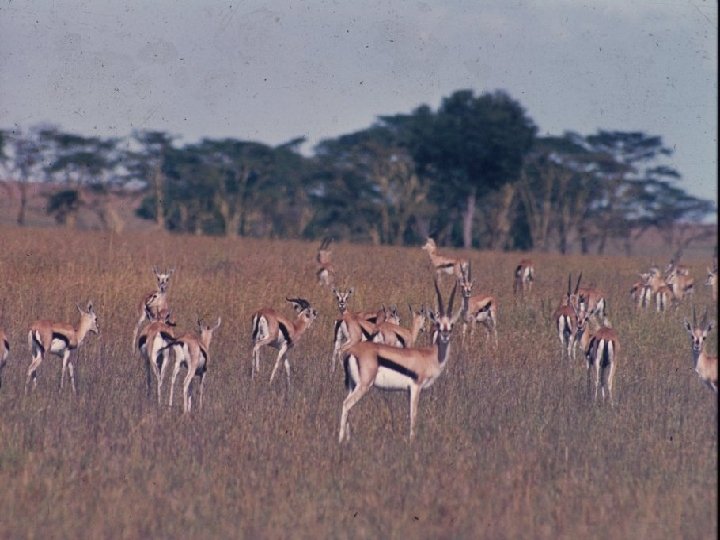
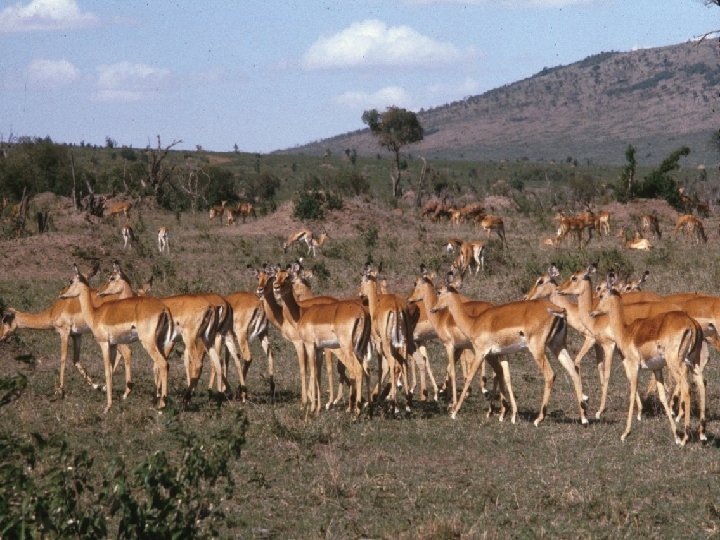
Serengeti wildebeest competitors Food limitation leads to competition with some other grazing ungulates - Thomson’s gazelle But not Zebra – unknown why
Zebra and Thomson’s gazelle
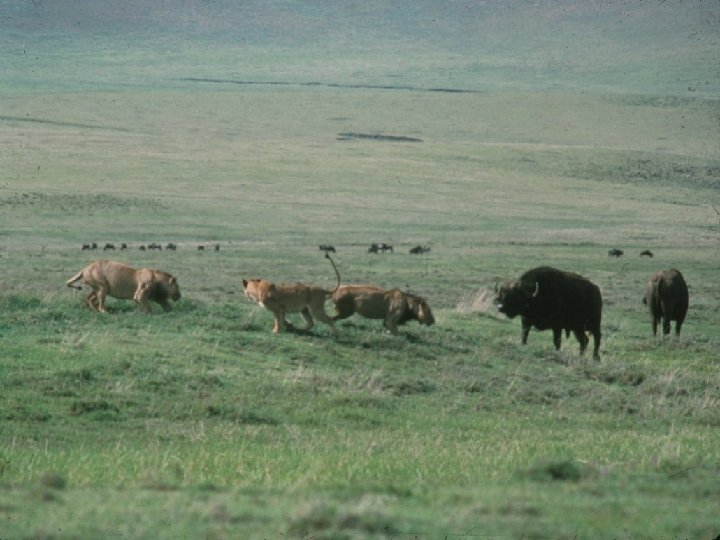
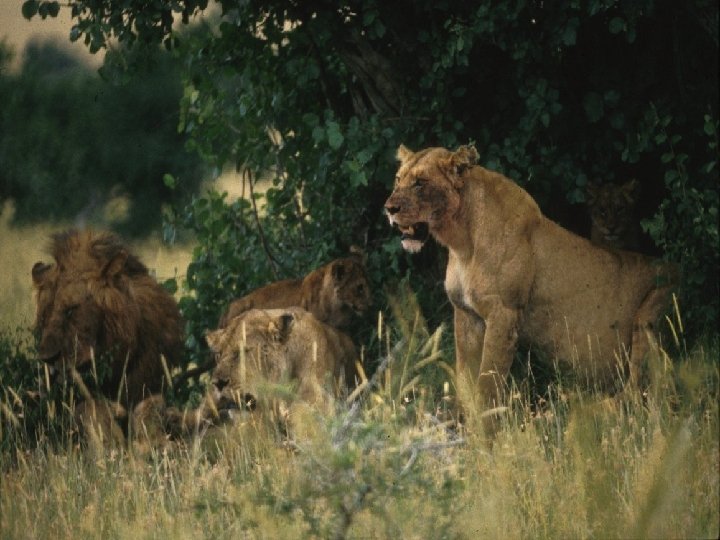
Predation What is the role of predators in the ecosystem?
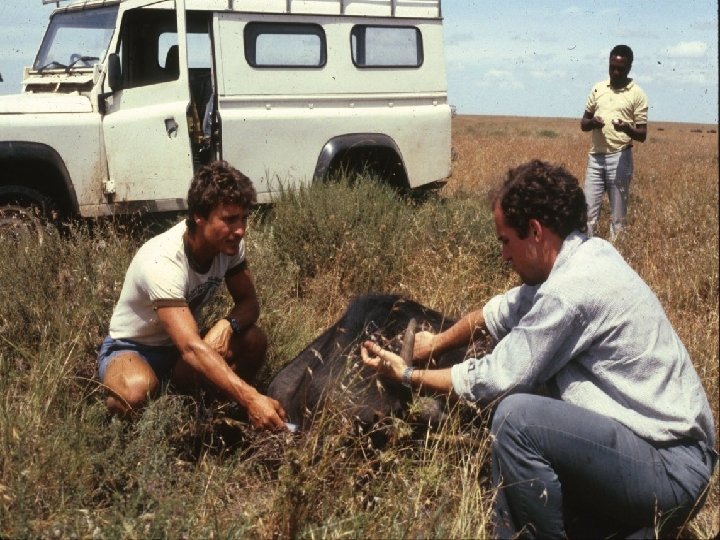
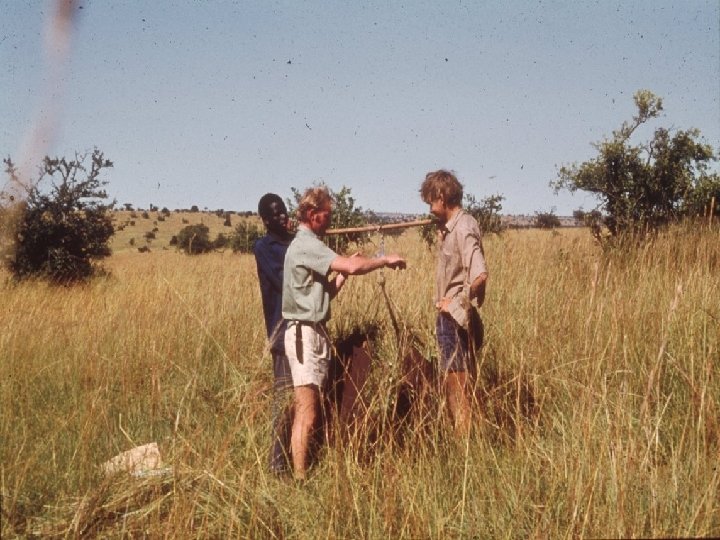
PREDATION AS A LIMITING FACTOR IN NON-MIGRATORY SERENGETI UNGULATES Tested by predator removal experiment: In northern Serengeti for 1980 -87 most large predators removed. Then they returned after 1987. Prey populations were compared to an adjacent non-removal area, Mara Park, Kenya
PREDATOR REMOVAL Oribi 18 kg Thomson’s gazelle 20 kg Impala 50 kg
Conclusions on regulation Large ungulate species food regulated Migrant species food regulated Small resident ungulate species predator regulated
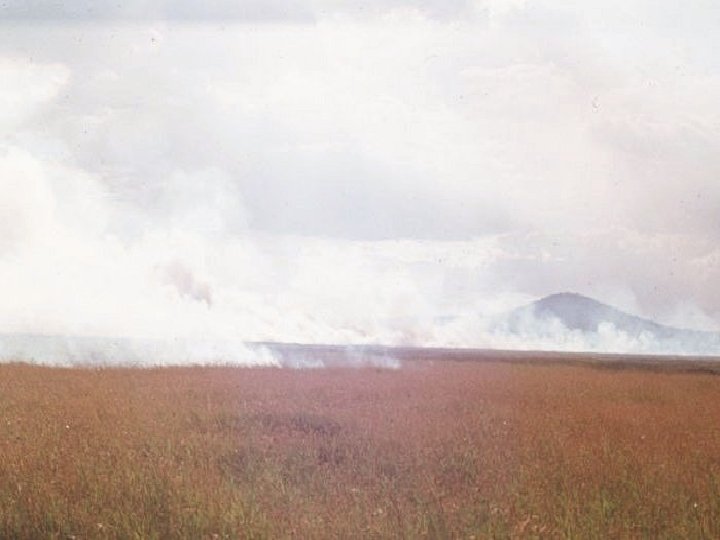
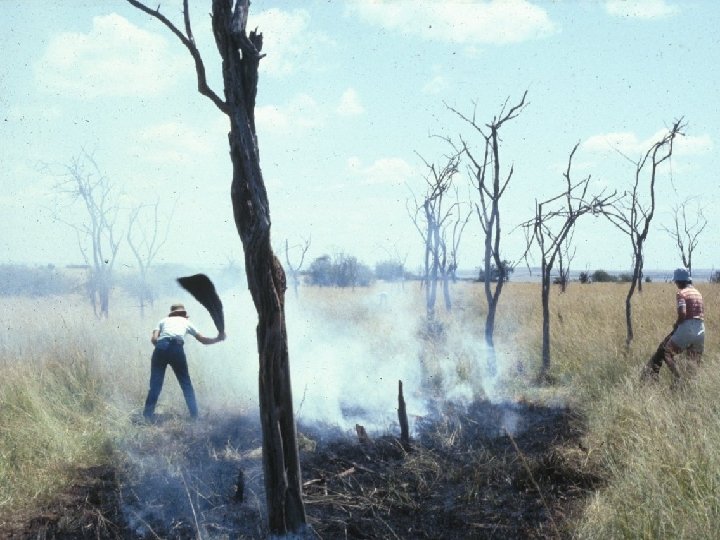
Climate change - increase in wet season rain will increase fuel loads and burning - increase in dry season rain will increase fuel moisture and decrease burning So how does burning affect the system?
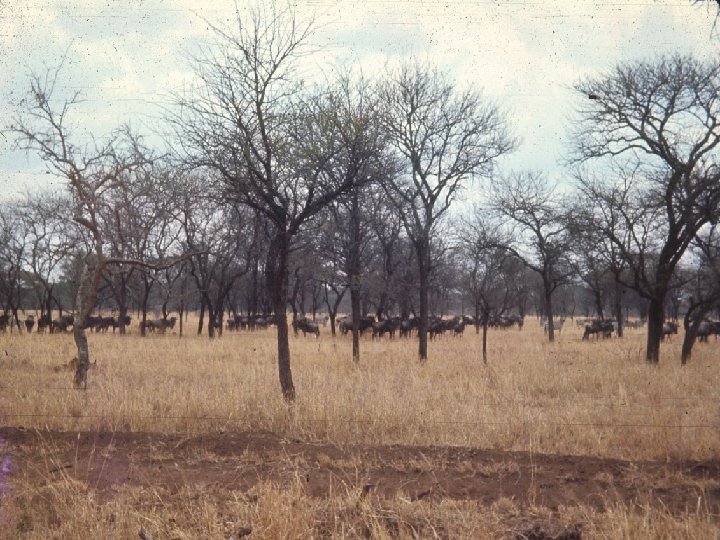
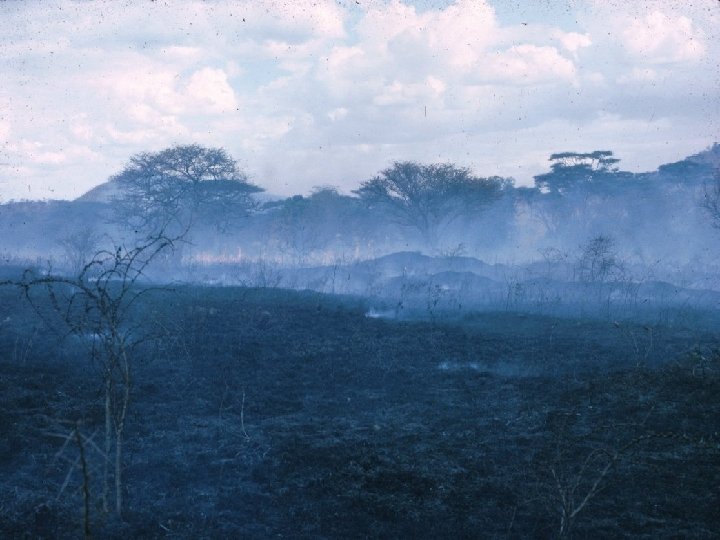
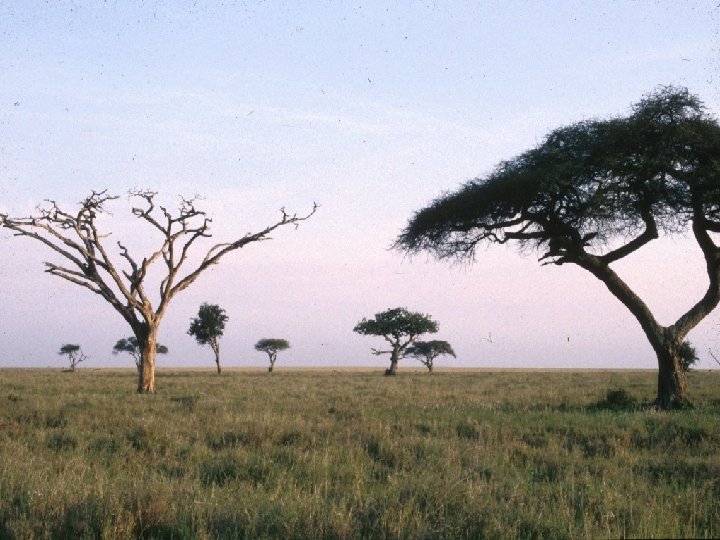
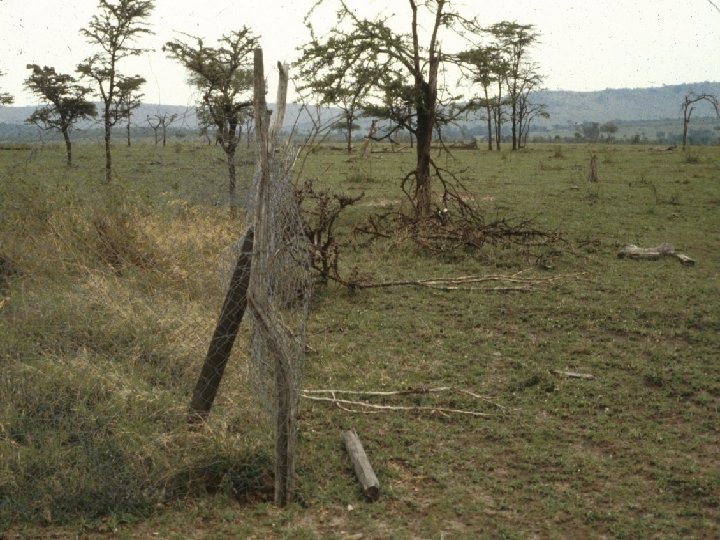
Consequences of extensive burning - The decline of savanna trees
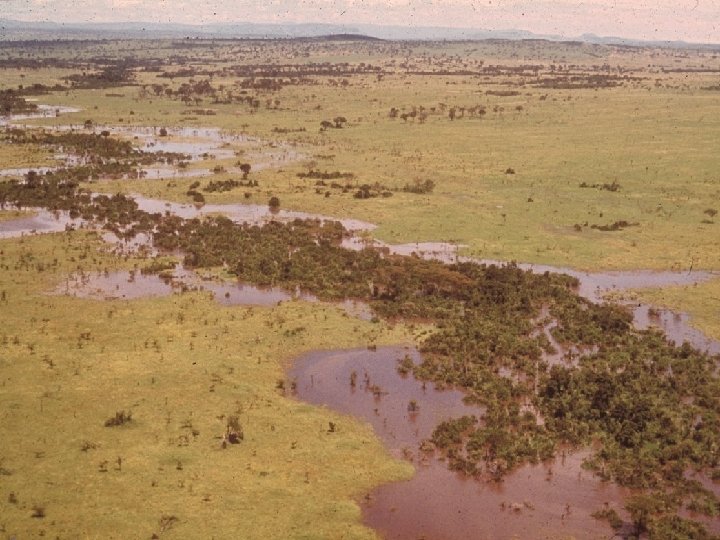
Mara triangle 1944
Wildebeest grazing reduces grass fuel and area burnt
SERENGETI AREA BURNT IN DRY SEASON
Increase in wildebeest causes decrease in burning
Complex interactions of wildebeest and the environment The extent of grass fires is determined by the degree of grazing imposed by wildebeest
1980 1991 Savanna 1986 2003
Complex interactions –changes in tree populations Savanna trees have gone through a cycle of increase and decrease followed by increase again lasting about 100 years
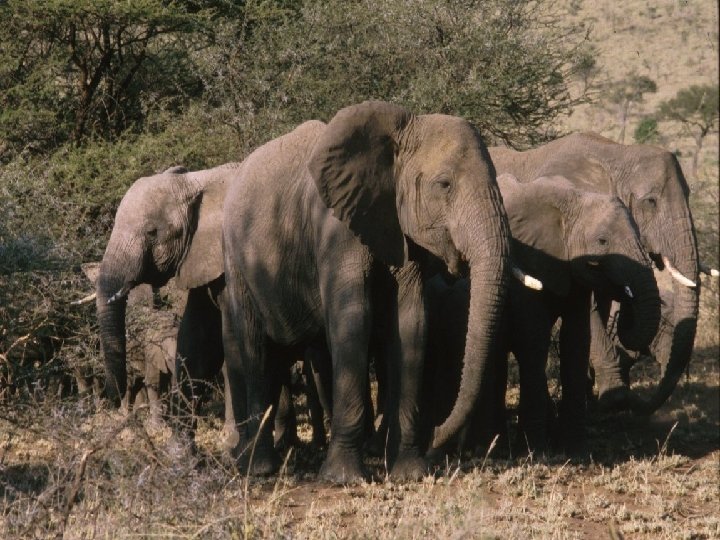
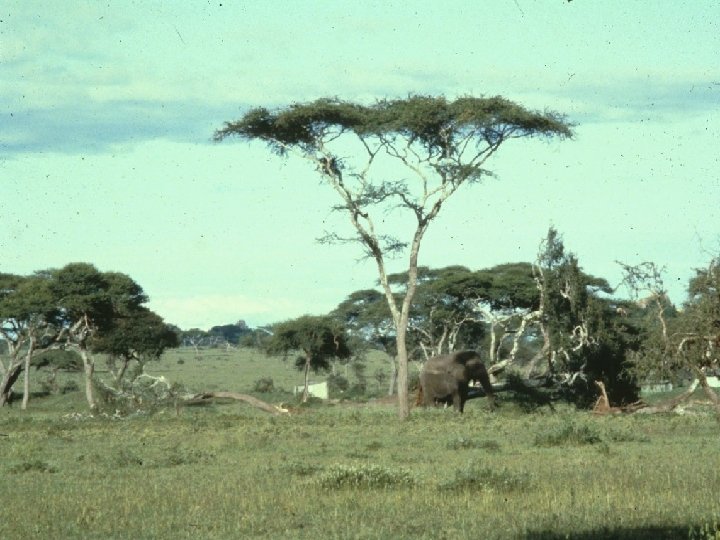
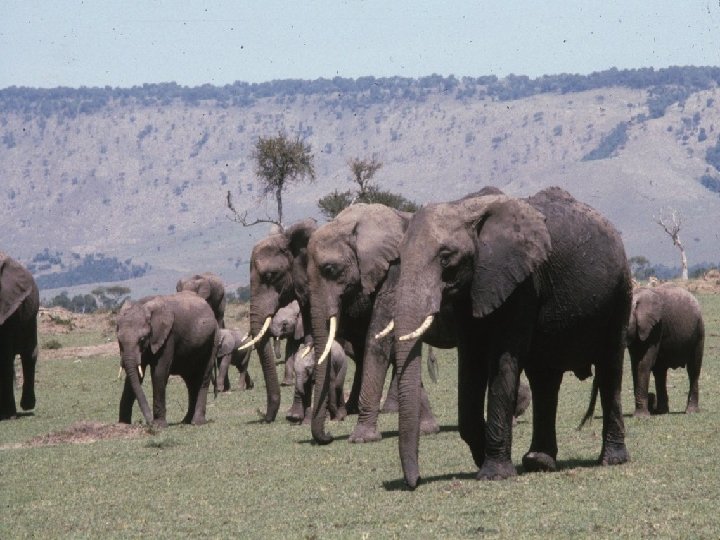
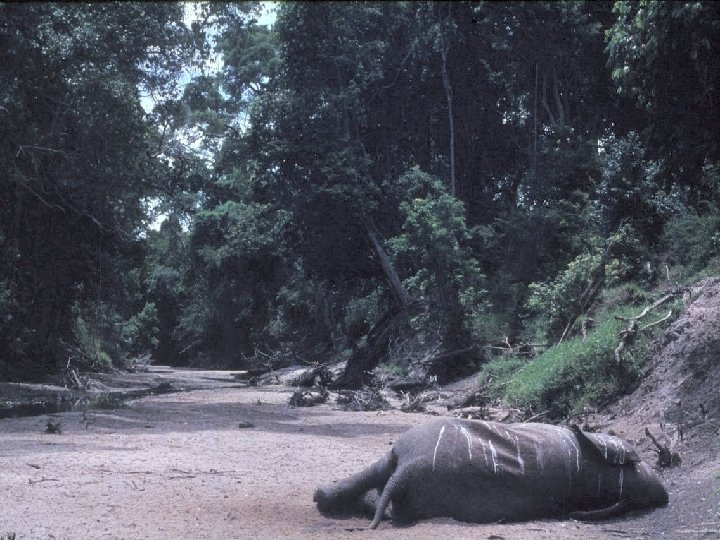
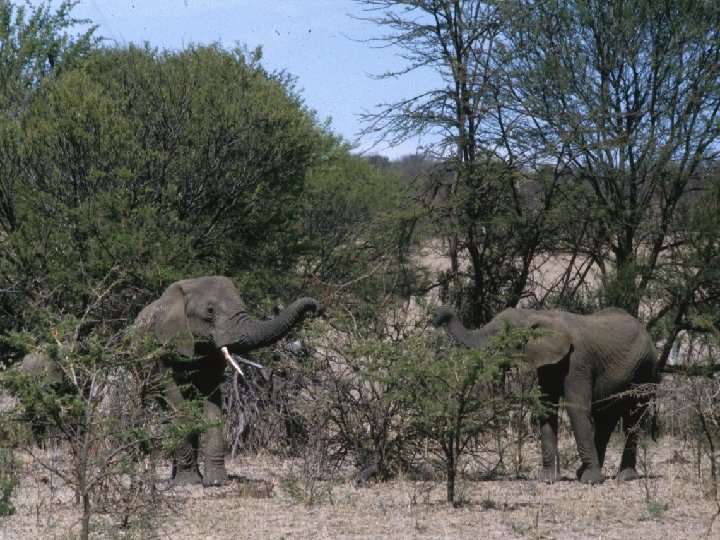
Trees and elephant predation 1960 s – blamed for the decline of mature Acacia trees throughout savanna Africa. - Elephant culling
Trees and elephant predation 1970 s – fire rather than elephant shown to be the cause of decline (Norton-Griffiths work in 1970 s) Elephant play another role by feeding on seedlings
Trees and elephant predation 1960 s – the decline of mature Acacia trees throughout savanna Africa. Elephants are blamed. Elephant culling in Uganda, Kenya, Zimbabwe and South Africa. Not in Tanzania. 1970 s – evidence that excessive human caused fires reduce tree recruitment and tree populations collapse from senescence and not from elephant predation 1980 s – experimental evidence that elephants can prevent regeneration and maintain a grassland state
Serengeti elephant population Hunting 1880 s-1920 s Poaching Ivory ban
Serengeti keystones processes Hyena, Lion Small carnivores Wildebeest Resident ungulates Grasses Dicots Spatial heterogeneity
Conclusions Serengeti has shown • Evidence of natural regulation • Both bottom-up and top-down regulation occurs in the same system • There can be more than one state in species combinations • Keystone species can affect all levels in the system • There is long term natural change • Protected areas can provide baseline data to assess human impacts on other ecosystems
The End
Trees and elephant predation 1960 s – the decline of mature Acacia trees throughout savanna Africa. Elephants are blamed. Elephant culling in Uganda, Kenya, Zimbabwe and South Africa. Not in Tanzania.