Mapping Extensions Networks Using Social Network Analysis to


 • An approach used to study the exchange of resources")
, edited by")
 “Conventional” Social Science Data: Linear • Rows of cases with")
 Social Network Data: Relationships between cases, subjects, or observations. •")
 Two-Mode Network: • Not adjacent • Two different types of")


 Dean’s")


")

 43.")
 of Extension staff to county government offices/agencies, by scope of")
 of Extension staff to external organizations, by region (based on")
 Central Extension not Center")


- Slides: 62
Mapping Extension’s Networks: Using Social Network Analysis to Explore Extension Outreach A Demonstration Session
Overview of Session • Background − What is SNA? − Why is this so important? • Planning and Administering the Survey − Garnering support – Communications Examples − DEMO -- Online survey • Manipulating the Data − DEMO -- Moving from Excel to SPSS and back again • Creating Network Maps − DEMO -- UCINET • Engaging Staff and Using the Findings • Limitations and Lessons Learned
Background
Extension: Delivering information through: • Programs • Publications • Networks
Our goals for measuring Extension’s networks • Gain a comprehensive view of UM Extension’s outreach networks – Type of organization (government, nonprofit, for-profit) – Level of relationship – Region • Identify network concentrations and holes – Within regions – Within UM Extension position categories • Identify network overlaps between centers and programs • Longitudinal monitoring of network changes
Networks are about relationships • Extension’s information infrastructure Important for – – Basic and ongoing information dissemination – Ensuring information relevance through engagement – Quick emergency responses
Social Network Analysis (SNA) • An approach used to study the exchange of resources among actors (individuals, groups, or organizations) • One such resource is information • Actors are called “nodes” • Relationships are the lines connecting the nodes • Mapping metaphor -- “Just as roads structure the flow of resources among cities, information exchange relationships structure the flow of information among actors. ”
SNA and Evaluation • Focus of New Directions for Evaluation (Fall 2005), edited by Durland Fredericks • “SNA is about relationships and relationships are at the core of organizations. ” • SNA methods can be very helpful if existing evaluation questions or goals involve relationships • Patton’s recent book Developmental Evaluation recommends various forms of mapping, including SNA, as tools for measuring change in complex systems
Social Network Analysis (SNA) “Conventional” Social Science Data: Linear • Rows of cases with columns of attributes, variables, or measures. • Compare how cases or variables are similar or dissimilar. • A sample can represent a whole group. Name Gender Score Bob M 8. 3 Jane F 2. 4 Allison F 5. 1 James M 6. 0
Social Network Analysis (SNA) Social Network Data: Relationships between cases, subjects, or observations. • Rows of cases, subjects, or observations • Columns of the same cases, subjects or observations (one-mode, adjacent dataset) • Nearly always includes entire target population Name Bob Jane Allison James Bob -- 1 1 -- Jane 1 -- -- -- Allison 1 1 -- -- James -- -- 1 --
Social Network Analysis (SNA) Two-Mode Network: • Not adjacent • Two different types of variables. • Rows and columns have different types of variables Name Arts Club Health Club Book Club Social Club Bob -- 1 1 -- Jane 1 -- -- -- Allison 1 1 -- -- James -- -- 1 --
Planning and Administering the Survey
Steps: Where we’ve been Requirement: Extension-wide evaluation team and added project support staff. 1. Garner the support of administrators 2. Frame parameters of study 3. Develop survey questions and instrument 4. Pilot instrument 5. Administer survey and collect responses 6. Code organizations at optimal level 7. Analyze and report findings associated with the needs of each internal stakeholder group – central Extension, centers, and programs.
Future Steps 8. Evaluate the impact of Extension on its primary network organizations. 9. Repeat the process in three years, looking for changes.
Step 1: Garner system support • Obtain buy-in – Meetings with Deans and communications – Meetings with center directors and program leaders • Communications plan
Step 1: Garner system support • Examples of communications E-mail from Associate Dean (Center Director) Dear CV Team, I am writing to encourage you to take the time to complete the Mapping Extension's Networks survey. This important project will help Extension's program areas better understand the extent and reach of our organizational networks throughout Minnesota and beyond. Dean Durgan is very supportive of everyone contributing to this effort. See her note in yesterday's Extension Weekly. https: //myextension. umn. edu/dean/Extension_Weekly/August 212008. html (NOTE: You may need to cut and paste the URLs in this message into a browser if you can't click on them. ) With the information you provide, Extension's evaluation team will map Extension's networks and identify strengths, gaps and opportunities. Analysis of the survey data will tell an important story to the University, legislators, county commissioners and other stakeholders who need to understand the value of Extension to the state. Program teams can also use the analysis to better understand their primary relationships. I am personally very excited about the opportunities of this research for Community Vitality. This is an excellent time in the development of our Center to analyze our stakeholders and to articulate how Community Vitality's audiences are important to Extension. Additionally, this analysis will help program team identified shared audiences, which hopefully will encourage teams to work together with common audiences. If you have contributed 8 or more hours of your work time to an organization outside of Extension during the past year, we would like to know about your involvement. The information requested on the survey will take about 2 minutes to complete for each organization. Please go to this web address -- http: //fd. extension. umn. edu/Network. Preparation. Form. doc to download a form to help you prepare your organization list for the survey and this web address - https: //fdsurveys. extension. umn. edu/rws 4. pl? FORM=Mapping. Networks to complete the survey. While your response is confidential, the evaluation team will be tracking those who complete the survey and contacting those who do not. So please take the time to complete the survey before Friday, September 12. I am counting on all of Community Vitality staff -- all educators, specialists/faculty members, support staff, and administrators -- to share their connections as valued contributors to the Extension story. You will receive a carabiner key chain with a mini flash light with Extension's name on it for participating. If you have any questions about the survey, contact Scott Chazdon at 624 -0982 or at schazdon@umn. edu. Thank you for your participation, Dick Senese
Step 1: Garner system support • Examples of communications Extension Weekly (e-mail newsletter) Dean’s Column Dear Colleagues, During the next three weeks, I am personally asking every single Extension employee to complete a survey that will help us determine Extension's statewide networks. While some people tell me it is not possible to get everyone in the organization to complete a survey, I am confident that here, in Extension, we can. That's why I am challenging you to take the 5 to 30 minutes needed to show Extension's value to Minnesota. "Mapping Extension's Networks" is a survey about your involvement in the past year with non-University organizations. If you have contributed eight or more hours of your work time to an organization, we want to know about it. If you do not have organizations to report on, the survey will take you no more than five minutes. Each organization you have to report on will take an additional two minutes. With the information you provide, we will map Extension's networks and identify strengths, gaps and opportunities. The analysis of this data will tell an important story to the University, legislators, county commissioners and other stakeholders who need to understand the value of Extension to the state. Program teams can also use the analysis to better understand their primary relationships. You will soon receive an email with information and a link to the survey. Please take the time to complete the survey. While your response is confidential, the Extension evaluation specialists will be tracking who completes the survey and will follow through with you to ensure that all employees respond to the survey. Thank you in advance for your participation in this Extension-wide survey. Bev Durgan
Step 1: Garner system support • Examples of communications Extension Weekly -- Follow up from Senior Associate Dean during the survey period Mapping Extension's Networks Legislators, Extension committees and the public all want to know how the University, especially Extension, interacts with various stakeholders. It is becoming more and more important in financially challenging times and in the era of enhanced accountability that Extension is aware of these relationships. That's why Extension is currently conducting a major survey titled "Mapping Extension's Networks. " I strongly ask you to take this survey and not feel threatened in being asked about your working relationships. Those relationships with external audiences are not only important to us as individuals, but to Extension and the University. We do not intend to change the relationships, but rather to map them, so we can see Extension's reach and identify gaps that we may choose to fill. I understand how personal your external relationships may seem to you. Throughout the 1990 s, I was an Extension soil scientist working on manure management and air quality education and conducting research and education on nutrient cycling in livestock and crop systems. In this role, I developed close working relationships with the MN Pork Producers, MN Soybean Research and Promotion Council, the Department of Agriculture, and the Natural Resource Conservation Service. I know that my colleagues also had close relationships with these organizations. We would have painted an impressive picture of Extension's reach if we had mapped these relationships. It's not too late to create the Extension map! You have initiated, developed and maintained many network relationships that are making a difference in Minnesota. Please join me in blocking out 15 minutes today to conduct this survey if you haven't done so already. Mike Schmitt Senior Associate Dean
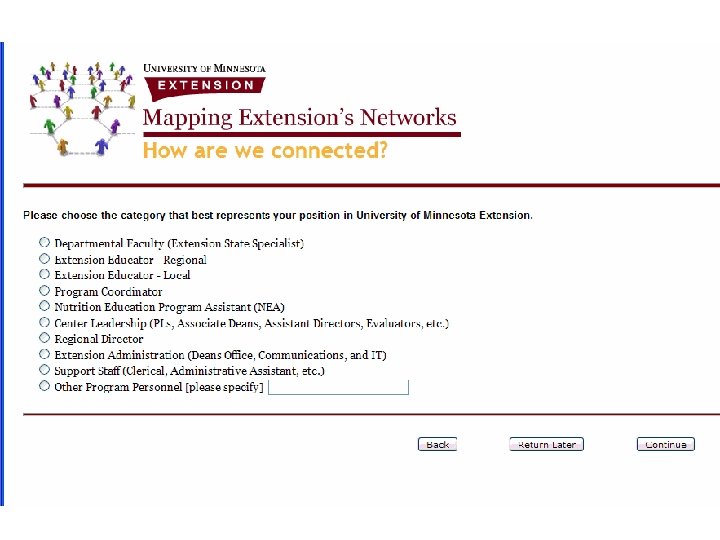
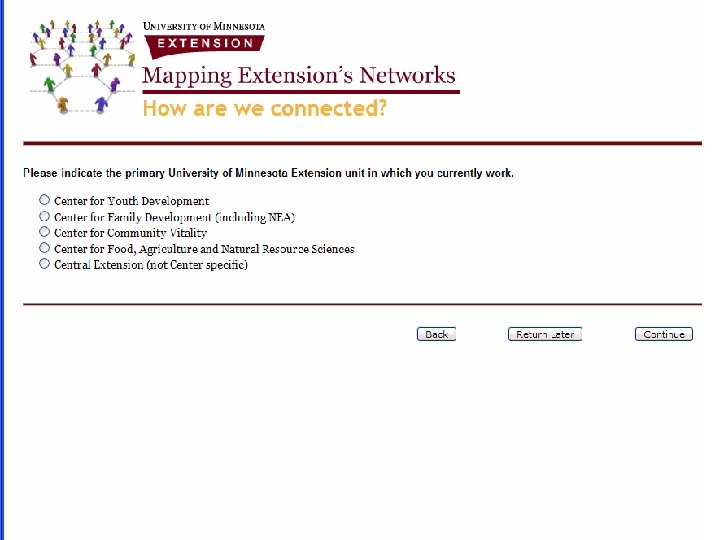
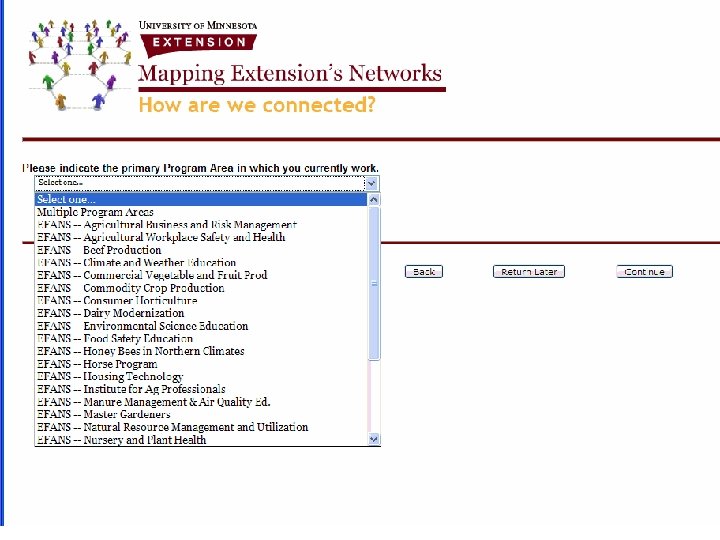
Step 2: Frame the parameters • Who is included • Demographic parameters • Organization parameters • Relationship parameters • Time range parameters
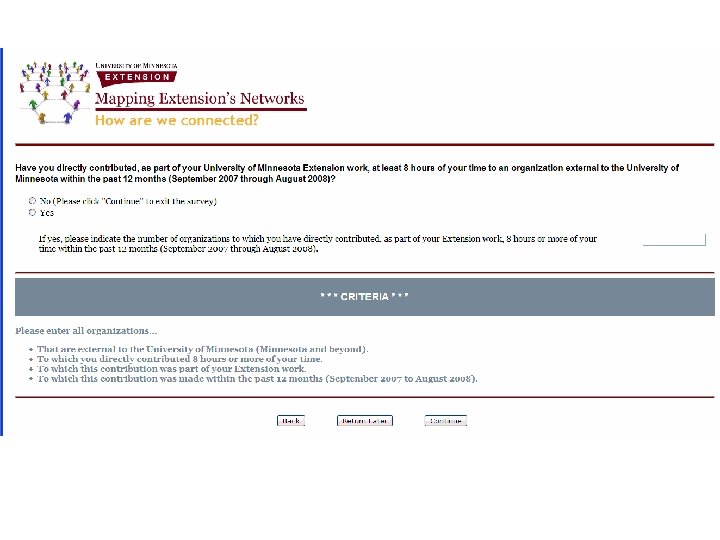
Step 2: Frame the parameters CRITERIA: Eligible organizations needed to meet all three of the following criteria— • Organization must be external to the University of Minnesota (Minnesota and beyond Minnesota) • Staff must have directly contributed to the organization at least eight hours of work time during the last 12 months (Sept. 2007 - August 2008). Contact time may have been spread out over months. Contributions could include phone conversations, e-mail communications, in-person contact, work on behalf of the organization, and other forms of direct effort. • Contributions to this organization must have been part of University of Minnesota Extension work.
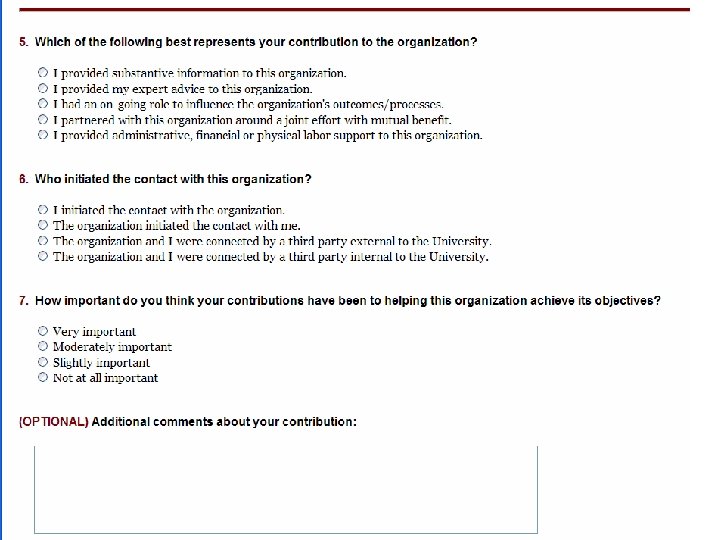
Levels of depth in network relationships Stronger Relationship Partnership around a joint effort with mutual benefit Ongoing role to influence organization’s outcomes/processes Providing expert advice Providing substantive information Weaker Relationship Administrative, financial or physical labor support.
Steps 3 & 4: Develop survey questions, instrument, and pilot • Four months of discussions! • Network preparation form • Piloted survey • Refined parameters
Step 5: Administer survey and collect responses • Expectation that everyone in Extension complete survey • Communications plan – Dean and Associate dean letters – Reinforcing support from other leadership • Survey due date of three weeks, open for about a month • Incentives • Friendly (and not so friendly) reminders
Step 5: Administer survey Results: • 96% response rate across all UM Extension • 3, 959 organization entries made • 561 staff members entered at least 1 org. • Maximum number entered by one person=39
Manipulating the Data
Step 6: Clean and Code Here’s what you get when you ask for no acronyms! ACGC Day Care Kids Action For Healthy Kids Ada/Borup school district Adam Abdulle Academy ADM Animal Nutrition Adult Basic Education - District 241 Adult Basic Education Center Adult Basic Education, English as a second language Adult Basic Educations - Family Literacy Class Adult Group Probation through Wright County Court Services Adult Learning Center - Columbia Heights Adult Learning Cooperative of Le Sueur Adult learning programs Independent school District 191 Advanced Crop Advisors Workshop Advocacy Leadership for Vital Aging Network Affordable Comfort Affordable Comfort, Inc.
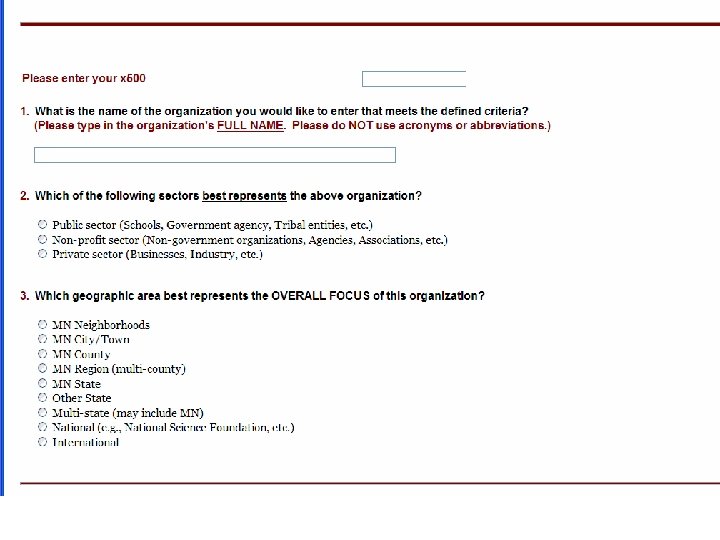
Step 6: Clean and Code Generate categories: We came up with 38 1 Advocacy Organizations 2 Banks/Credit Companies 3 Chambers of Commerce 4 Churches, Mosques, Synagogues, Temples, etc. 5 City Governments 6 Coalitions and Networks 7 Community Action Agencies 8 Community Education 9 Community/Cultural Organizations 10 County Governments 11 Early Childhood Education Organizations 12 Extension Affiliate Organizations 13 Fair Boards 14 Federal Government 15 Financial Service Organizations 16 Food Shelves/Nutrition Organizations 17 Foundations 18 Health-focused Organizations 19 Higher Education Institutions 20 Housing/Economic Development Organizations 21 Law Enforcement/Courts 22 Libraries 23 Media Organizations 24 Natural Resource Conservation Organizations 25 Nursing Homes/Assisted Living Centers 26 Parks and Recreation Organizations 27 Private Businesses 28 Private Schools 29 Professional Associations 30 Public Policy Organizations/Think Tanks 31 Public Schools 32 Social Service Organizations 33 Soil and Water Conservation Districts 34 State Government 35 Trade Associations 36 Tribal Governments 37 Workforce Development Organizations 38 Youth Program Organizations
Step 6: Clean and Code Excel file demonstration
Creating Network Maps
Step 7: Analyze – descriptive information using SPSS Demonstration • Frequencies – Categories across Extension – Select one program area or Center • Crosstabs – Connections by region – Levels of connections by scope of position
Extension’s Top Ten Categories of Connections (total number of connections reported was 3, 958) Number of connections (8 hours or more contact time between an Extension staff member and an organization in this category) Percent Public Schools 454 11. 5 County Governments Trade Associations 318 274 8. 0 6. 9 Professional Associations 228 5. 8 State Government 228 5. 8 Social Service Organizations (non-county) 227 5. 7 Private Businesses 184 4. 6 Federal Government 145 3. 7 Community Education 140 3. 5 Housing/Economic Development Organizations 120 3. 0 Organizational category
Pu bli un c S ty ch Go oo v l Tra e r Pro nm s de en As fes ts sio soc na iat l A i o n sso So Sta cia s te l S t i G o erv ns ov ern ice O m Ho Pri rgani ent us va ing te zatio /Ec Fe ns Bu on de sin om ral ess Co i G c es De ov mm Na ern Co tur un mm velop m al i t e y Re sou unity ment Edu nt cat O /Cu rce rga ion ltu Co niz r ns ati erv al Or o ga ati niz ns on Co a O tio alit Hig ns ion rgan he i z s ati r E an on He du s alt cat d Ne h-f t i w o Ea n I ork oc rly us ns Ch ed titu s Ba ild O tio n h r k ga oo So niz ns d E s/Cre il a a nd dit du tio W c ns ate ation Com p r C O a ni r on Fo ser ganiz es od Sh va a tio elv ns n Cit es/ y G Dist Ex N utr r ten ict ov it s e sio n A ion O rnme rga Yo ffil n ts uth iat e O nizat Pr ion og rga s ram niz ati O Nu o r ga rsi niz ns ng ati Ho Fo on Me me un s d s/A ia da O t ssi ion r g st an s iz Ad ed Li vo vin ation cac s g y O Cen Pu t rga ers bli Co niz c P ati olic mmu o nit Fa y Pa ir B ns y A rks Orga c o tio n an n A ards d R izatio g ns ecr /Th encie ea s ink tio n Ch Ta am Org Wo n k an be rkf iza s rs orc tio of e D ns Tri Co ev b m al elo me Go Ch p rc me ve urc rnm e nt he Or s, e nts ga Mo niz squ La ati w es, on En Sy s for Lib na c r e Fin ari go m gu es an es, ent/C cia Te l S o u erv rts mp ice les O , etc rga. Pri nizat ion va te s Sc ho ols Co Extension's Connections with External Organizations, by Category 454 (3, 958 connections reported for period of September 2007 through August 2008) 318 274 228 227 184 145 140 120 115 112 108 104 97 96 92 87 82 81 73 70 62 52 51 50 49 40 36 35 29 29 28 17 14 11 9 7
Depth of Extension’s connections with external organizations (percents, based on 3, 958 connections) 43. 1% 22. 4% 15. 7% 11. 3% 7. 5% Partnered around a Had on-going role joint effort with to influence mutual benefit organization's outcomes or processes Provided expert advice Provided substantive information Provided administrative, financial or physical labor support
Contributions (over eight hours) of Extension staff to county government offices/agencies, by scope of staff member's position (local, regional, or state) (based on 318 reported connections) Local Regional State 42. 9% 39. 8% 36. 4% 25. 1% 20. 5% 18. 2% 15. 6% 10. 0% 23. 8% 18. 2% 14. 3% 11. 1% 6. 8% Partnered with the Had an on-going role organization around a to influence the joint effort with organization's mutual benefit outcomes/processes 9. 5% 7. 9% Provided expert advice Provided substantive information Provided administrative, financial or physical labor support
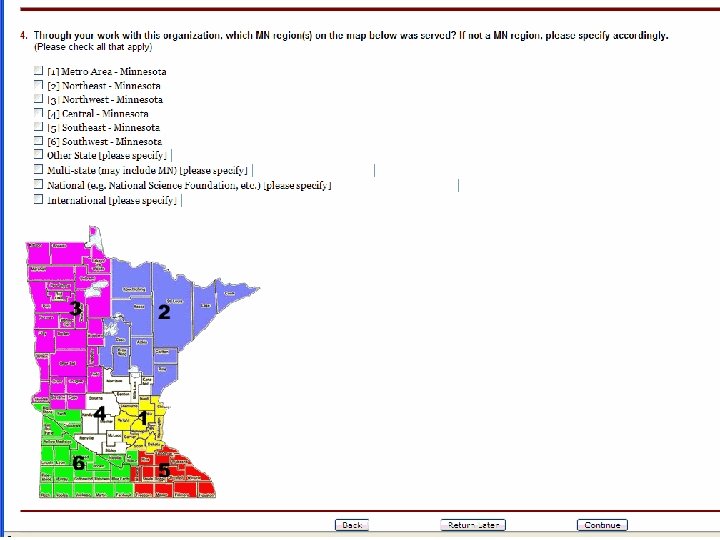
Contributions (over eight hours) of Extension staff to external organizations, by region (based on 3, 527 contributions, more than one region per contribution possible ) 1316 1269 1200 1179 1075 988 (1) Twin Cities (2) Northeast (3) Northwest Metropolitan Minnesota Area (4) Central Minnesota (5) Southeast (6) Southwest Minnesota
Depth of connections, by Center and Extension-wide All Extension (n=3958) Central Extension not Center specific (n=427) Center for Youth Development (n=620) Center for Food, Agriculture and Natural Resource Sciences (n=1313) Center for Family Development including NEA (n=1189) Center for Community Vitality (n=409) 22. 4% 13. 3% 15. 7% 11. 2% 10. 1% 8. 9% 10. 6% 15. 0% 18. 9% 32. 3% 25. 2% 11. 3% 43. 1% 30. 9% 7. 5% 34. 4% 59. 7% 25. 3% 10. 5% 15. 4% 5. 8% 13. 6% 36. 9% 10. 1% 9. 5% 45. 0% Provided substantive information Provided expert advice Had on-going role to influence organization's outcomes or processes Partnered around a joint effort with mutual benefit Provided administrative, financial or physical labor support 5. 3% 2. 1% 4. 9%
Step 7: Analyze – creating network maps using SPSS and UCINET The Steps: • SPSS select program, run crosstab • Copy and paste into Excel • Remove unneeded rows and columns • Copy and paste into UCINET Data Editor • UCINET -- Net. Draw basics UCINET tutorial http: //faculty. ucr. edu/~hanneman/nettext/
Step 7: Analyze – creating network maps using SPSS and UCINET Demonstration • Mapping Family Development Program Relations to Organizations
Programs and Organizational Connections: The All Extension View
Step 7: Analyze – creating network maps using SPSS and UCINET Demonstration • Mapping Program Relations to Organizational Categories
U of MN Extension program areas connect with many types of organizations
County government connections at the core
Step 7: Analyze – creating network maps using SPSS and UCINET Demonstration • Focusing in on a specific category (county government, tribal organizations)
Extension’s program connections with county government
Engaging Staff and Using the Findings
Accountability and reporting • • Federal report State legislative testimony County government partners University-wide public engagement
Promoting internal collaboration • Program teams sometimes don’t know they work with similar audiences • Program teams may need to share their connections • Build on connections that are not shared across Extension • Regional directors can identify gaps and encourage collaboration
Generating new resources • Can identify private sector and philanthropic connections • Can focus grant activity on work that builds upon or strengthens existing partnerships • Can move program activity from providing information to deepening engagement
Creating groundwork for Extensionwide impact studies • 2008 study was baseline; follow-up planned for 2011 • Enables an Extension-wide scope for impact studies of specific communities, regions, or sectors • Identifies dominant sectors of Extension outreach for further survey or interviewbased projects.
Limitations and Lessons Learned
Limitations • Very labor intensive, but also provides very rich data for organizational development • Very large dataset -- challenging to catalogue all organization names and identify duplicates • Great response rate, but quality of response varied • Follow-up study will likely have higher data quality – difficult to compare
Lessons Learned • Staff “buy-in” is absolutely crucial • Include all staff in the study • Make parameters very clear (e. g. # of hours of contact) • Someone’s got to be the guinea-pig who learns how to use UCINET! • BUT, you don’t have to be that much of an SNA expert • Data has more potential than we anticipated
Questions? Scott Chazdon, Evaluation and Research Coordinator Center for Community Vitality schazdon@umn. edu Tom Bartholomay, Evaluation Specialist Center for Food, Agricultural, and Natural Resource Sciences barth 020@umn. edu Kate Walker, Research Associate Center for Youth Development kcwalker@umn. edu