Malnutricin Definicin Los grupos de expertos definen la


 y especificidad (98%), y")


![MNA-SF COMO HERRAMIENTA DE CRIBADO MNA-SF [41] support the use of higher cut-off points](https://slidetodoc.com/presentation_image_h/c605c558b060a999efd09f56c4fdf8ab/image-16.jpg "MNA-SF COMO HERRAMIENTA DE CRIBADO MNA-SF [41] support the use of higher cut-off points")


 2012. �el uso de parámetros antropométricos")


 �Multifactorial �Multicausal �Secundaria al acúmulo de fallos ed diversos sistemas �")


: �IMC = PESO (Kg) / ALTURA (m)2 �<16 Kg/m")
 Permite un diagnóstico rápido en")


 insufficient food and nutrition intake compared with nutrition")

, http:")

 / 100 Obesidad: > 120 Sobrepeso:")
: �mide es la reserva grasa del organismo, �por lo que en")


- Slides: 55
Malnutrición : Definición Los grupos de expertos definen la malnutrición como una situación nutricional aguda, subaguda o crónica en la que existendiferentes grados de desnutrición o sobrenutrición con niveles de inflamación variables, que a la larga suponen una modificación de los compartimentos corporales y un deterioro funcional Guía SEGG-2013
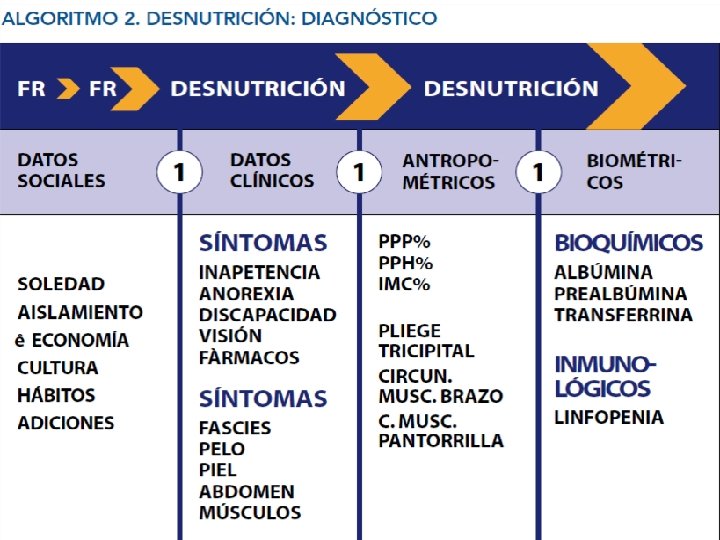
DEFINICIÓN MALNUTRICIÓN El término malnutrición fue descritos según los criterios del American Institute of Nutrition (AIN), que considera la presencia de cifras anormales en uno de los siguientes cuatro parámetros: (IMC, circunferencia braquial, niveles de albúmina y niveles de colesterol) como indicador de afectación del estado nutricional. No obstante, dado que otros indicadores antropométricos y analíticos están relacionados con la desnutrición calóricoproteica, se realizó un segundo cálculo añadiendo a los criterios del AIN los siguientes: cifra de linfocitos, determinación en sangre de transferrina y creatinina. �El criterio para considerar anormal : § § § IMC ≤ 20; Circunferencia braquial ≤ 21 cm; albúmina ≤ 3, 5 g/dl; colesterol ≤ 150 mg/dl; creatinina ≤ 0, 7 mg/dl; transferrina ≤ 200 mg/dl; linfocitos ≤ 1· 103 /u. L y creatinina ≤ 0, 7 mg/dl. Tarazona FJ et al. Validez de la escala MNA como factor de riesgo nutricional en pacientes geriátricos institucionalizados con deterioro cognitivo moderado y severo(Nutr Hosp. 2009; 24: 724 -731)
DEFINING MALNUTRITION: 6 características Comienza cuando la ingesta de nutrientes es inadecuada para satisfacer los requerimientos nutricionales del individuo Produce cambios en el Peso, Composición corporal y función física Desnutrición genera enfermedad ( Infección); Enfermedad acaba en desnutrición. (1) Ingesta insuficiente para los requerimientos (2) Pérdida ponderal mantenida en el tiempo (3) Pérdida de masa muscular (4) Pérdida de Grasa corporal (5) Acumulación de líquidos (6) Disminución objetivable de la fuerza de prensión Hacen falta un mínimo de 2 características. Skipper A. J Parenter Enteral Nutr 2012; 36: 261 -2
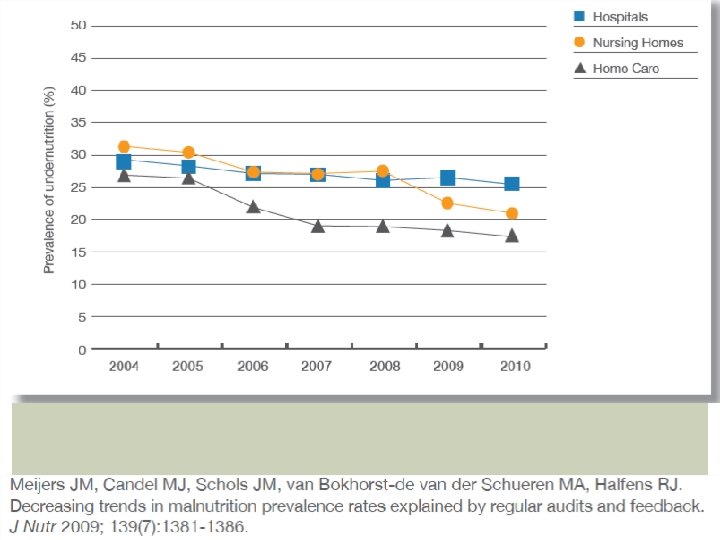
Prevalencia de Desnutrición con MNA
MNA: PREVALENCIA DE DESNUTRICIÓN EN POBLACIÓN ANCIANA ESPAÑOLA �sensibilidad (96%) y especificidad (98%), y además es válido para diferentes ámbitos asistenciales �Prevalencia en población anciana: 16, 6% (intervalo de confianza del 95% [IC 95%] 0 -62) �ancianos hospitalizados (24, 6%; IC 95% 5, 250) �institucionalizados (20, 8%; IC 95% 6 -62) �ancianos en comunidad (6, 9%; IC 95% 016, 6). Milá Villarroel R, , Formiga F, Duran P y Abellana R. Prevalencia de malnutrición en la población anciana española: una revisión sistemática. Med Clin 2012. http: //dx. doi. org/10. 1016/j. medcli. 2012. 04. 008
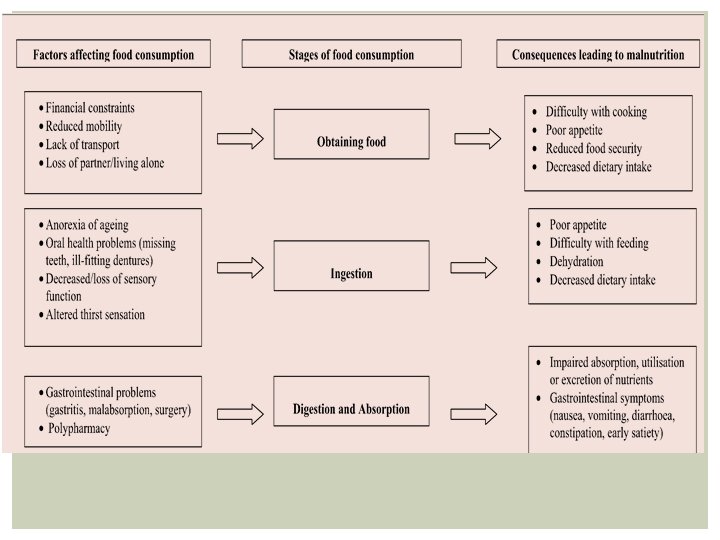
FACTORE RIESGO DESNUTRICION ENERGÉTICO-PROTEICA 9 “D”. • Demencia • Disgeusia • Disfagia • Diarrea • Depresión • Enfermedad • Dentición (Problemas en la ) • Deterioro funcional (Dysfunction) • Drugs (Fármacos)
FACTORES ASOCIADOS DESNUTRICIÓN HPTAL �fracturas óseas �problemas de deglucón � enfermedades respiratorias crónicas � presencia de úlceras por presión �problemas de discapacidad o cognición �Falta de un método de evaluación que sirva como referencia
Lo que dicen que hay que tener en cuenta… �Rangos variables de IMC en según qué estudios(18, 5 -22) �Factores más comúnmente asociados a la pérdida de peso: �En todos los trabajos: § Depresion, Ingesta Inadecuada, problemas de masticación, problemas de Deglución, Dependencia para la alimentación. �En la mayoría de los trabajos: § Demencia, Dependencia funcional § Menor probabilidad de pérdida ponderal: Número de personal. Tamura BK, Bell C l, Masaki KH. Factors associated with weight loss low BMI, and malnutrition among nursing home patients: a systemic review of the literature. JAMDA 2013; 14: 649 -55.
APORTE ENERGÉTICO �OMS: § disminución del gasto calórico 10% cada 10 años a partir de los 60 años. �Dietas por debajo de los 1. 500 Kcal, : Riesgo de déficits en macro y/o micronutrientes. Diesta inferiores a 1. 200 Kcal son deficitarias ( Buscar bibliografía)
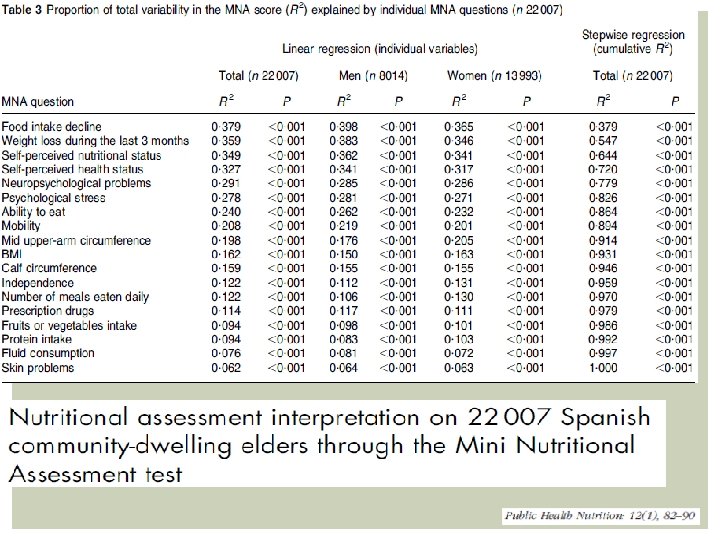
MNA �MNA short form with respect to the full MNA : sensitivity: 85. 2 %). The specificity: 88. 9%; positive predictive value possible undernutrition): 76, 4%; negative predictive value: 93, 4% �Undernutrition : 4, 3%; undernutrition risk is 25? 4 %, using the MNA test in two steps �BMI (kg/m 2) evidenced that 43? 0% of the studied sample was overweight and 30? 2% was obese, which suggests that not only undernutrition is important in the elderly popula- tion. Overweight rates in men and women were similar to the prevalence reported by Gutierrez -Fisac et al. (38) �women presented higher BMI values than men in contrast with the fact that women presented more undernutrition prevalence too, measured by the MNA test, � 9, 2% of the undernourished elderly, according to MNA criteria, presented BMI>= 30 � Food intake decline and weight loss during the last three months were the items that correlated better with the total MNA score. Cuervo M et al. Nutritional assessment interpretation on 22 007 Spanish community-dwelling elders through the Mini Nutritional Assessment test. Public Health Nutrition 2008; 12: 82– 90
MNA-SF COMO HERRAMIENTA DE CRIBADO MNA-SF [41] support the use of higher cut-off points to identify PEM in older adults. The rationale for higher BMI cut-off points is that older adults are likely to [44]: � • have a smaller proportion of lean body mass than younger adults (as a result of ageing, PEM, or inactivity); � • shorten with age due to the compression associated with an osteoporotic spine (kyphosis). � moderately higher BMI is protective against mortality. �BMI < 22 kg/m 2 increased the risk of fracture by 38% and mortality by 52% in a sample of 1846 older adults in residential aged care
ITEMS PREDICTIVOS DEL SCORE FINAL DEL MNA Factores más importantes: �Disminución de la Ingesta �Pérdida ponderal �Autopercepción de estado nutricional y de Salud. The questions Segundo grupo de Factores: � neuropsychological problems, psychological stress � Alimenatción autónoma � Movilidad � Circunferencia Media del Brazo � IMC
Leistra E, Langius JAE, Evers AM, van Bokhorst-de van der Schueren MAE, Visser M, de Vet HCW, Kruizenga HM. Validity of nutritional screening with MUSTand SNAQ in hospitaloutpatients. European Journal of Clinical Nutrition (2013), 1– 5
DIFICULTAD DE VALORACIÓN CON MNA-SF O HERRAMIENTAS DE SCREENING VS VALORACIÓN NUTRICIONAL The MST and NRS-2002 had the high est accuracy when compared with the SGA [48]. Although MNA-SF had a high sensitivity with MNA, it demonstrated poor specificity and positive predictive value when compared with the SGA [48]. The MNA-SF was developed to identify patients requiring com- prehensive assessment using the MNA, and therefore the inherent differences between MNA and SGA could have explained this result. Several valid malnutrition screening tools, e. g. MST, MNA- SF and MUST are available to identify nutritional risk but further work regarding tools to distinguish between PEM, sarcopenia and cachexia are required Agarwal E, et al. Malnutrition in the elderly: A narrative review. Maturitas (2013), http: //dx. doi. org/10. 1016/j. maturitas. 2013. 07. 013
Herramientas de Valoración NUtricional MUST: § Peso del IMC 33% § Baja su aptitud en ancianos § Infradiagnostica mayores con IMC entre 20 y 22 NRS: Punto de corte del IMC: 18, 5 k/m 2 § NRS-2002: recomendado por la ESPEN en hospitales CONUT: Alb ( 1 er nivel(, Linfos (2º nivel) Colesterol (3 er nivel) § Buena sensibiidad y especificidad. van Bokhorstede van der Schueren. A Systematic Review of Malnutrition Screening Tools for the Nursing Home Setting. JAMDA 15 (2014) 171 -184.
PROPONEN MILÁ R ET AL. MED CLIN (BARC) 2012. �el uso de parámetros antropométricos y bioquímicos, y el MNA. �IMC: en entredicho por diferentes puntos de corte: >18, 5; <20; < 21 Kg/m 2. �MNA limitaciones: § la necesidad de obtener las medidas de talla y peso para calcular el IMC, § no es aplicable a personas con un estado de demencia avanzada. § método recomendado por la European Society of Parenteral and Enteral Nutrition. �registrar de forma sistemática y exhaustiva todos los factores pronósticos a tener en cuenta (capacidad funcional, física, cognitiva y enfermedades asociadas). Salva A, Coll-Planas L, Bruce S, De Groot L, Andrieu S, Abellan G. Nutritional assessment of residents in longterm care facilities (LTCFs): recommendations of the task force on nutrition and ageing of the IAGG European region and the IANA. J Nutr Health Aging. 2009; 13: 475– 83 .
KEY POINTS la Valoración Nutricional forme parte de la Valoración Geriátrica Integral. � ningún marcador de la valoración nutricional, permite valorar el estado nutricional de forma independiente y permanente, ajeno a los problemas o enfermedades orgánicas. La valoración nutricional es un método complejo que requiere la utilización de varios parámetros de forma conjunta. Ya señalamos que ningún criterio de formaaislada, permitirá erigirse como el “gold standard”
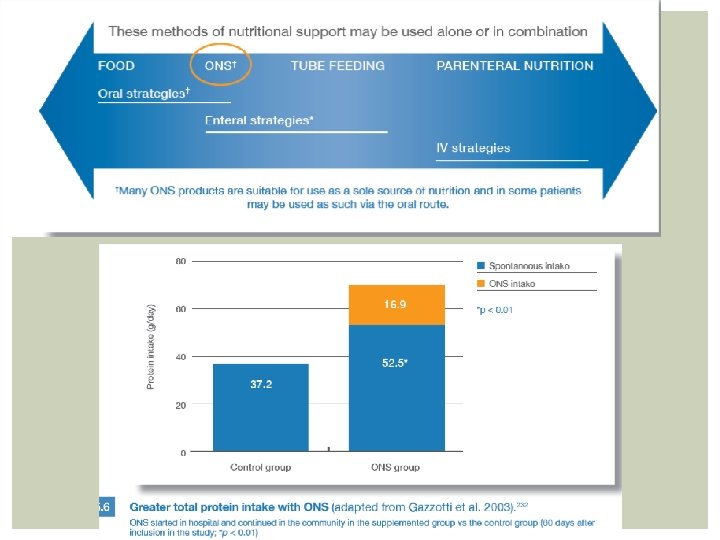
SUPLEMENTOS MULTINUTRIENTES DE ALTA DENSIDAD ENERGÉTICA Y BAJO VOLUMEN
Borrador de Prescripción SON en Centros geriátricos
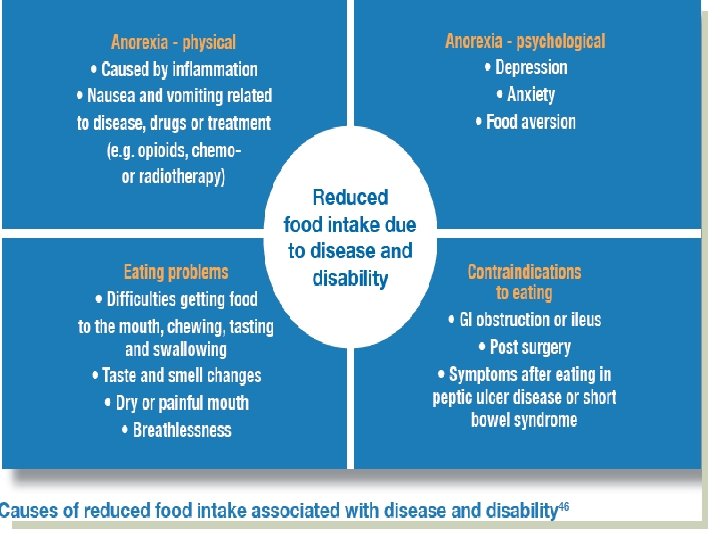
ANOREXIA (LANDI F) �Multifactorial �Multicausal �Secundaria al acúmulo de fallos ed diversos sistemas � Hacen al mayor más vulnerable. �Factores de Riesgo: § Envejecimiento § Cambios biológicos § Factores conductuales, socio-económicos § Enfermedades agudas y crónicas § Tratamientos
SITUACIONES RELACIONADAS CON LA ANOREXIA �impaired wound healing; � impaired immune response to infections; �hypoalbuminemia; � increased synthesis of acute phase proteins such as c-reactive protein, alpha-1 acid glycoprotein, and fibrinogen; �decreased coagulation capacity; �reduced gut function; �intestinal bacterial translocation; �muscle wasting; �and decreased function of respiratory muscles. • Furthermore, anorexia is highly predictive of incident disability, poor quality of life, and all-cause mortality.
ACTIVIDAD FÍSICA Y CALIDAD DE VIDA A TRAVÉS DE LA INDEPENDENCIA FUNCIONAL.
ÍNDICE DE MASA CORPORAL (IMC): �IMC = PESO (Kg) / ALTURA (m)2 �<16 Kg/m 2 = Desnutrición severa � 16 -16, 9 Kg/m 2 = Desnutrición moderada � 17 -18, 4 Kg/m 2 = Desnutrición leve � 18, 5 -22 Kg/m 2 = Desnutrición leve � 22 -29 Kg/m 2 = Normal> 30 Kg/m 2 = Obesidad
MNA Por lo tanto, el nuevo MNA® : a) Permite un diagnóstico rápido en tan sólo tres minutos del estado nutricional del paciente anciano. b) Permite obtener una determinación más precisa del estado nutricional del paciente anciano ambulatorio, institucionalizado o ingresado en hospitales que no puede bipedestar. c) Es un test fácil de usar, válido, fiable, rápido y económico. Por lo tanto, la versión antigua del MNA® de 18 ítems se recomienda en caso de realizar estudios de intervención o cuando el profesional precise tener un evaluación más completa del paciente
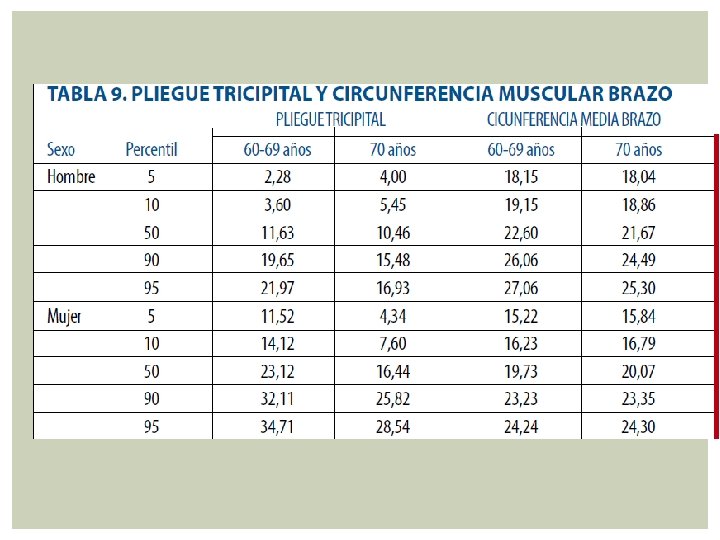
CIRCUNFERENCIA MUSCULAR DEL BRAZO mide la masa muscular del brazo sin ejercer presión sobre la masa grasa ni el tejido subcutáneo, mediante una cinta métrica, con el método anteriormente descrito, en centímetros. Con ello se pretende medir aproximadamente la masa muscular o reserva proteica orgánica CMB = Perímetro del brazo (cm) – (0, 314 x Pliegue Tricipital (mm). Severa <60% del Percentil 50, Moderada 60 -90% del Percentil 50 y Leve >90% del Percentil 50
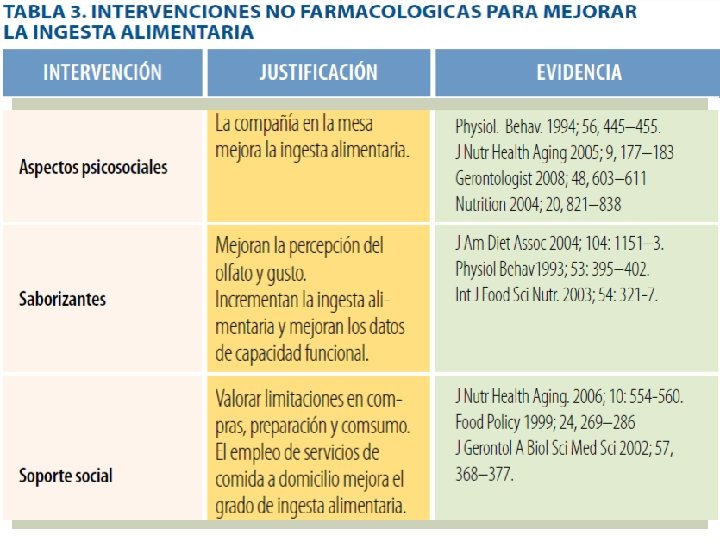
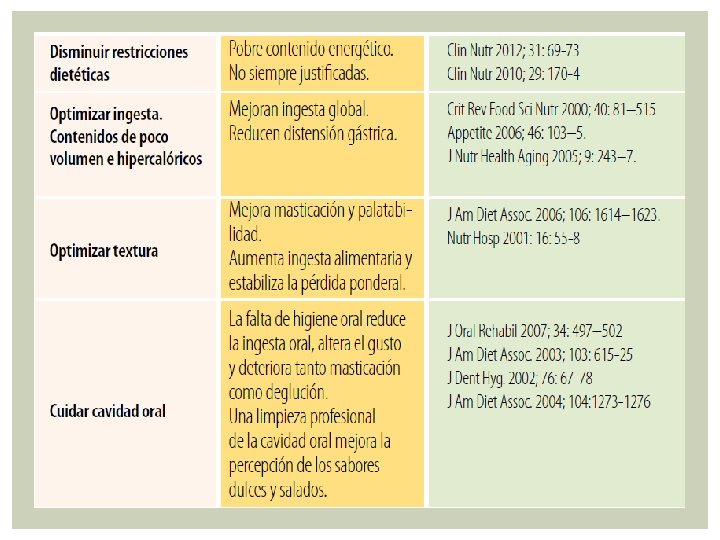
OBJETIVOS DE LA INTERVENCIÓN NUTRICIONAL
IMPLEMENTING THE DEFINITIONS AND CLINIC AL CHARACTERI STICS OF MALNUTRITION �The definitions and clinical char- acteristics of malnutrition will be a major change in facilities using lists of medical diagnoses, comparison of actual and ideal weight, and laboratory data to diagnose malnutrition. 1. White JV, Guenter P, Jensen G, Malone A, Schofield M, the Academy Malnutrition Work Group, the A. S. P. E. N. Malnutrition Task Force, and the A. S. P. E. N. Board of Directors. Consensus statement: Academy of Nutrition and Dietetics and American Society for Parenteral and Enteral Nutrition: characteristics recommended for the identification and docu- mentation of adult malnutrition (undernutrition). JPEN J Parenter Enteral Nutr. 2012; 36: 275 -283. 2. Jensen GL, Mirtallo J, Compher C, et al. Adult starvation and disease- related malnutrition: a proposal for etiology-based diagnosis in the clinical practice setting from the International Consensus Guideline Committee. JPEN J Parenter Enteral Nutr. 2010; 34(2): 156 -159. 3. 2009 HCUP Nationwide Inpatient Sample. Available at: http: //hcupnet. ahrq. gov/HCUPnet. jsp? Id=F 89 ECA 2 FE 6122199&Form=Sel. PAT&Go. To= MAINSEL&JS=Y. Accessed March 12, 2012.
6 CLINICAL CHARACTERISTICS OF MALNUTRITION �(1) insufficient food and nutrition intake compared with nutrition requirements � (2) weight loss over time � (3) loss of muscle mass � (4) loss of fat mass � (5) fluid accumulation �(6) measurably diminished grip strength. �Documenting data for all 6 clinical characteristics suggests that the assessment was complete. However, a minimum of 2 characteristics are recommended to diagnose malnutrition. Skipper A. J Parenter Enteral Nutr 2012; 36: 261 -2
DIFERENCIA STARVATION: MALNUTRITION ENERGY-PROTEIN �The major factor that distinguishes starvation from other syndromes of unintentional weight loss is that it is reversed when adequate energy and protein intake is achieved Agarwal E, et al. Malnutrition in the elderly: A narrative review. Maturitas (2013), http: //dx. doi. org/10. 1016/j. maturitas. 2013. 07. 013
Agarwal E, et al. Malnutrition in the elderly: A narrative review. Maturitas (2013), http: //dx. doi. org/10. 1016/j. maturitas. 2013. 07. 013
CRITERIOS DESNUTRICIÓN: PÉRDIDA PONDERAL �rangos como significativos �de riesgo de desnutrición: 7 días: 1 -2%, � 30 días: 5%, 90 días: 7, 5, 180 días: 10%.
Peso Habitual % Pérdida de Peso: Habitual- (Actual/Habitual) / 100 Obesidad: > 120 Sobrepeso: 110 – 120 Normalidad: 96 – 109 % Des. Leve: 85 – 95 % Des. Moderada: 75 – 84 % Des. Grave: < 75 %
PLIEGUE TRICIPITAL (PT): �mide es la reserva grasa del organismo, �por lo que en los mayores presentará �cierto margen de error, ya que la mayoría �de la grasa, se acumula a nivel �abdominal y no a nivel subcutáneo. Percentil <5 = Desnutrición Grave, Percentil 5 -10 = Desnutrición Moderada y Percentil >85 = Sobrepeso.
ANOREXIA Landi F. il. SIRENTE study. J Am Med Dir Assoc 2010; 11: 268 -74.
CAQUEXIA: �Producida por citoquinas proinflamatorias que se producen en al enfermedad cancerosa pero también en el envejecimiento. �cancer cachexia as weight loss greater than 5%, or weight loss greater than 2% in individuals already showing depletion according to current bodyweight and height (body-mass index, BMI; <20 kg/m 2) or skeletal muscle mass (sar- copenia) �Estadios: § precachexia to refractory cachexia. § Assessment for classification and clinical management should include: anorexia or reduced food intake, catabolic drive, muscle mass and strength, functional and psychosocial impairment
CRITERIOS DESNUTRICIÓN �severely undernourished; § BMI o 18. 5 kg/m 2 (age o 65 years) or o 20 kg/m 2 (age X 65 years), or unintentional weight loss of 45% in the lastmonth or 410% in the last 6 months; �moderately undernourished; § BMI 18. 5– 20 kg/m 2 (age o 65) or BMI 20– 22 kg/m 2 (age X 65) or 5– 10% unintentional weight loss in the last 6 months; �not undernourished; § BMI 420 kg/m 2 (age o 65) or BMI 422 kg/m 2 (age X 65) and o 5% unintentional weight loss in the last 6 months. Leistra E, Langius JAE, Evers AM, van Bokhorst-de van der Schueren MAE, Visser M, de Vet HCW, Kruizenga HM. Validity of nutritional screening with MUSTand SNAQ in hospitaloutpatients. European Journal of Clinical Nutrition (2013), 1– 5
TIEMPO PERDIDA SIGNIFICATIVA DE GRAVE DE PESO 1 -2 % >2% 5% >5% 3 meses 7, 5% > 7, 5% 6 meses 10% > 10% 1 semana 1 mes