Iterative Closest Point Ronen Gvili www cs tau


 Implicit curves")


 worst case. Given Y")
, e (rot, trans,")
 begin E` + ∞; (Rot, Trans) In Initialize-Alignment(Scene, Model);")


+trans Ek+1 Dk+1 Calculate correspondence Calculate alignment Apply alignment")


 Space: O(n) Region Query")


. 2. Matching to")
![Selection of points n n Use all available points [Besl 92]. Uniform subsampling [Turk](https://slidetodoc.com/presentation_image_h/b33930ee478e5cfc369d16cb31281d69/image-45.jpg "Selection of points n n Use all available points [Besl 92]. Uniform subsampling [Turk")

. 2. Matching to")
![Points matching n n Closest point in the other mesh [Besl 92]. Normal shooting](https://slidetodoc.com/presentation_image_h/b33930ee478e5cfc369d16cb31281d69/image-48.jpg "Points matching n n Closest point in the other mesh [Besl 92]. Normal shooting")


 Project the sample point onto the destination mesh")

. 2. Matching to")


. 2. Matching to")


. 2. Matching to")


 valid point")


- Slides: 84
Iterative Closest Point Ronen Gvili www. cs. tau. ac. il/~dcor/Graphics/adv-slides/ICP. ppt
The Problem n Align two partiallyoverlapping meshes given initial guess for relative transform
Data Types n n n n Point sets Line segment sets (polylines) Implicit curves : f(x, y, z) = 0 Parametric curves : (x(u), y(u), z(u)) Triangle sets (meshes) Implicit surfaces : s(x, y, z) = 0 Parametric surfaces (x(u, v), y(u, v), z(u, v)))
Motivation n n Shape inspection Motion estimation Appearance analysis Texture Mapping Tracking
Motivation n Range images registration
Motivation n Range images registration
Range Scanners
Aligning 3 D Data
Corresponding Point Set Alignment n n Let M be a model point set. Let S be a scene point set. We assume : 1. N M = N S. 2. Each point Si correspond to Mi.
Corresponding Point Set Alignment The MSE objective function : The alignment is :
Aligning 3 D Data n If correct correspondences are known, can find correct relative rotation/translation
Aligning 3 D Data n n How to find correspondences: User input? Feature detection? Signatures? Alternative: assume closest points correspond
Aligning 3 D Data n n How to find correspondences: User input? Feature detection? Signatures? Alternative: assume closest points correspond
Aligning 3 D Data n Converges if starting position “close enough“
Closest Point n n Given 2 points r 1 and r 2 , the Euclidean distance is: Given a point r 1 and set of points A , the Euclidean distance is:
Finding Matches n n The scene shape S is aligned to be in the best alignment with the model shape M. The distance of each point s of the scene from the model is :
Finding Matches C – the closest point operator Y – the set of closest points to S
Finding Matches n Finding each match is performed in O(NM) worst case. Given Y we can calculate alignment n S is updated to be : n
The Algorithm Init the error to ∞ Y = CP(M, S), e (rot, trans, d) S`= rot(S)+trans d` = d Calculate correspondence Calculate alignment Apply alignment Update error If error > threshold
The Algorithm function ICP(Scene, Model) begin E` + ∞; (Rot, Trans) In Initialize-Alignment(Scene, Model); repeat E E`; Aligned-Scene Apply-Alignment(Scene, Rot, Trans); Pairs Return-Closest-Pairs(Aligned-Scene, Model); (Rot, Trans, E`) Update-Alignment(Scene, Model, Pairs, Rot, Trans); Until |E`- E| < Threshold return (Rot, Trans); end
Convergence Theorem n The ICP algorithm always converges monotonically to a local minimum with respect to the MSE distance objective function.
Convergence Theorem n Correspondence error : n Alignment error:
Convergence Theorem Ek Dk S`= rot(S)+trans Ek+1 Dk+1 Calculate correspondence Calculate alignment Apply alignment Calculate correspondence Calculate alignment
Convergence Theorem n Proof :
Convergence Theorem n Proof : If not - the identity transform would yield a smaller MSE than the least square alignment. Apply the alignmentqk on S 0 Sk+1. Assuming the correspondences are maintained : the MSE is still dk.
Convergence Theorem n Proof : After the last alignment, the closest point operator is applied : It is clear that: Thus :
Time analysis Each iteration includes 3 main steps A. Finding the closest points : O(NM) per each point O(NM*NS) total. B. Calculating the alignment: O(NS) C. Updating the scene: O(NS)
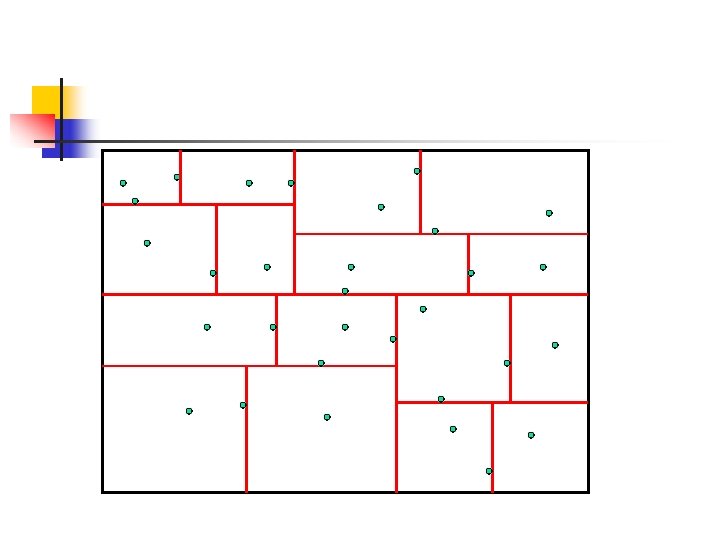
Optimizing the Algorithm The best match/nearest neighbor problem : Given N records each described by K real values (attributes) , and a dissimilarity measure D , find the m records closest to a query record.
Optimizing the Algorithm n K-D Tree : Construction time: O(knlogn) Space: O(n) Region Query : O(n 1 -1/k+k )
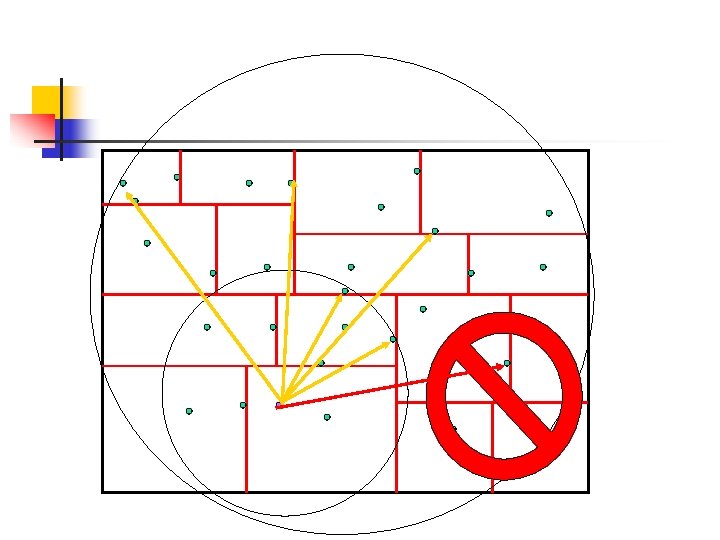
Optimizing the Algorithm Optimizing the K-D Tree : n n Motivation: In each internal node we can exclude the sub K-D tree if the distance to the partition is greater than the ball radius. Adjusting the discriminating number, the partition value , and the number of records in each bucket.
Optimizing the Algorithm
Optimizing the Algorithm
Optimizing the Algorithm
Optimizing the Algorithm n Optimizing the K-D Tree : We choose in each internal node the key with the largest spread values as the discriminator and the median as the partition value.
Optimizing the Algorithm n The Optimized K-D Tree : Construction time : Tn = 2 Tn/2+k. N = O(KNlog. N) Search time: O(log. N) Expected.
Optimizing the Algorithm n The Optimized K-D Tree : The algorithm can use the m-closest points to cache potentially closest points.
Optimizing the Algorithm n As the ICP algorithm proceeds a sequence of vectors is generated : q 1, q 2, q 3, q 4 …
Optimizing the Algorithm n n n Let be a small angular tolerance. Suppose : Instead of 50 iterations in the ICP , this accelerated variant converges in less than 20 iterations.
Time analysis Each iteration includes 3 main steps A. Finding the closest points : O(NM) per each point O(NMlog. NS) total. B. Calculating the alignment: O(NS) C. Updating the scene: O(NS)
ICP Variants n Variants on the following stages of ICP have been proposed: 1. 2. 3. 4. 5. 6. Selecting sample points (from one or both meshes) Matching to points in the other mesh Weighting the correspondences Rejecting certain (outlier) point pairs Assigning an error metric to the current transform Minimizing the error metric w. r. t. transformation
Performance of Variants n Can analyze various aspects of performance: n Speed n Stability n Tolerance of noise and/or outliers n Maximum initial misalignment
ICP Variants 1. Selecting sample points (from one or both meshes). 2. Matching to points in the other mesh. 3. Weighting the correspondences. 4. Rejecting certain (outlier) point pairs. 5. Assigning an error metric to the current transform. 6. Minimizing the error metric w. r. t. transformation.
Selection of points n n Use all available points [Besl 92]. Uniform subsampling [Turk 94]. Random sampling in each iteration [Masuda 96]. Ensure that samples have normals distributed as uniformly as possible [Rusinkiewicz 01].
Selection of points Uniform Sampling Normal-Space Sampling
ICP Variants 1. Selecting sample points (from one or both meshes). 2. Matching to points in the other mesh. 3. Weighting the correspondences. 4. Rejecting certain (outlier) point pairs. 5. Assigning an error metric to the current transform. 6. Minimizing the error metric w. r. t. transformation.
Points matching n n Closest point in the other mesh [Besl 92]. Normal shooting [Chen 91]. Reverse calibration [Blais 95]. Restricting matches to compatible points (color, intensity , normals , curvature. . ) [Pulli 99].
Points matching n Closest point :
Points matching n Normal Shooting
Points matching § Projection (reverse calibration) Project the sample point onto the destination mesh , from the point of view of the destination mesh’s camera.
Points matching
ICP Variants 1. Selecting sample points (from one or both meshes). 2. Matching to points in the other mesh. 3. Weighting the correspondences. 4. Rejecting certain (outlier) point pairs. 5. Assigning an error metric to the current transform. 6. Minimizing the error metric w. r. t. transformation.
Weighting of pairs n n Constant weight. Assigning lower weights to pairs with greater point-to-point distance : Weighting based on compatibility of normals : Scanner uncertainty
Weighting of pairs The rectangles and circles indicate the scanner reflectance value.
ICP Variants 1. Selecting sample points (from one or both meshes). 2. Matching to points in the other mesh. 3. Weighting the correspondences. 4. Rejecting certain (outlier) point pairs. 5. Assigning an error metric to the current transform. 6. Minimizing the error metric w. r. t. transformation.
Rejecting Pairs n n n Corresponding points with point to point distance higher than a given threshold. Rejection of worst n% pairs based on some metric. Pairs containing points on end vertices. Rejection of pairs whose point to point distance is higher than n*σ. Rejection of pairs that are not consistent with their neighboring pairs [Dorai 98] : (p 1, q 1) , (p 2, q 2) are inconsistent iff
Rejecting Pairs Distance thresholding
Rejecting Pairs Points on end vertices
Rejecting Pairs Inconsistent Pairs q 1 q 2 p 1 p 2
ICP Variants 1. Selecting sample points (from one or both meshes). 2. Matching to points in the other mesh. 3. Weighting the correspondences. 4. Rejecting certain (outlier) point pairs. 5. Assigning an error metric to the current transform. 6. Minimizing the error metric w. r. t. transformation.
Error metric and minimization n Sum of squared distances between corresponding points. There exist closed form solutions for rigid body transformation : 1. 2. 3. 4. SVD Quaternions Orthonoraml matrices Dual quaternions.
Error metric and minimization n Sum of squared distances from each sample point to the plane containing the destination point (“Point to Plane”) [Chen 91]. No closed form solution available.
Error metric and minimization n Using point-to-plane distance instead of pointto-point lets flat regions slide along each other [Chen & Medioni 91]
Error metric and minimization Closest Point
Error metric and minimization Point to plane
Error metric and minimization Search for alignment : n Repeatedly generating set of corresponding points using the current transformations and finding new transformations that minimizes the error metric [Chen 91]. n The above method combined with extrapolation in transform space [Besl 92].
Real Time ICP
Robust Simultaneous Alignment of Multiple Range Images
Motivation
Motivation
Motivation Graph of the twentyseven registered scans of the Cathedral data set. The nodes correspond to the individual range scans. The edges show pair wise alignments. The directed edges show the paths from each scan to the pivot scan that is used as an anchor.
Motivation
Motivation
Registering multiple Images n 1. 2. 3. 4. Sequential : Less memory is needed. Cheap computation cost. Each alignment step is not affected by number of images. Less accurate.
Registering multiple Images n Sequential : as we progress in the alignment the accumulated error is noticeable.
Registering multiple Images n 1. 2. Simultaneous Diffusively distribute the alignment error over all overlaps of each range images. Large Computational cost.
Registering multiple Images n Simultaneous The total alignment error is diffusively distributed among all pairs.
The Algorithm Array KDTrees, Scenes, Point. Mates, Transforms foreach r in All. Range. Images foreach s in All. Range. Image-r Scenes[s] = s foreach i in Pointsof(r) foreach s in Scenes Point. Mates[i] += Correspondence. Search(i, KDTree[s]) Transforms[r] = Transformation. Step(Point. Mates) Transform. All(All. Range. Images, Transforms)
Speeding Up n n During the first iterations it is more important to bring the sets of points closer to each other than to accurately calculate the transform. Random sub sampling of the points.
Outliers Rejection n Outlier thresholding: σ – standard deviation of the error. Eliminate matches with error > |kσ| Some valid points might be classified as outliers, and some outliers might be classified as valid points.
Outliers Rejection n Median/Rank estimation: Calculate the median, which is (almost guaranteed) valid point and use its error as estimation, i. e. Least Median of Squares. Requires exhaustive search.
Outliers Rejection n M-Estimators Instead of minimizing the sum of square residuals , the square residuals are replaced by ρ(ri). Each point is assigned with a likelihood probability (weight) and after each iteration the probability is updated with respect to the residual.
The End