Introduction to MultiLevel Modeling Juliet Aiken Design and

- Slides: 86
Introduction to Multi-Level Modeling Juliet Aiken Design and Statistical Analysis Laboratory November 13, 2009
What to Expect n n Slides will be posted on Da. SAL website (http: //blog. umd. edu/statconsulting/) after the presentation (but not immediately) Not all questions will be answered right now q q n Terminology: q q n n Ask anyway! We’ll write them down and follow up with them before posting the slides online Random Coefficient Modeling: A statistical technique Hierarchical Linear Modeling: A piece of software which can be used to do random coefficient modeling It’s okay if some of this is information overload! I do not care if you get up to get more food in the middle of this
Goals n Understand basics of random coefficient multi -level modeling (RCM) q q q n When to use and when not to use RCM What is a random coefficient? Slopes vs. intercepts as outcomes Provide a platform for further reading and investigation into proper use of RCM q Materials and references for later use
Overview n n n What is multi-level modeling? Multi-level modeling examples What is multi-level modeling? , revisited Why do we care? Multi-level statistical models q q Justification for use Two types of models
Overview n MLM: Random Coefficient Modeling q q n n Distinguishing Random Coefficients from Random Effects Kinds of RC Modeling that can be conducted HLM Show and Tell with HLM
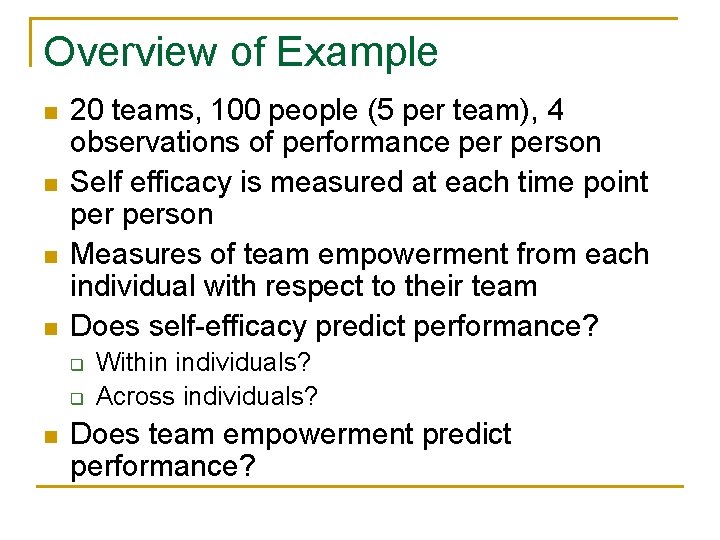
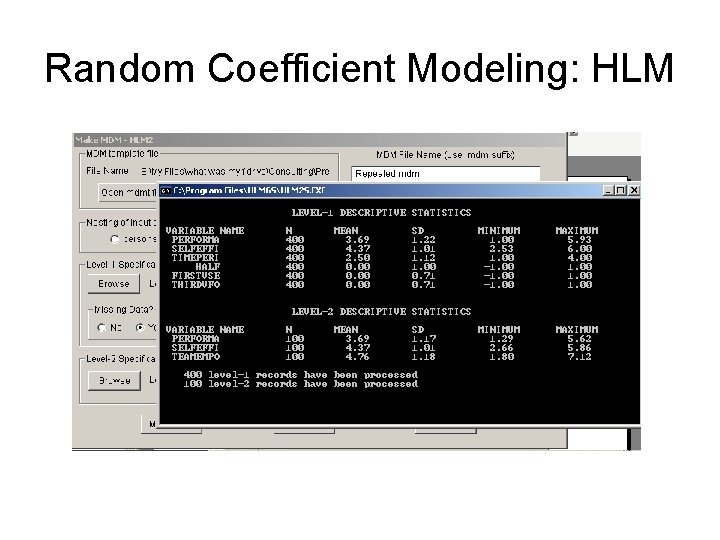
Overview of Example n n 20 teams, 100 people (5 per team), 4 observations of performance person Self efficacy is measured at each time point person Measures of team empowerment from each individual with respect to their team Does self-efficacy predict performance? q q n Within individuals? Across individuals? Does team empowerment predict performance?
What Is Multi-Level Modeling? n n Family of statistical models for data analysis Theory, design, and measurement
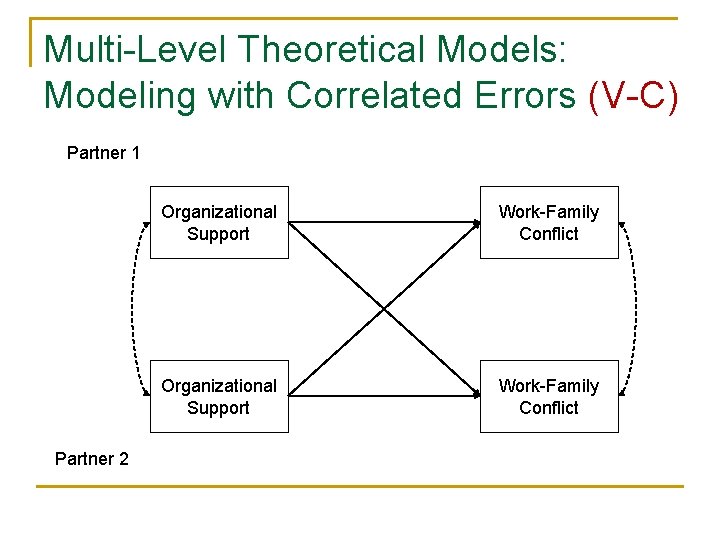
Multi-Level Theoretical Models: Modeling with Correlated Errors (V-C) Partner 1 Partner 2 Organizational Support Work-Family Conflict
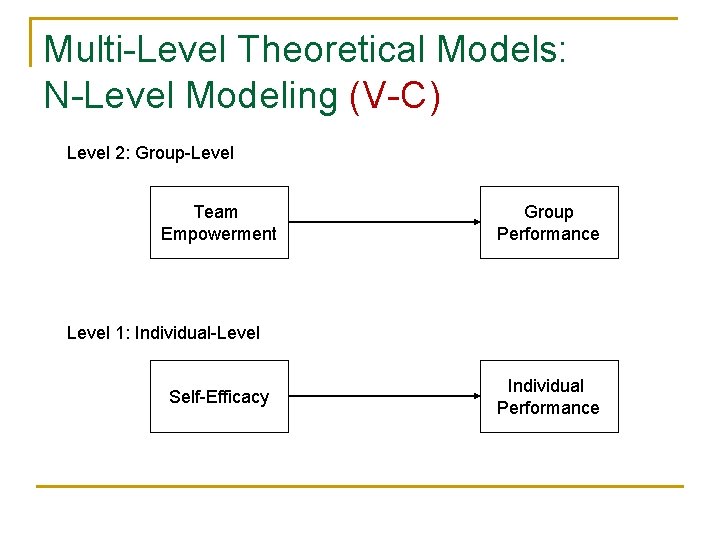
Multi-Level Theoretical Models: N-Level Modeling (V-C) Level 2: Group-Level Team Empowerment Group Performance Level 1: Individual-Level Self-Efficacy Individual Performance
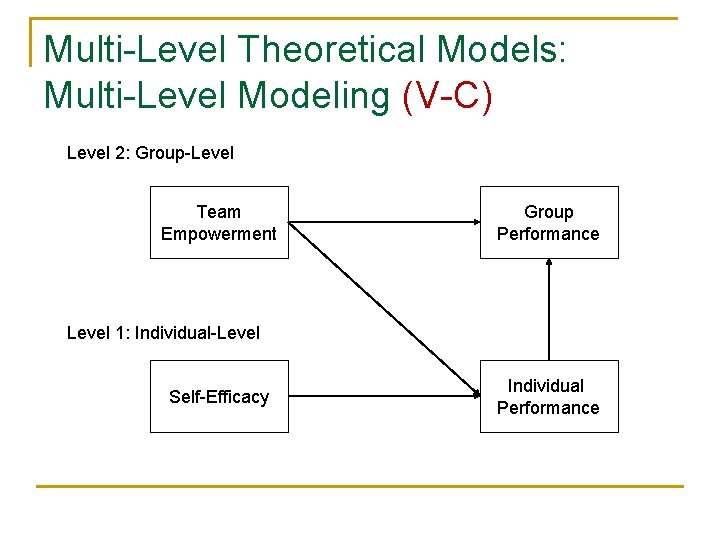
Multi-Level Theoretical Models: Multi-Level Modeling (V-C) Level 2: Group-Level Team Empowerment Group Performance Level 1: Individual-Level Self-Efficacy Individual Performance
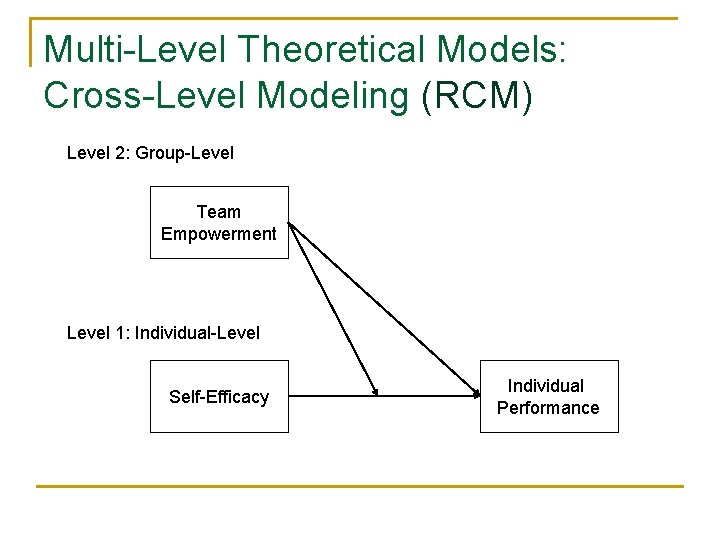
Multi-Level Theoretical Models: Cross-Level Modeling (RCM) Level 2: Group-Level Team Empowerment Level 1: Individual-Level Self-Efficacy Individual Performance
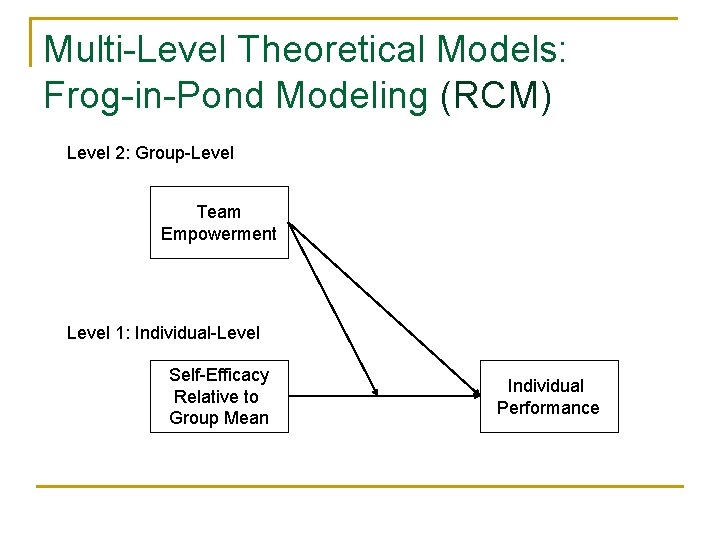
Multi-Level Theoretical Models: Frog-in-Pond Modeling (RCM) Level 2: Group-Level Team Empowerment Level 1: Individual-Level Self-Efficacy Relative to Group Mean Individual Performance
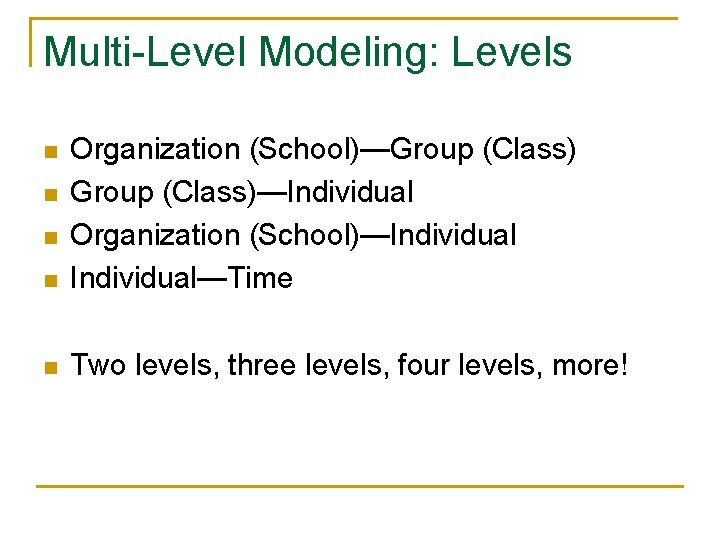
Multi-Level Modeling: Levels n Organization (School)—Group (Class)—Individual Organization (School)—Individual—Time n Two levels, three levels, four levels, more! n n n
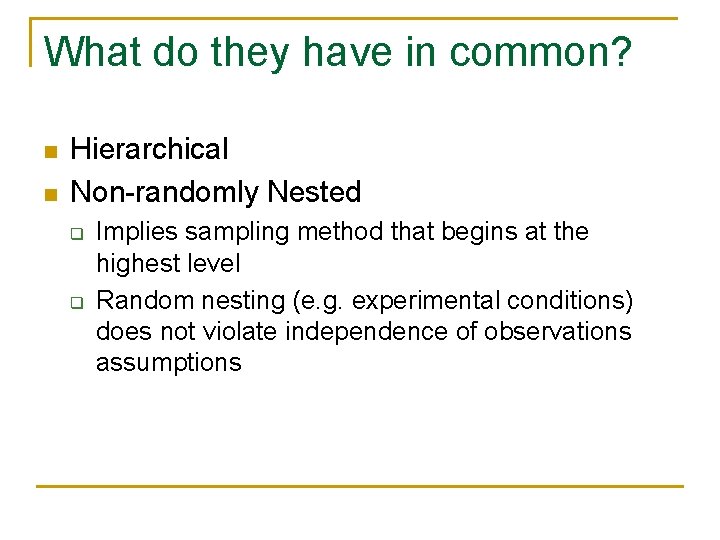
What do they have in common? n n Hierarchical Non-randomly Nested q q Implies sampling method that begins at the highest level Random nesting (e. g. experimental conditions) does not violate independence of observations assumptions
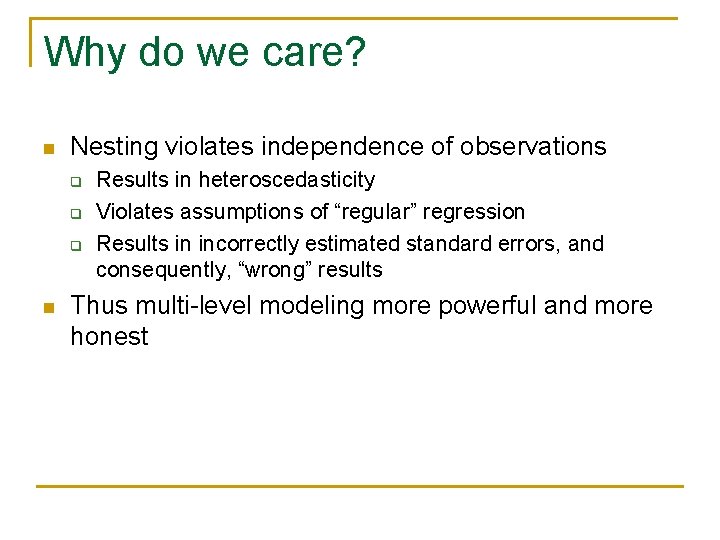
Why do we care? n Nesting violates independence of observations q q q n Results in heteroscedasticity Violates assumptions of “regular” regression Results in incorrectly estimated standard errors, and consequently, “wrong” results Thus multi-level modeling more powerful and more honest
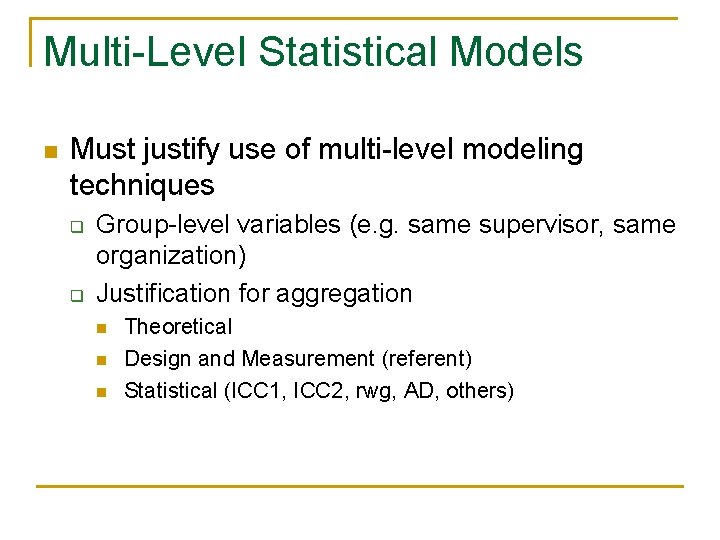
Multi-Level Statistical Models n Must justify use of multi-level modeling techniques q q Group-level variables (e. g. same supervisor, same organization) Justification for aggregation n Theoretical Design and Measurement (referent) Statistical (ICC 1, ICC 2, rwg, AD, others)
Multi-Level Statistical Models n Regression-Based q n Random Coefficient Modeling Variance-Covariance-Based q Latent Growth Analysis (in SEM)
RCM vs. VC n RCM q Path analysis harder q Measured variables q Easy to include interactions q Hard to include correlated errors q Copes with missing data q Easy to add levels n VC q Factor analysis q Path analysis easy q Latent variables q Interactions harder q Different errors easy to add q Harder to cope with missing data q Harder to add levels q Goodness of fit information q Model suggestions to improve fit
Random Coefficient Modeling n Random Effects q q q n Experimental conditions (e. g. for medicine) Fixed: Can infer about treatments used in the experiment Random: For purposes of generalization Random Variables q q Fixed: Variable with values that are known (e. g. gender) Random: Variable with values selected from a probability distribution and are measured with error (e. g. IQ)
Random Coefficient Modeling n Random Coefficients q q n Fixed: Coefficients (e. g. slopes or intercepts) do not vary across people/teams/etc. Random: Coefficients in which values estimated are assumed to be distributed as a probability function Random coefficients do NOT correspond to random effects or variables q Equations versus design/experimental manipulations
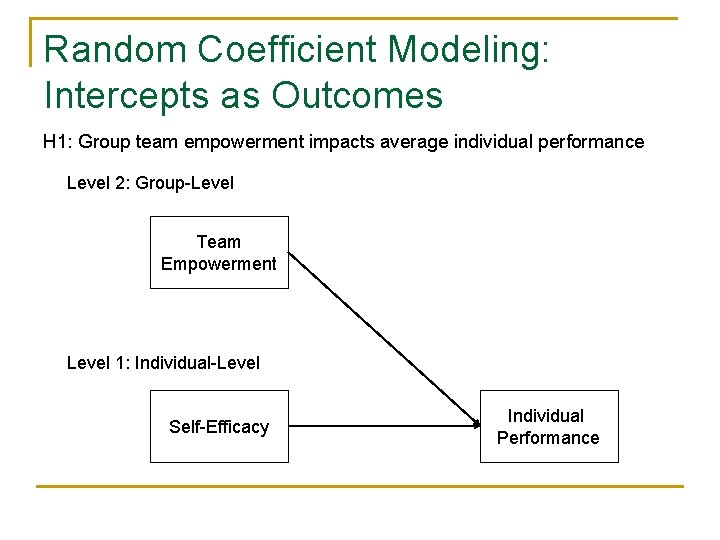
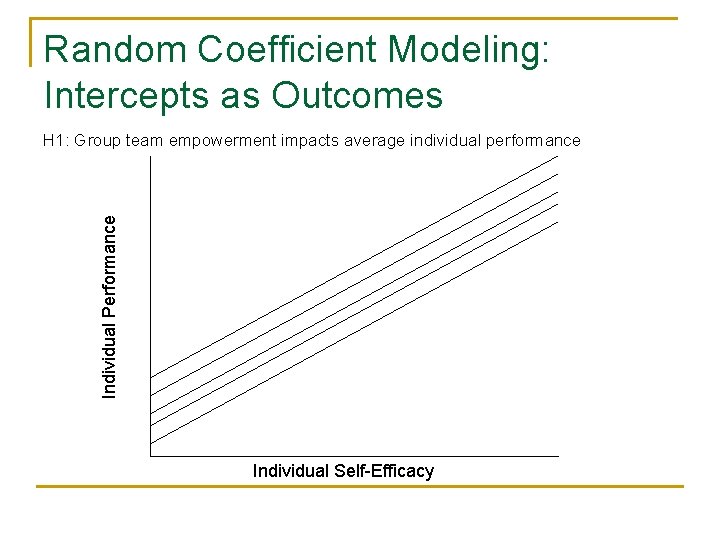
Random Coefficient Modeling n n Extension of the general/generalized linear model Outcome of interest measured at the lowest level “Intercepts as outcomes” “Slopes as outcomes”
Random Coefficient Modeling: Intercepts as Outcomes H 1: Group team empowerment impacts average individual performance Level 2: Group-Level Team Empowerment Level 1: Individual-Level Self-Efficacy Individual Performance
Random Coefficient Modeling: Intercepts as Outcomes Individual Performance H 1: Group team empowerment impacts average individual performance Individual Self-Efficacy
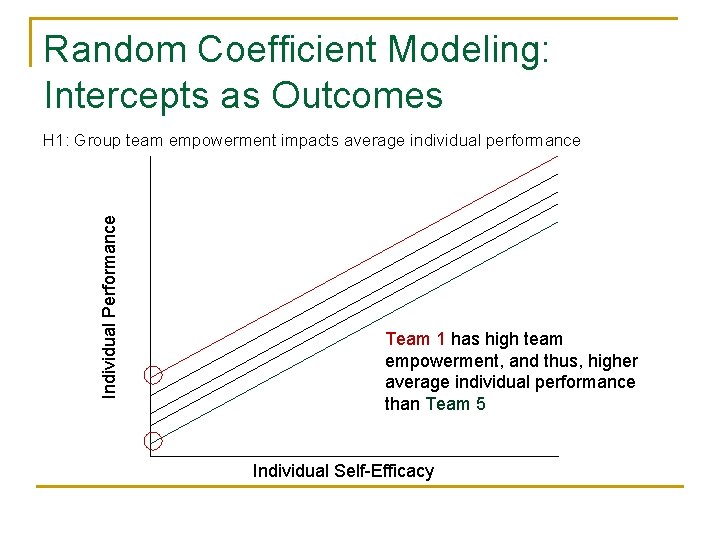
Random Coefficient Modeling: Intercepts as Outcomes Individual Performance H 1: Group team empowerment impacts average individual performance Team 1 has high team empowerment, and thus, higher average individual performance than Team 5 Individual Self-Efficacy
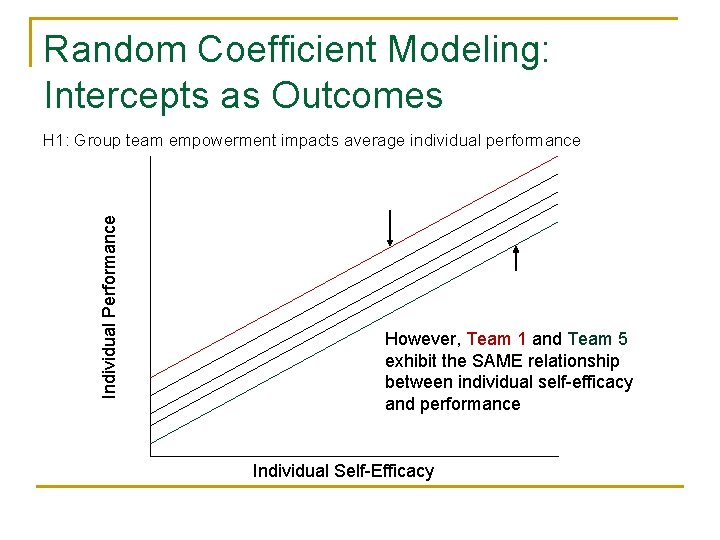
Random Coefficient Modeling: Intercepts as Outcomes Individual Performance H 1: Group team empowerment impacts average individual performance However, Team 1 and Team 5 exhibit the SAME relationship between individual self-efficacy and performance Individual Self-Efficacy
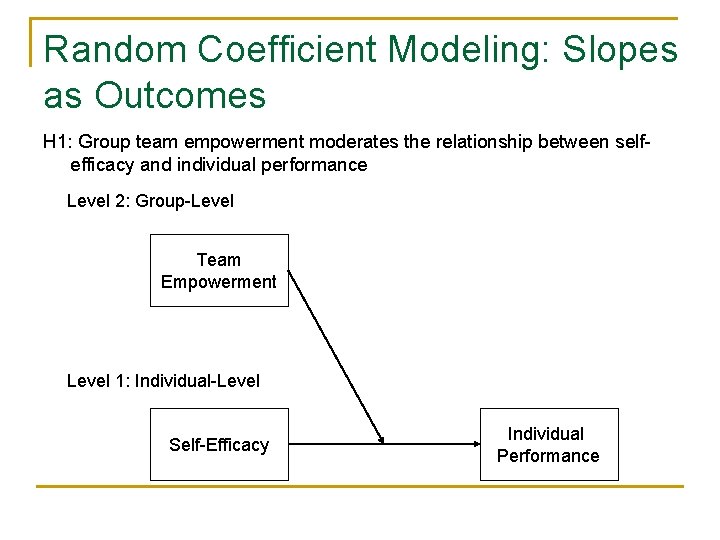
Random Coefficient Modeling: Slopes as Outcomes H 1: Group team empowerment moderates the relationship between selfefficacy and individual performance Level 2: Group-Level Team Empowerment Level 1: Individual-Level Self-Efficacy Individual Performance
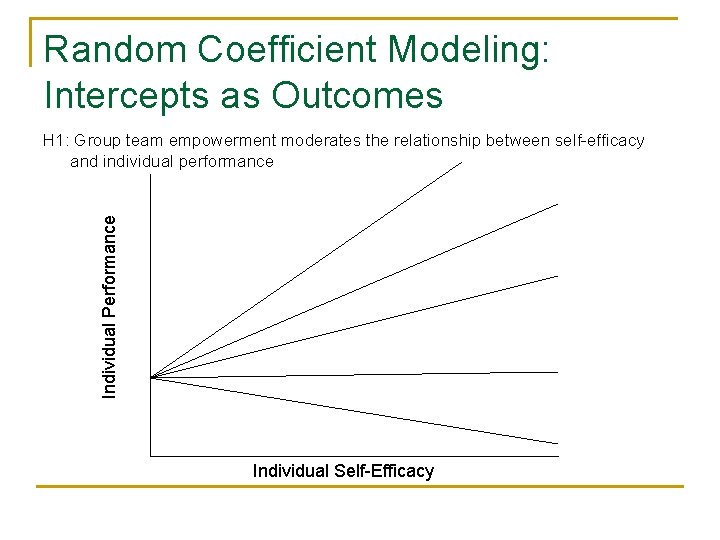
Random Coefficient Modeling: Intercepts as Outcomes Individual Performance H 1: Group team empowerment moderates the relationship between self-efficacy and individual performance Individual Self-Efficacy
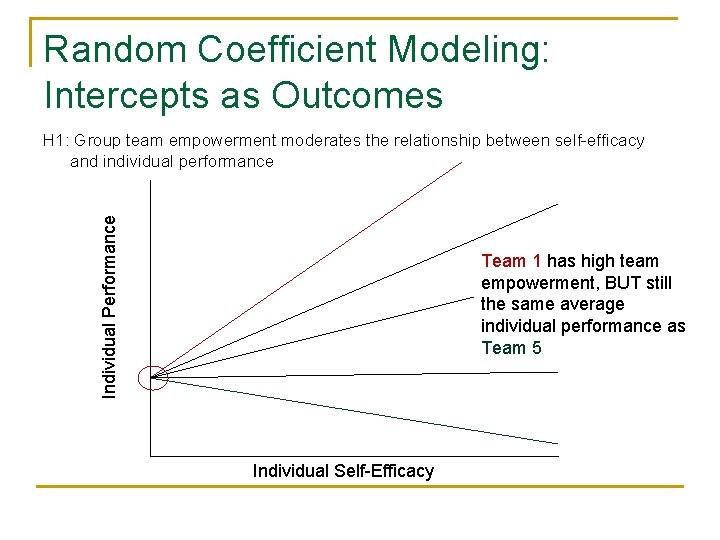
Random Coefficient Modeling: Intercepts as Outcomes Individual Performance H 1: Group team empowerment moderates the relationship between self-efficacy and individual performance Team 1 has high team empowerment, BUT still the same average individual performance as Team 5 Individual Self-Efficacy
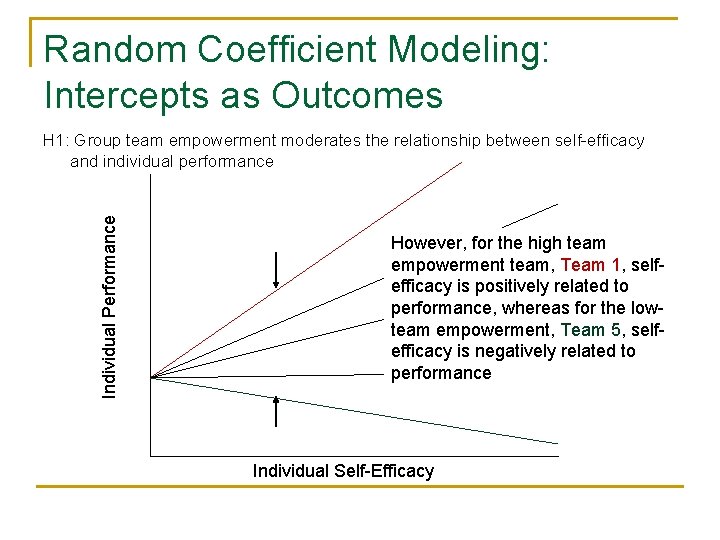
Random Coefficient Modeling: Intercepts as Outcomes Individual Performance H 1: Group team empowerment moderates the relationship between self-efficacy and individual performance However, for the high team empowerment team, Team 1, selfefficacy is positively related to performance, whereas for the lowteam empowerment, Team 5, selfefficacy is negatively related to performance Individual Self-Efficacy
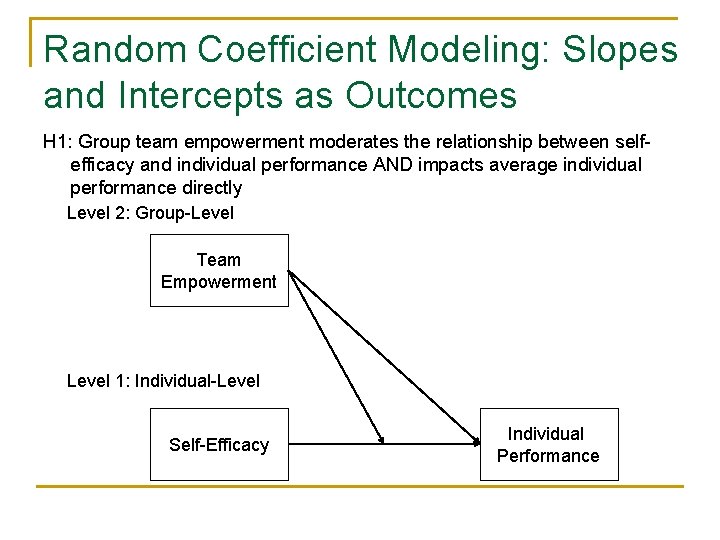
Random Coefficient Modeling: Slopes and Intercepts as Outcomes H 1: Group team empowerment moderates the relationship between selfefficacy and individual performance AND impacts average individual performance directly Level 2: Group-Level Team Empowerment Level 1: Individual-Level Self-Efficacy Individual Performance
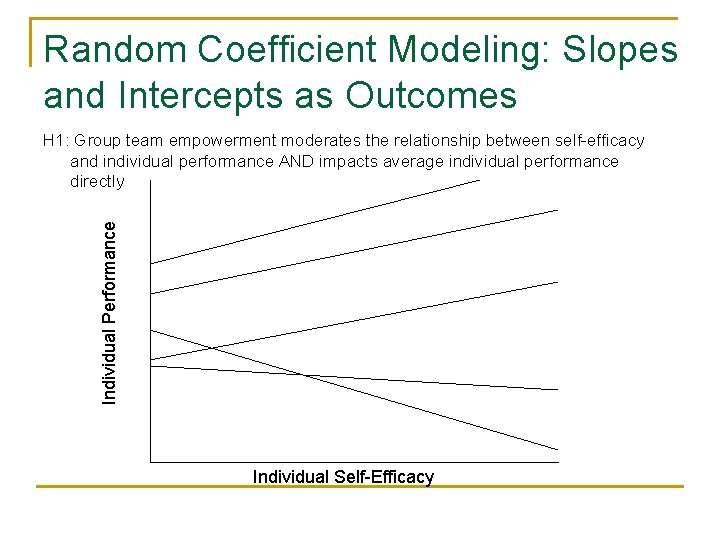
Random Coefficient Modeling: Slopes and Intercepts as Outcomes Individual Performance H 1: Group team empowerment moderates the relationship between self-efficacy and individual performance AND impacts average individual performance directly Individual Self-Efficacy
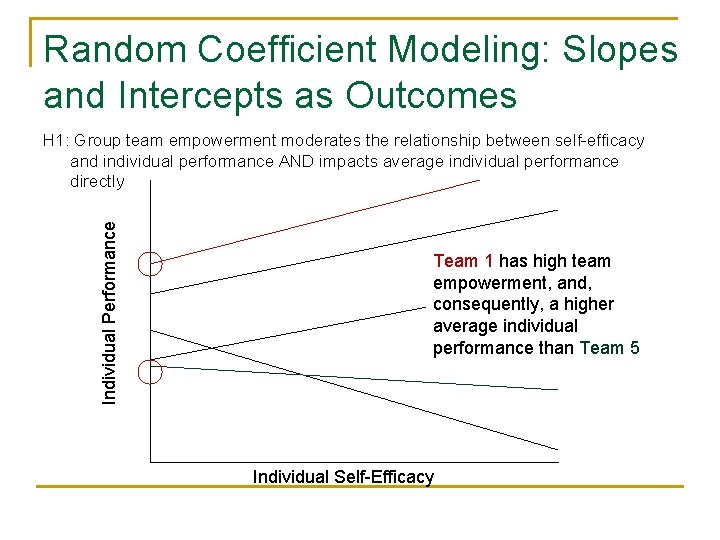
Random Coefficient Modeling: Slopes and Intercepts as Outcomes Individual Performance H 1: Group team empowerment moderates the relationship between self-efficacy and individual performance AND impacts average individual performance directly Team 1 has high team empowerment, and, consequently, a higher average individual performance than Team 5 Individual Self-Efficacy
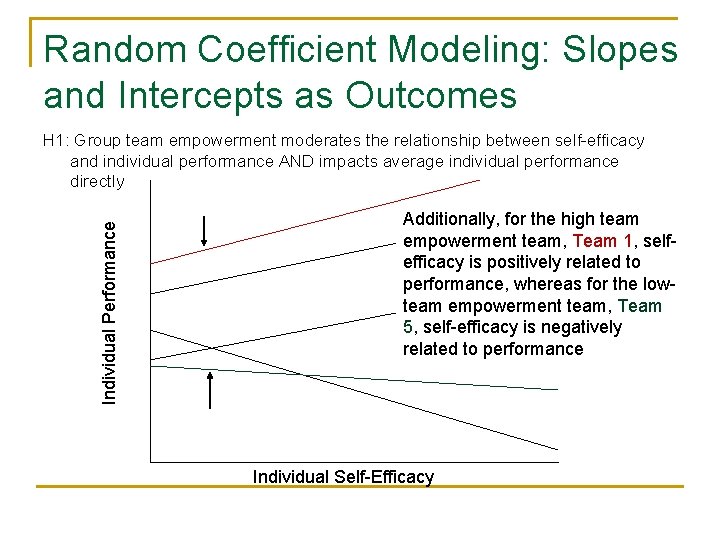
Random Coefficient Modeling: Slopes and Intercepts as Outcomes Individual Performance H 1: Group team empowerment moderates the relationship between self-efficacy and individual performance AND impacts average individual performance directly Additionally, for the high team empowerment team, Team 1, selfefficacy is positively related to performance, whereas for the lowteam empowerment team, Team 5, self-efficacy is negatively related to performance Individual Self-Efficacy
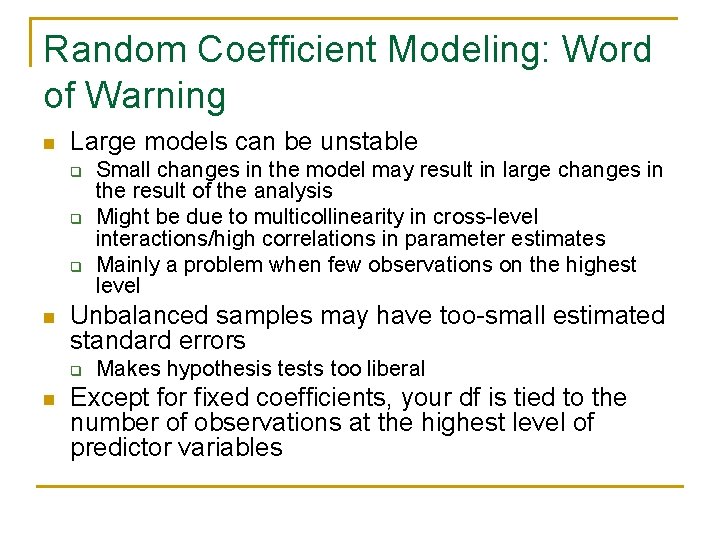
Random Coefficient Modeling: Word of Warning n Large models can be unstable q q q n Unbalanced samples may have too-small estimated standard errors q n Small changes in the model may result in large changes in the result of the analysis Might be due to multicollinearity in cross-level interactions/high correlations in parameter estimates Mainly a problem when few observations on the highest level Makes hypothesis tests too liberal Except for fixed coefficients, your df is tied to the number of observations at the highest level of predictor variables
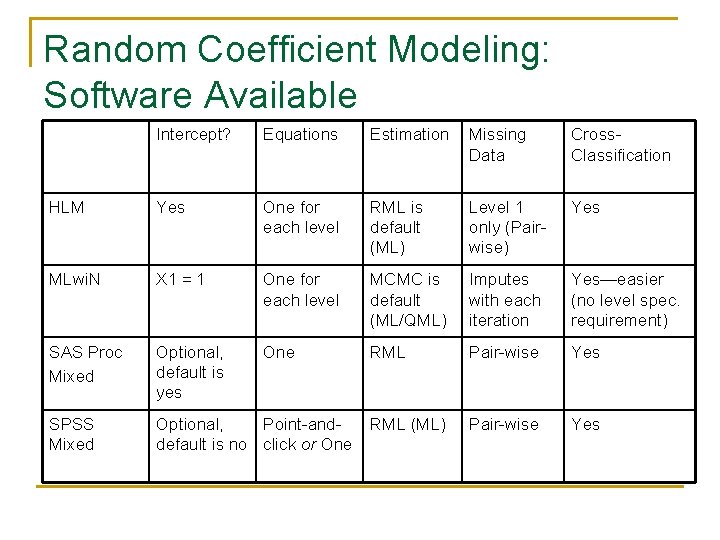
Random Coefficient Modeling: Software Available Intercept? Equations Estimation Missing Data Cross. Classification HLM Yes One for each level RML is default (ML) Level 1 only (Pairwise) Yes MLwi. N X 1 = 1 One for each level MCMC is default (ML/QML) Imputes with each iteration Yes—easier (no level spec. requirement) SAS Proc Mixed Optional, default is yes One RML Pair-wise Yes SPSS Mixed Optional, Point-anddefault is no click or One RML (ML) Pair-wise Yes
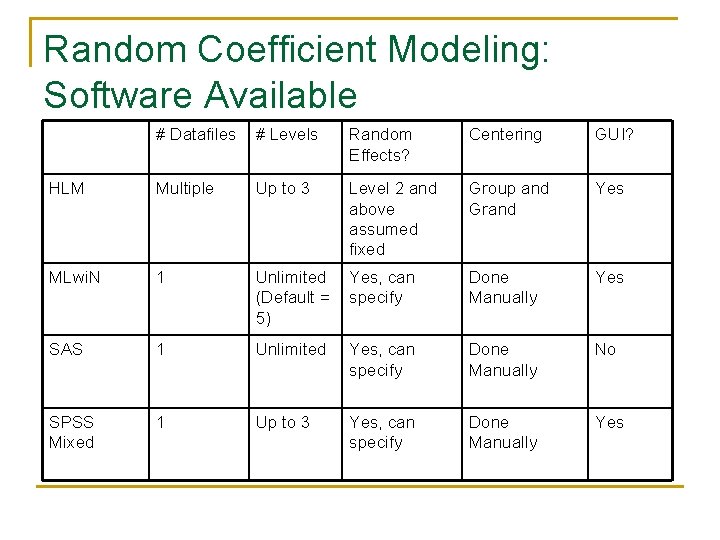
Random Coefficient Modeling: Software Available # Datafiles # Levels Random Effects? Centering GUI? HLM Multiple Up to 3 Level 2 and above assumed fixed Group and Grand Yes MLwi. N 1 Unlimited (Default = 5) Yes, can specify Done Manually Yes SAS 1 Unlimited Yes, can specify Done Manually No SPSS Mixed 1 Up to 3 Yes, can specify Done Manually Yes
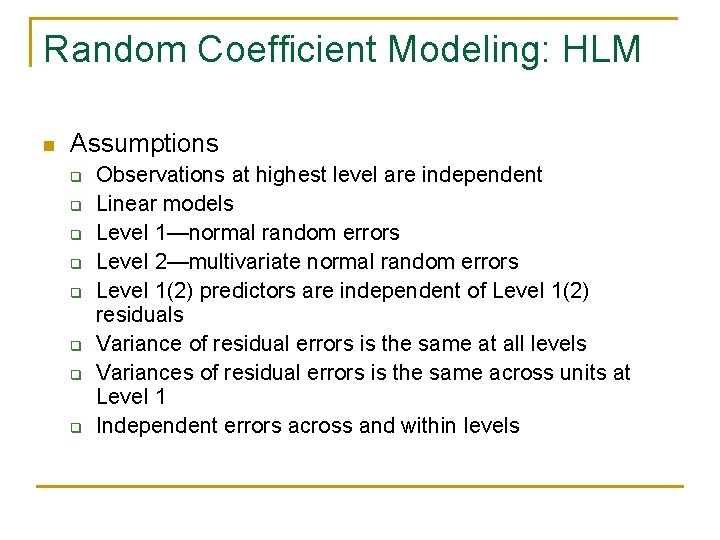
Random Coefficient Modeling: HLM n Assumptions q q q q Observations at highest level are independent Linear models Level 1—normal random errors Level 2—multivariate normal random errors Level 1(2) predictors are independent of Level 1(2) residuals Variance of residual errors is the same at all levels Variances of residual errors is the same across units at Level 1 Independent errors across and within levels
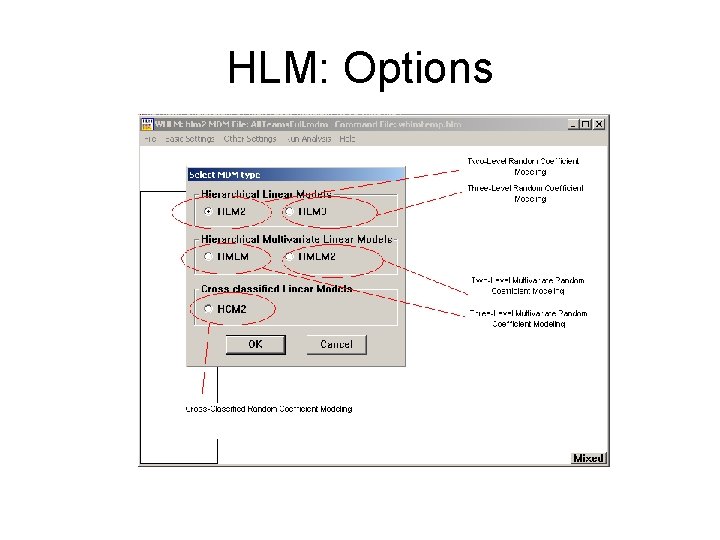
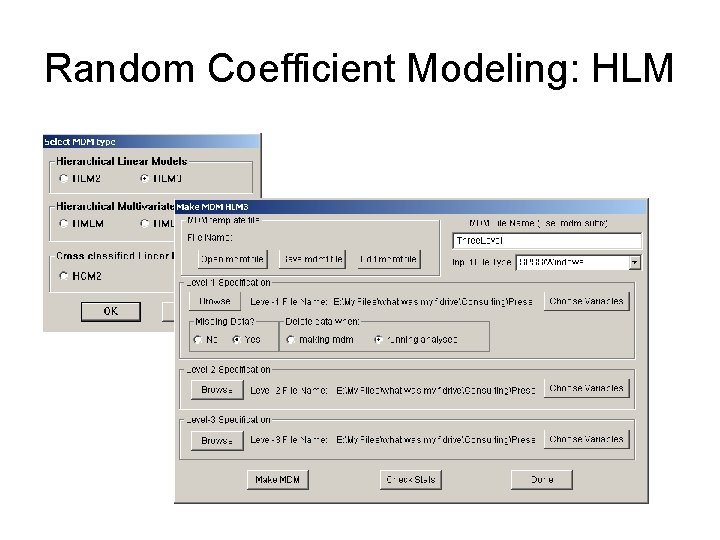
Random Coefficient Modeling: HLM n Options q q RCM Multivariate RCM 2 - or 3 - levels Cross-classified models (2 levels only)
HLM: Options
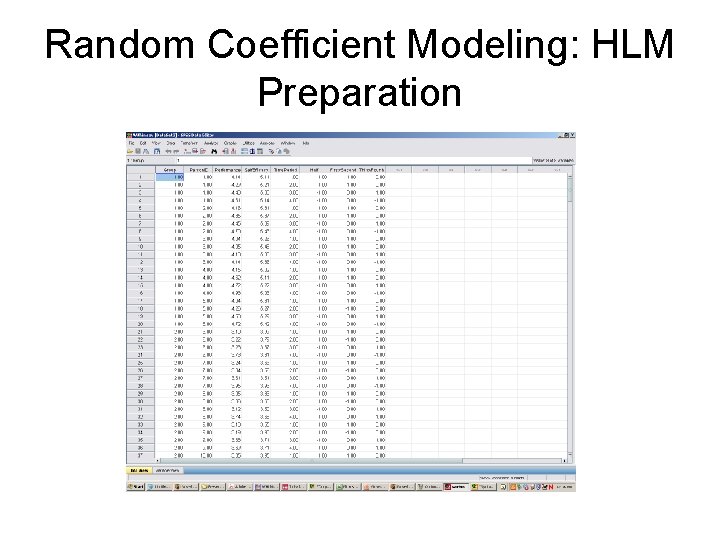
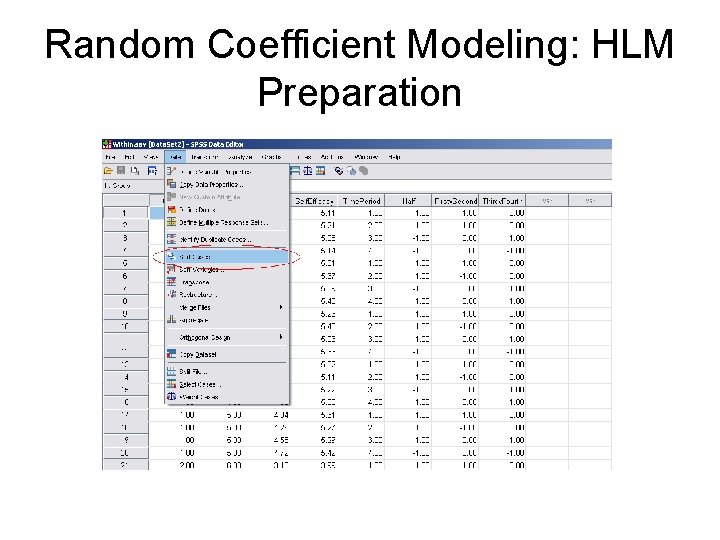
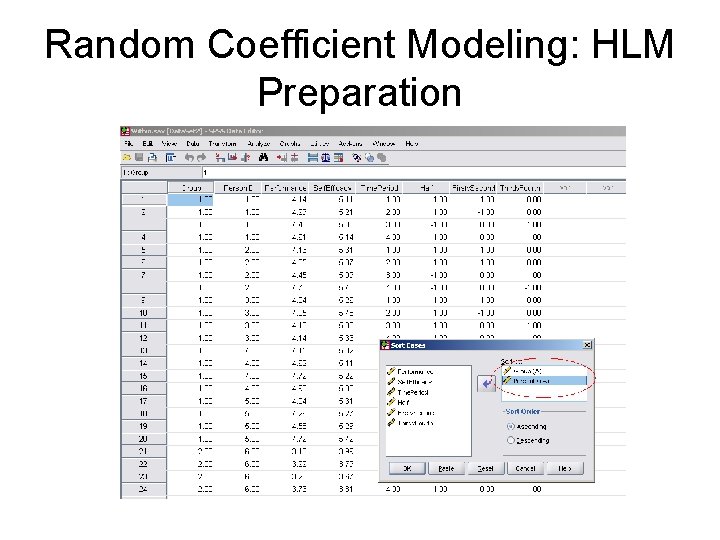
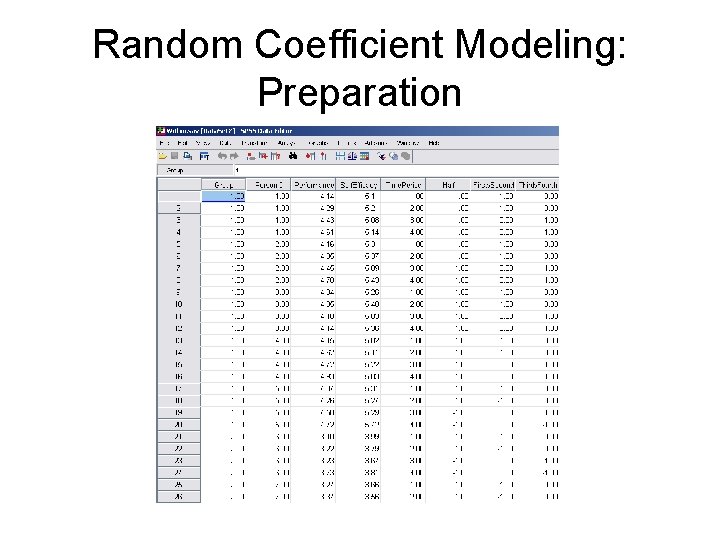
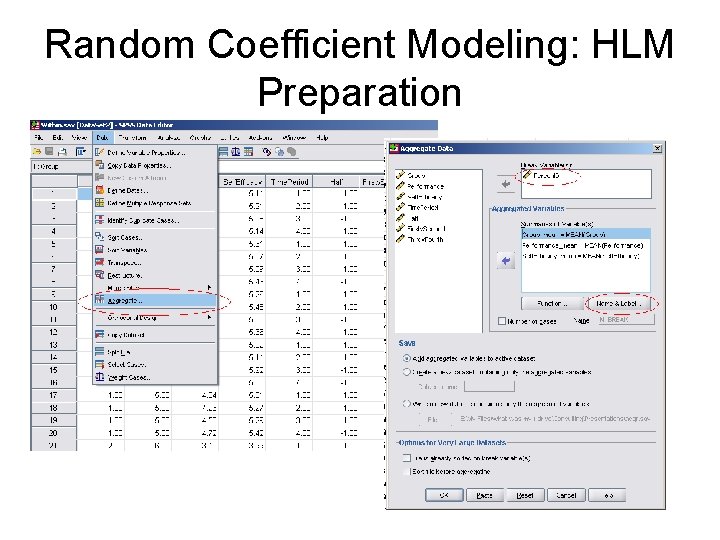
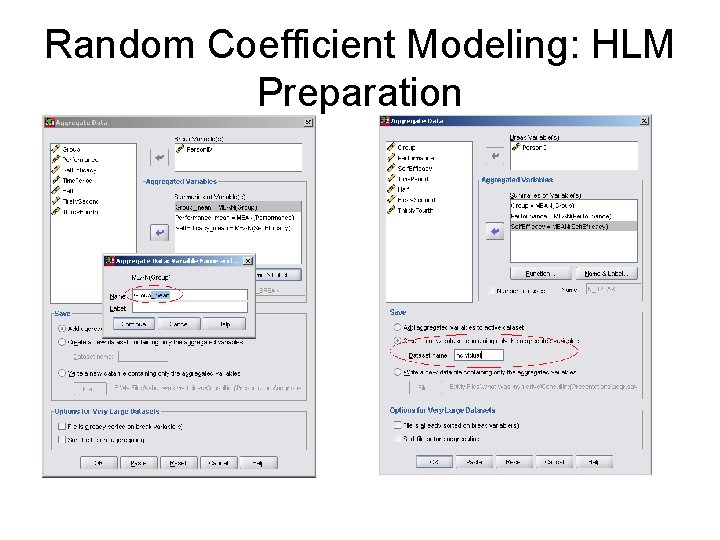
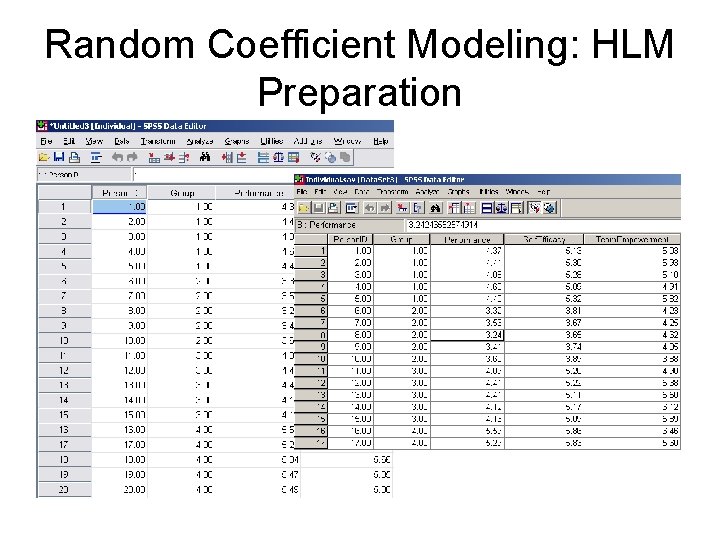
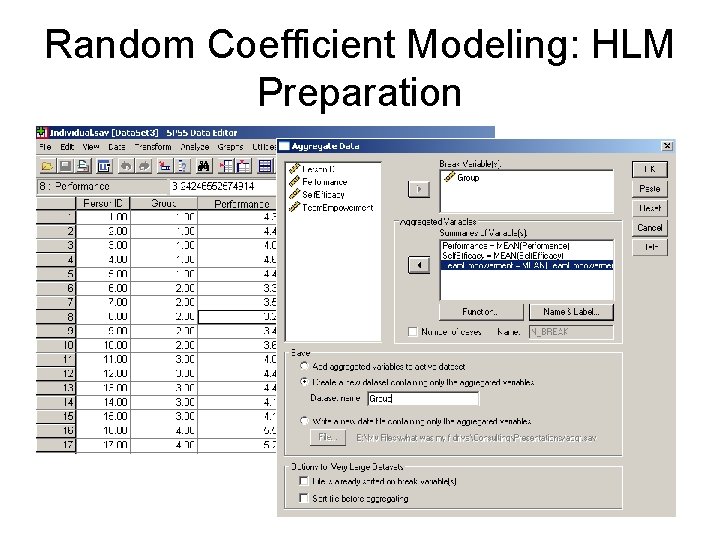
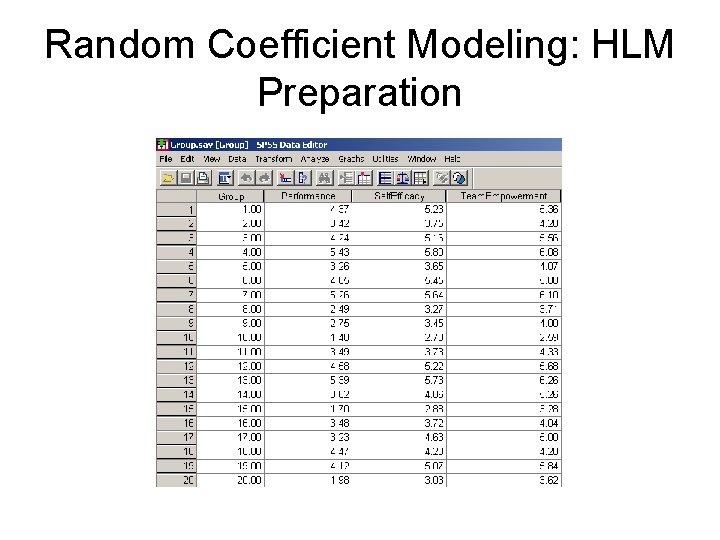
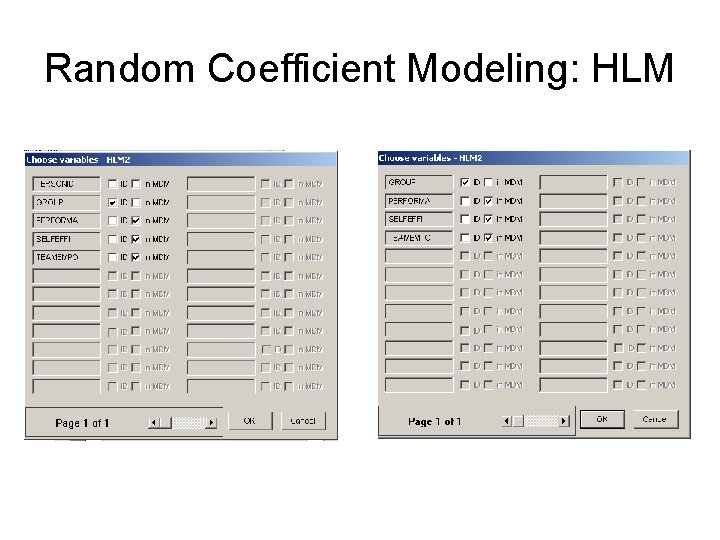
Random Coefficient Modeling: HLM n Data preparation q “Down” format n q q q Sort in ascending order Names truncate to 8 letters ID variables on all levels No missing data on higher levels
Random Coefficient Modeling: HLM Preparation
Random Coefficient Modeling: HLM Preparation
Random Coefficient Modeling: HLM Preparation
Random Coefficient Modeling: Preparation
Random Coefficient Modeling: HLM Preparation
Random Coefficient Modeling: HLM Preparation
Random Coefficient Modeling: HLM Preparation
Random Coefficient Modeling: HLM Preparation
Random Coefficient Modeling: HLM Preparation
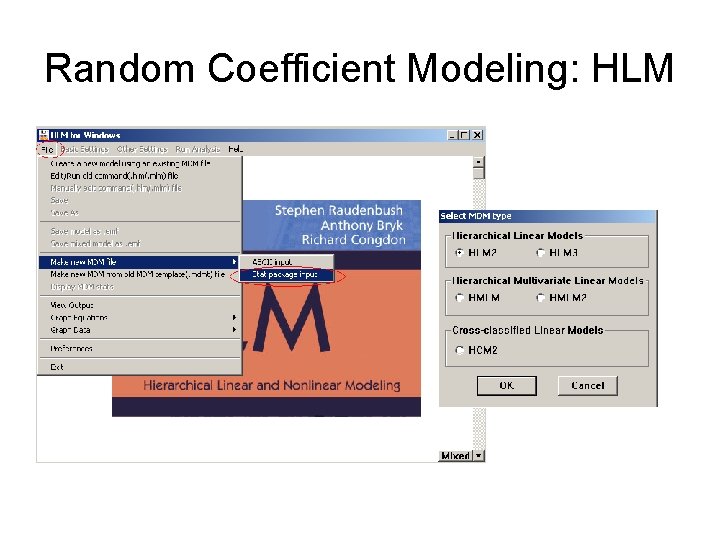
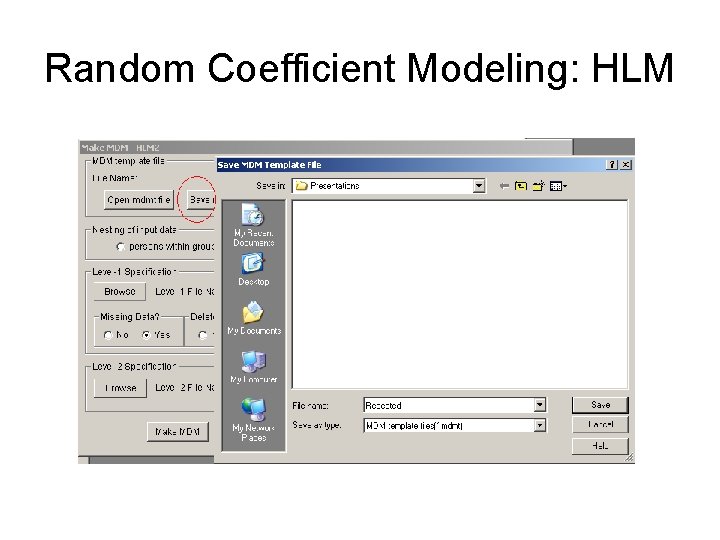
Random Coefficient Modeling: HLM n Everyone with HLM on their machine, please open it now.
Random Coefficient Modeling: HLM
Random Coefficient Modeling: HLM
Random Coefficient Modeling: HLM
Random Coefficient Modeling: HLM
Random Coefficient Modeling: HLM
Random Coefficient Modeling: HLM
Random Coefficient Modeling: HLM
Random Coefficient Modeling: HLM
Random Coefficient Modeling: HLM
Random Coefficient Modeling: HLM
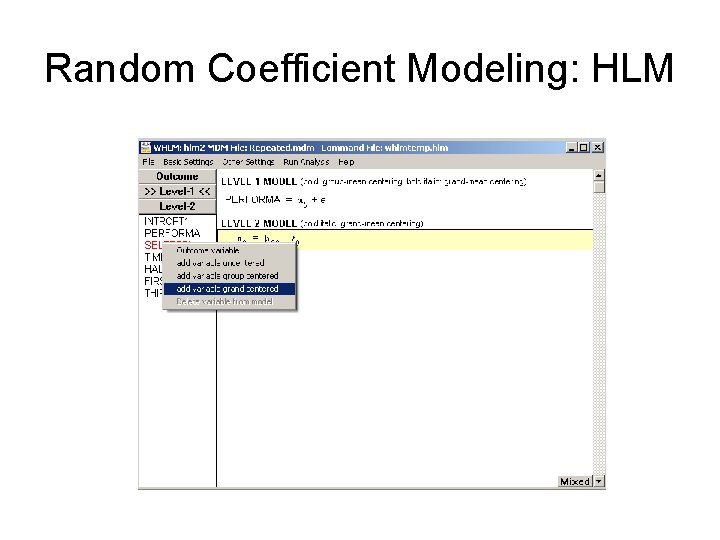
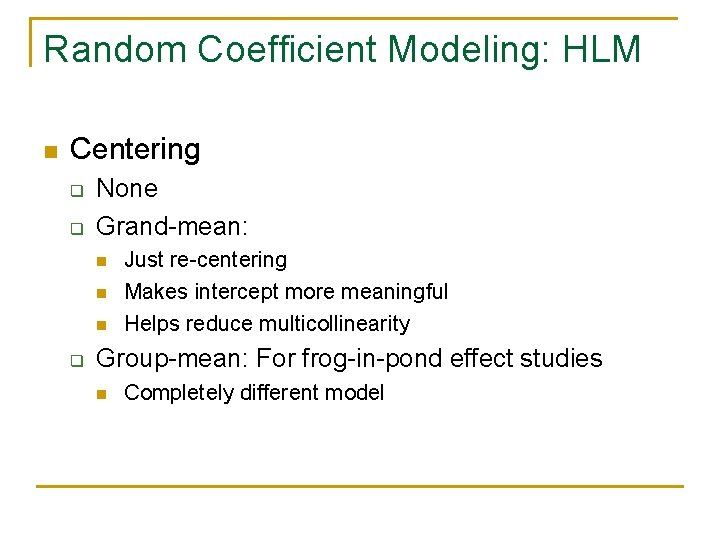
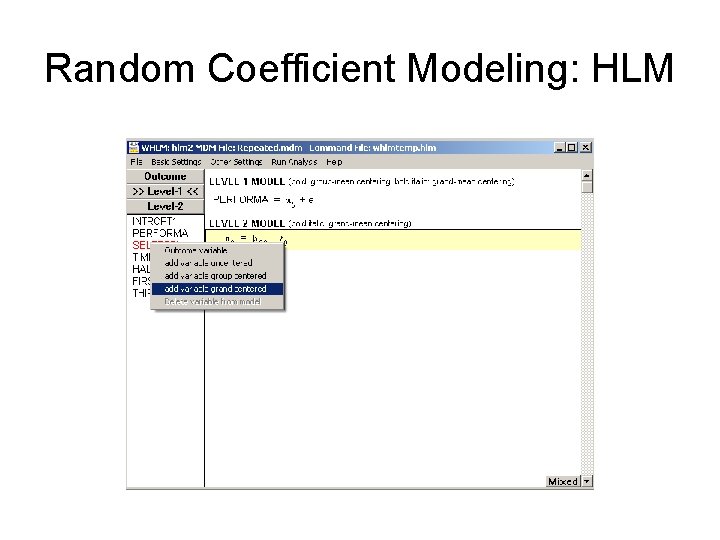
Random Coefficient Modeling: HLM n Centering q q None Grand-mean: n n n q Just re-centering Makes intercept more meaningful Helps reduce multicollinearity Group-mean: For frog-in-pond effect studies n Completely different model
Random Coefficient Modeling: HLM
Random Coefficient Modeling: HLM
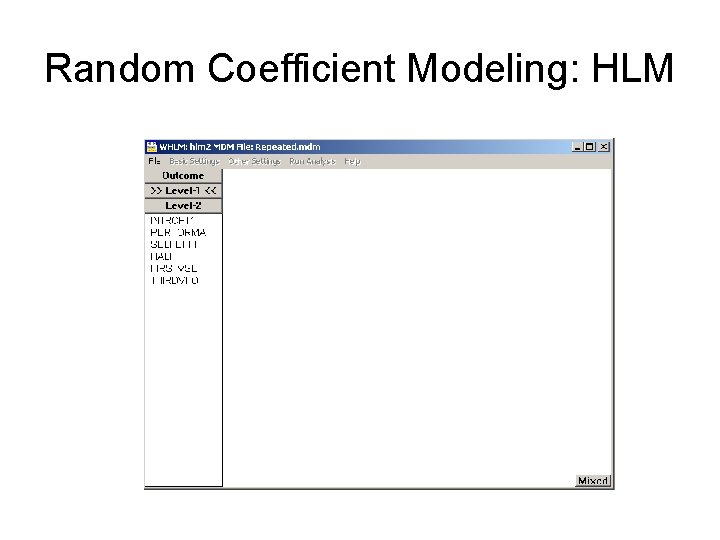
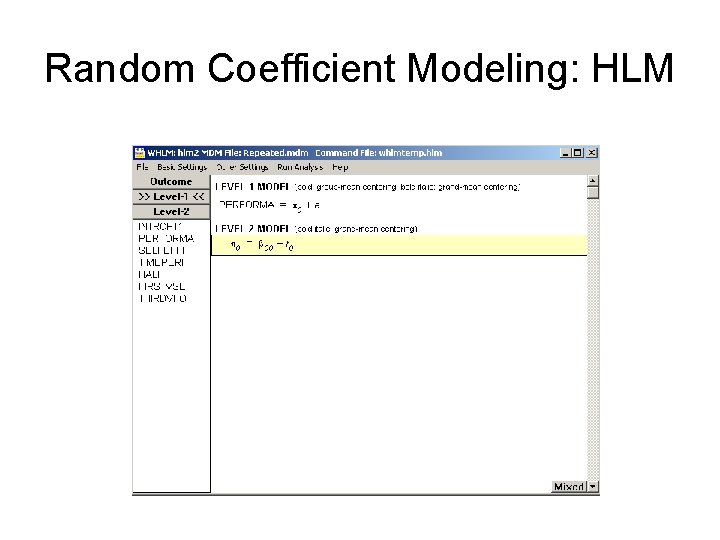
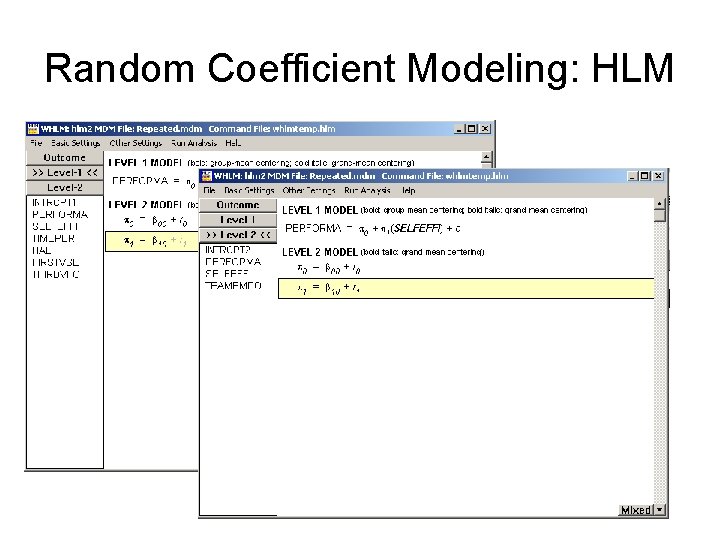
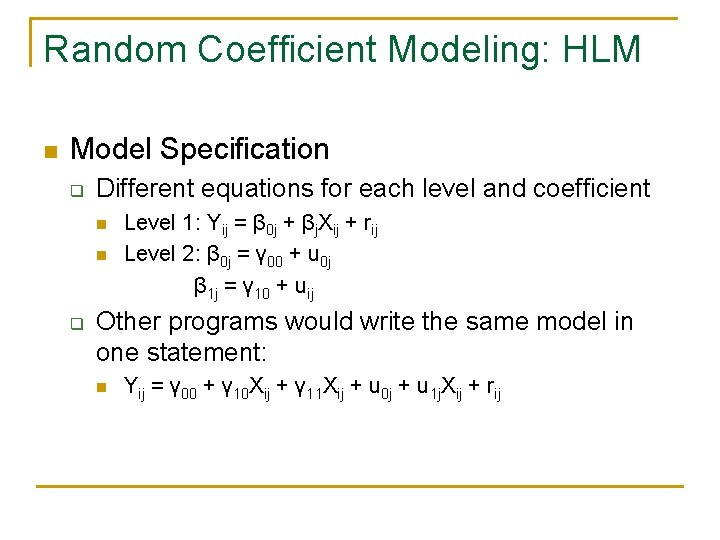
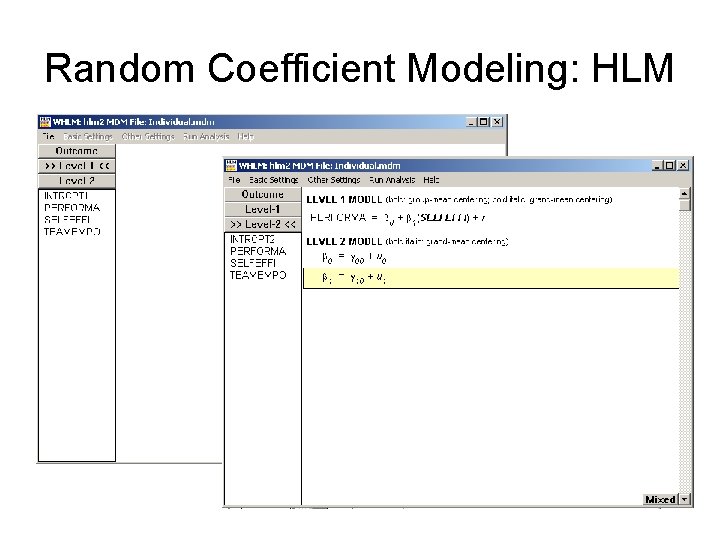
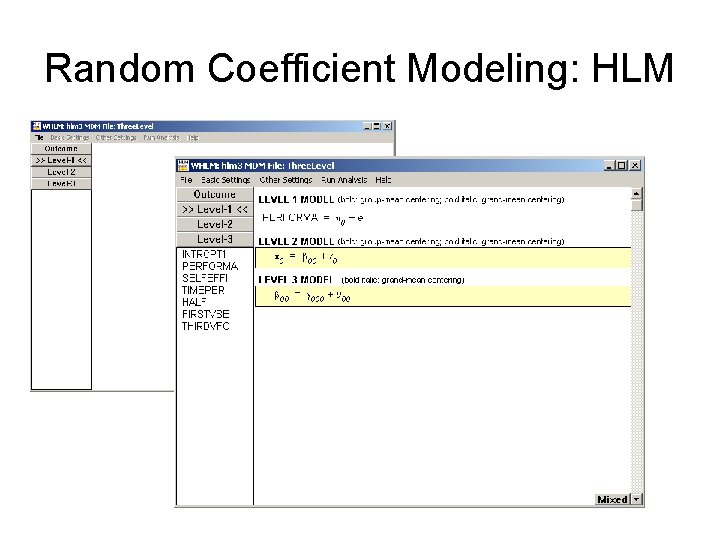
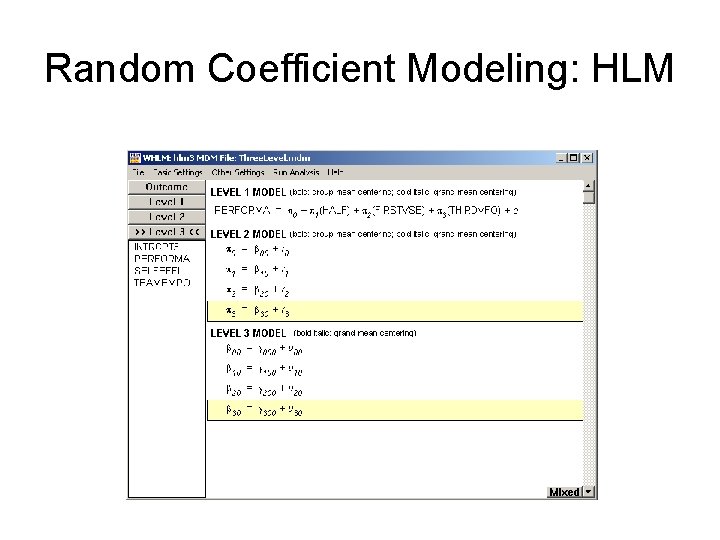
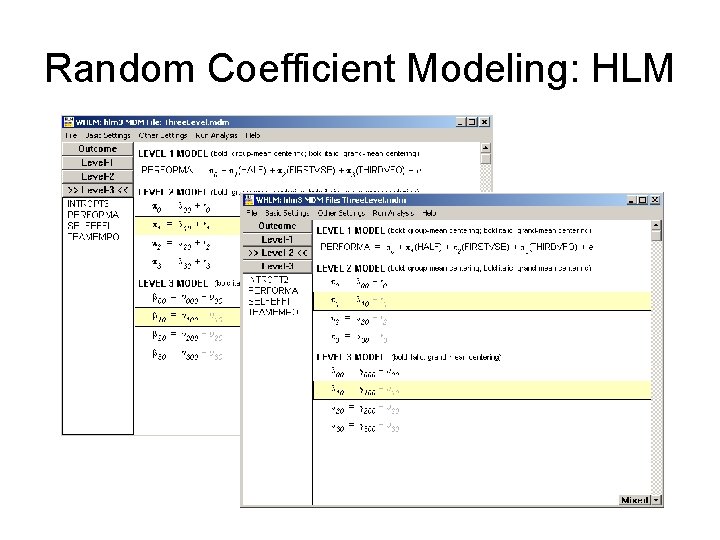
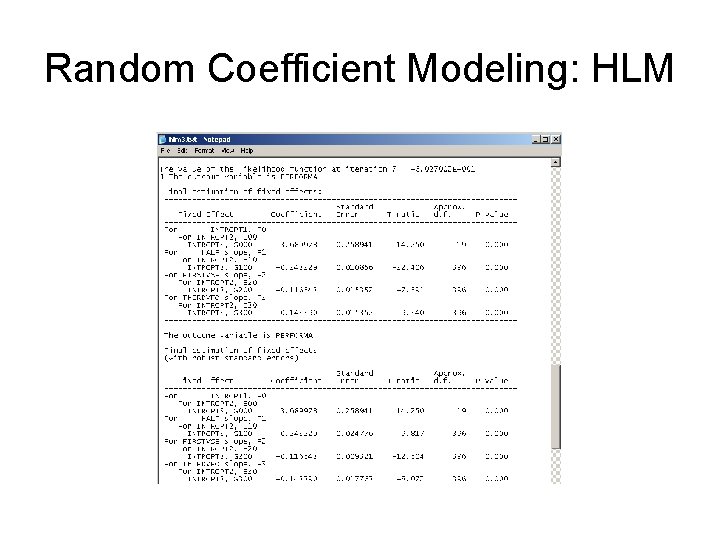
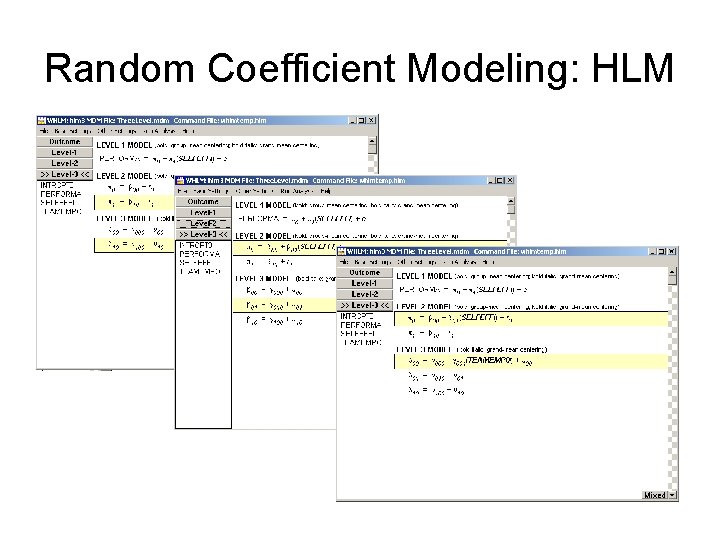
Random Coefficient Modeling: HLM n Model Specification q Different equations for each level and coefficient n n q Level 1: Yij = β 0 j + βj. Xij + rij Level 2: β 0 j = γ 00 + u 0 j β 1 j = γ 10 + uij Other programs would write the same model in one statement: n Yij = γ 00 + γ 10 Xij + γ 11 Xij + u 0 j + u 1 j. Xij + rij
Random Coefficient Modeling: HLM
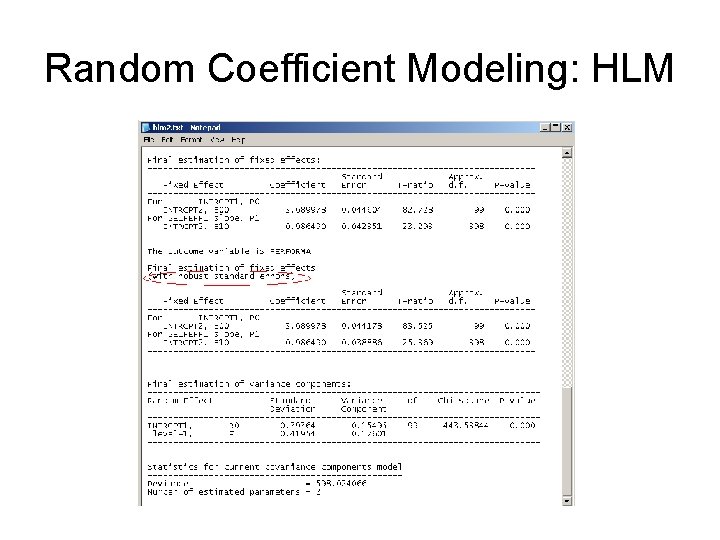
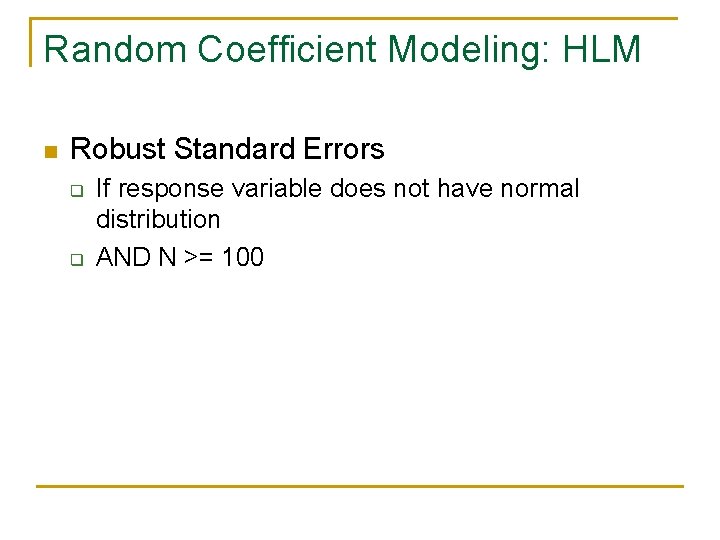
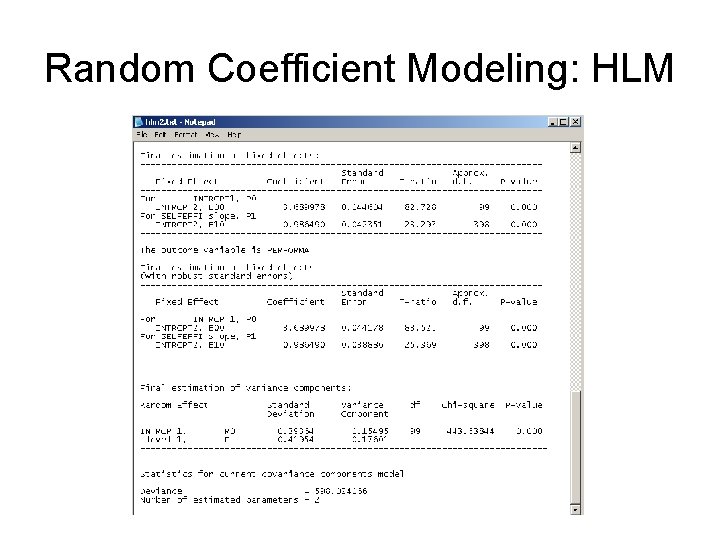
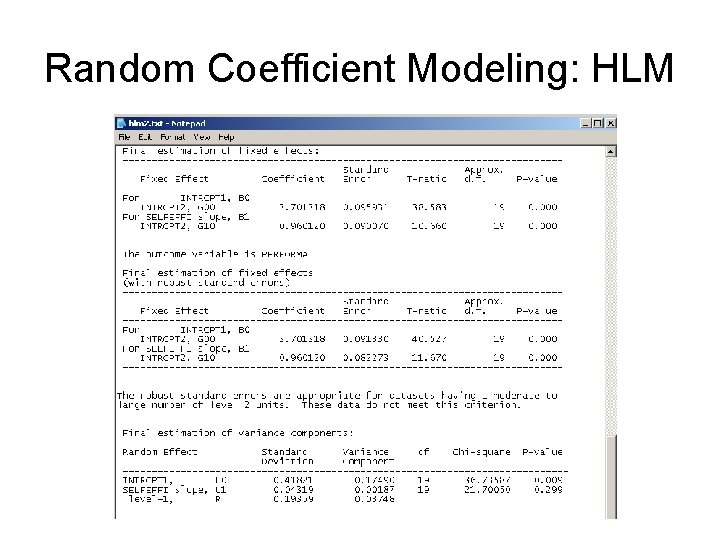
Random Coefficient Modeling: HLM n Robust Standard Errors q q If response variable does not have normal distribution AND N >= 100
Random Coefficient Modeling: HLM
Random Coefficient Modeling: HLM
Random Coefficient Modeling: HLM
Random Coefficient Modeling: HLM
Random Coefficient Modeling: HLM
Random Coefficient Modeling: HLM
Random Coefficient Modeling: HLM
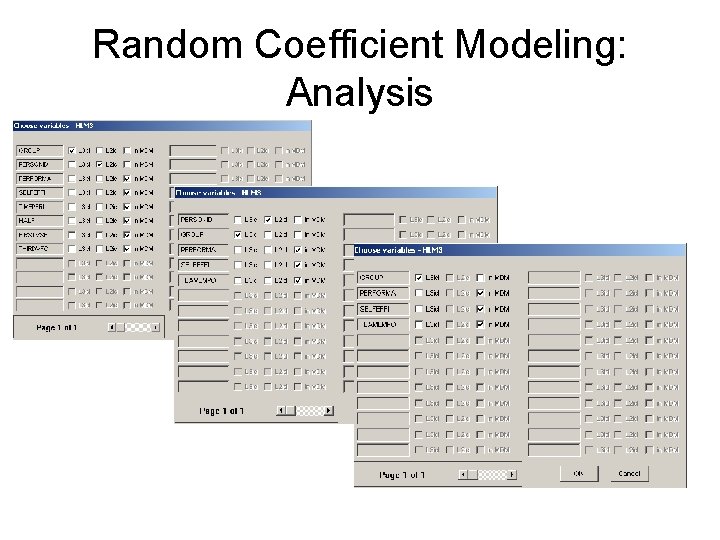
Random Coefficient Modeling: Analysis
Random Coefficient Modeling: HLM
Random Coefficient Modeling: HLM
Random Coefficient Modeling: HLM
Random Coefficient Modeling: HLM
Random Coefficient Modeling: HLM
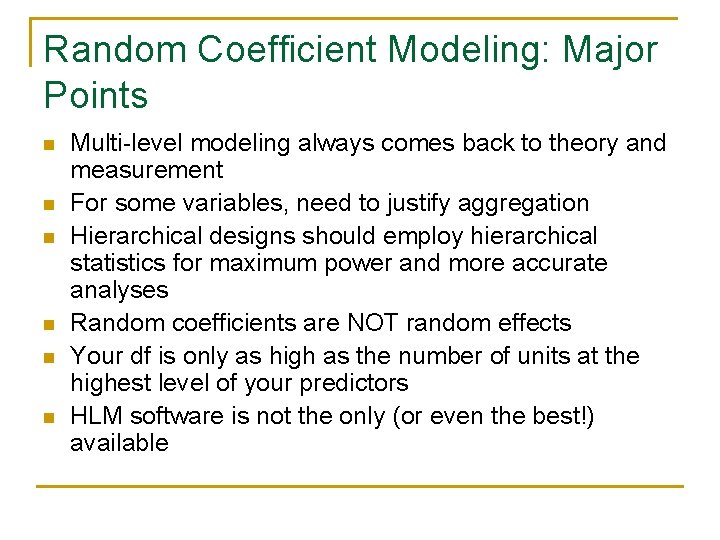
Random Coefficient Modeling: Major Points n n n Multi-level modeling always comes back to theory and measurement For some variables, need to justify aggregation Hierarchical designs should employ hierarchical statistics for maximum power and more accurate analyses Random coefficients are NOT random effects Your df is only as high as the number of units at the highest level of your predictors HLM software is not the only (or even the best!) available
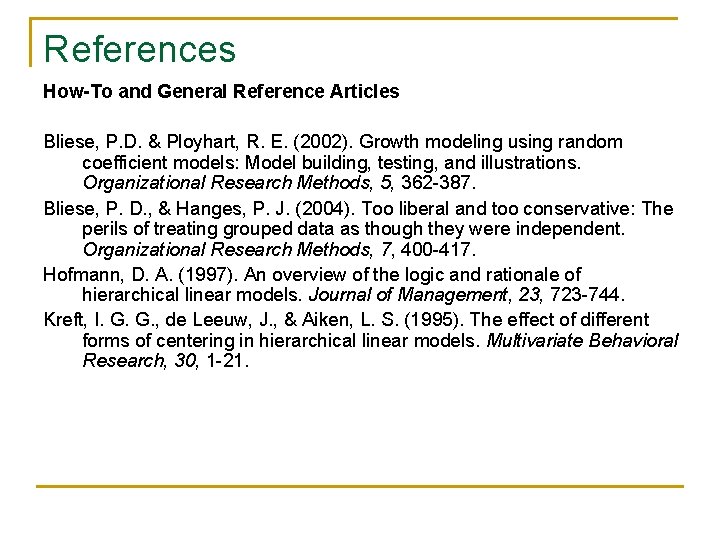
References Books Bryk, A. S. , & Raudenbush, S. W. (1992). Hierarchical linear models: Applications and data analysis methods. Newbury Park, CA: Sage. Hox, J. (2002). Multilevel analyses: Techniques and applications. Mahwah, NJ: Erlbaum. Kreft, I. & de Leeuw, J. (1998). Introducing Multilevel Modeling. London: Sage.
References How-To and General Reference Articles Bliese, P. D. & Ployhart, R. E. (2002). Growth modeling using random coefficient models: Model building, testing, and illustrations. Organizational Research Methods, 5, 362 -387. Bliese, P. D. , & Hanges, P. J. (2004). Too liberal and too conservative: The perils of treating grouped data as though they were independent. Organizational Research Methods, 7, 400 -417. Hofmann, D. A. (1997). An overview of the logic and rationale of hierarchical linear models. Journal of Management, 23, 723 -744. Kreft, I. G. G. , de Leeuw, J. , & Aiken, L. S. (1995). The effect of different forms of centering in hierarchical linear models. Multivariate Behavioral Research, 30, 1 -21.
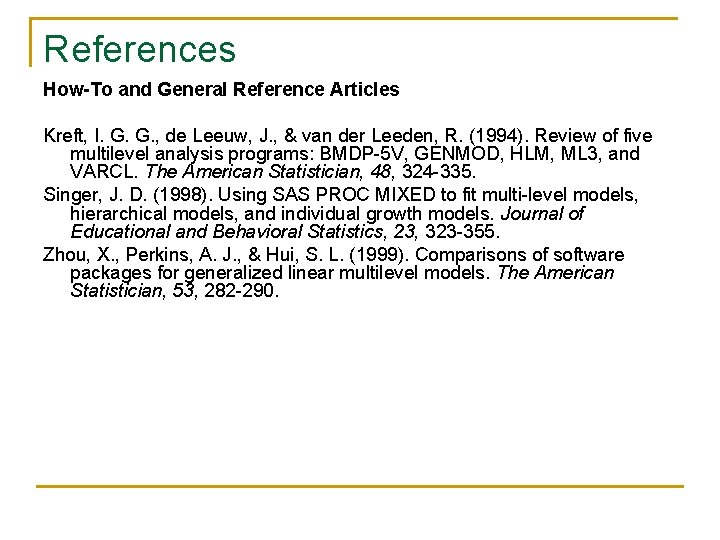
References How-To and General Reference Articles Kreft, I. G. G. , de Leeuw, J. , & van der Leeden, R. (1994). Review of five multilevel analysis programs: BMDP-5 V, GENMOD, HLM, ML 3, and VARCL. The American Statistician, 48, 324 -335. Singer, J. D. (1998). Using SAS PROC MIXED to fit multi-level models, hierarchical models, and individual growth models. Journal of Educational and Behavioral Statistics, 23, 323 -355. Zhou, X. , Perkins, A. J. , & Hui, S. L. (1999). Comparisons of software packages for generalized linear multilevel models. The American Statistician, 53, 282 -290.
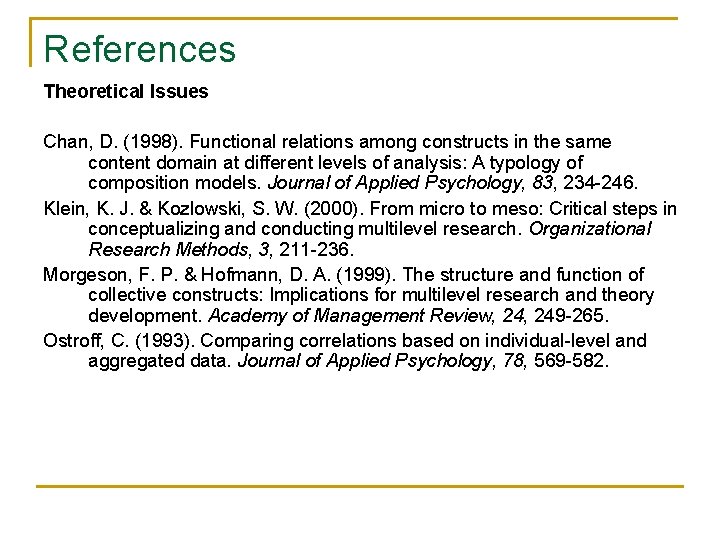
References Theoretical Issues Chan, D. (1998). Functional relations among constructs in the same content domain at different levels of analysis: A typology of composition models. Journal of Applied Psychology, 83, 234 -246. Klein, K. J. & Kozlowski, S. W. (2000). From micro to meso: Critical steps in conceptualizing and conducting multilevel research. Organizational Research Methods, 3, 211 -236. Morgeson, F. P. & Hofmann, D. A. (1999). The structure and function of collective constructs: Implications for multilevel research and theory development. Academy of Management Review, 249 -265. Ostroff, C. (1993). Comparing correlations based on individual-level and aggregated data. Journal of Applied Psychology, 78, 569 -582.
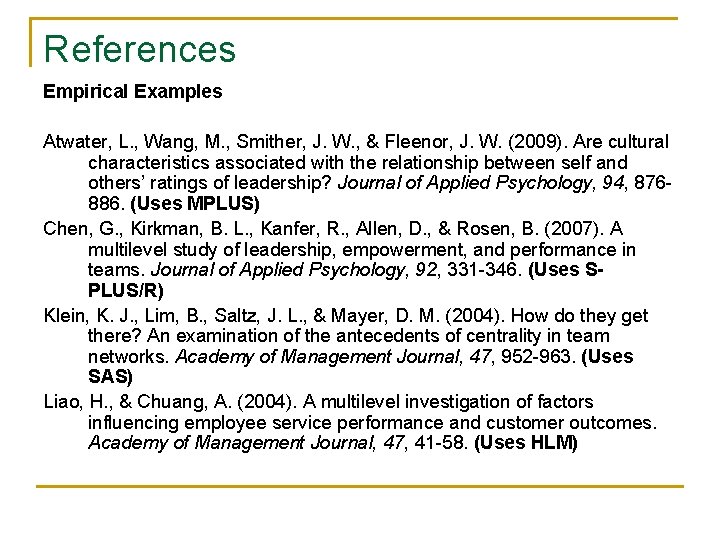
References Empirical Examples Atwater, L. , Wang, M. , Smither, J. W. , & Fleenor, J. W. (2009). Are cultural characteristics associated with the relationship between self and others’ ratings of leadership? Journal of Applied Psychology, 94, 876886. (Uses MPLUS) Chen, G. , Kirkman, B. L. , Kanfer, R. , Allen, D. , & Rosen, B. (2007). A multilevel study of leadership, empowerment, and performance in teams. Journal of Applied Psychology, 92, 331 -346. (Uses SPLUS/R) Klein, K. J. , Lim, B. , Saltz, J. L. , & Mayer, D. M. (2004). How do they get there? An examination of the antecedents of centrality in team networks. Academy of Management Journal, 47, 952 -963. (Uses SAS) Liao, H. , & Chuang, A. (2004). A multilevel investigation of factors influencing employee service performance and customer outcomes. Academy of Management Journal, 47, 41 -58. (Uses HLM)
Thank You! n n n Paul Hanges, Mo Wang, Kevin O’Grady, and Da. SAL consultants (Marsha Sargeant, Laura Sherman, Brandi Stupica, and Tracy Tomlinson) for comments and suggestions Songqi Liu for theoretical & empirical references Everyone for coming out today!