Intrinsic Relative Activity RAi of an Agonist Understanding
 of an Agonist: Understanding Agonist. Receptor Behavior Simply from Agonist")


– ability of the agonist to bind the agonist Efficacy (e) –")

")
![Determination of Affinity Control curve Log [x] Curve after alkylation Log [x’] (Ehlert, 1987)](https://slidetodoc.com/presentation_image/61dad40d198815845cde2f0f615cb905/image-8.jpg "Determination of Affinity Control curve Log [x] Curve after alkylation Log [x’] (Ehlert, 1987)")


")

")
")
")


")
")
")
")
")

")
 b 1 Contraction X (-) b 3")


 AF-DX 116 – 6. 42 ±")

 M 3, RC")


- Slides: 49
Intrinsic Relative Activity (RAi) of an Agonist: Understanding Agonist. Receptor Behavior Simply from Agonist Concentration-Response Curves John A Tran Ph. D. Dissertation Defense October 24 th, 2008
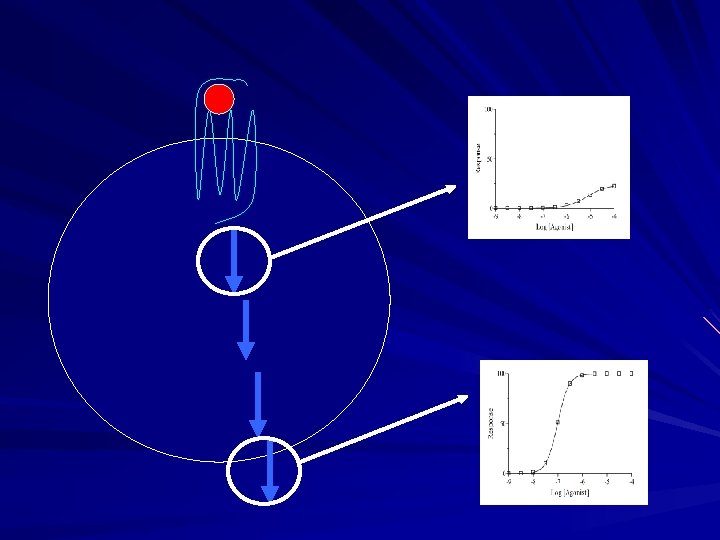
Receptor Theory Stimulus – Agonist binding and receptor activation Transducer – downstream signaling mechanisms Response – result of receptor activation that is measured
Characterization of Agonist Activity EC 50 – concentration of agonist that elicits half-maximal response Emax – maximal response
Stimulus Affinity (1/KX)– ability of the agonist to bind the agonist Efficacy (e) – ability of the agonist to turn on the receptor Transducer function unknown Transducer Response
Furchgott Analysis Partial inactivation of receptors by irreverisble antagonist – Comparison of equiactive concentrations of the agonist before and after receptor alkylation. q = fraction of receptors remaing after receptor inactivation with irreversible antagonist x’ = concentration of agonist after receptor inactivation that results in the same response as x (Furchgott, 1966; Furchgott and Bursztyn, 1967)
Nonlinear regression (Ehlert, 1987)
Determination of Affinity Control curve Log [x] Curve after alkylation Log [x’] (Ehlert, 1987)
Determine relative efficacy of test agonist relative to standard agonist – e/es Control curve Curve after alkylation 2% 4% 80 % (Ehlert, 1987)
Furchgott Analysis Allows the estimation of affinity and efficacy using experimental manipulation of the response
What can you get from a concentration-response curve?
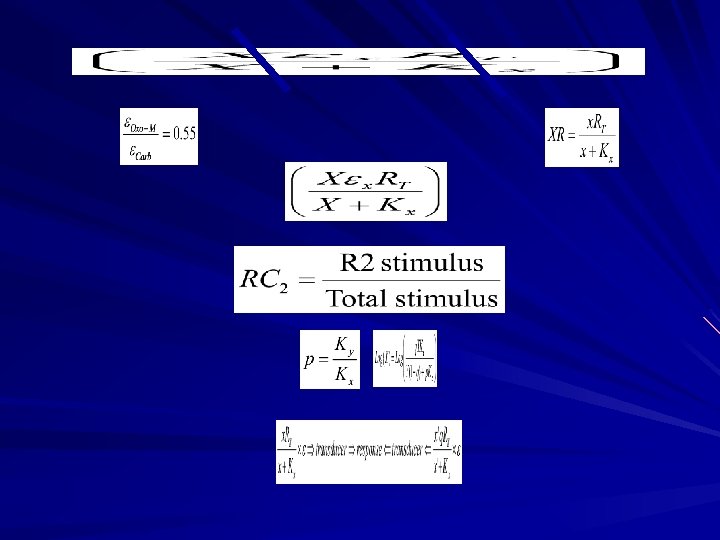
RAi Analysis RAi is the product of observed affinity and intrinisic efficacy of the agonist of interest (Y) relative to a standard agonist (X) RAi is a measure of affinity for the active state of the receptor
X Y
What is the product of affinity and efficacy? Relative measure of microscopic affinity constant for the active state of the receptor
e. X e. Y XR* YR* KX KY The RAi is a relative measure of the affinity for the active state of the receptor
Hypothesis In a biological system, the RAi is equivalent to the product of observed affinity and intrinsic efficacy for the agonist of interest (Y) relative to a standard agonist (X)
Aims 1. Compare RAi with product of affinity and efficacy 2. Compare RAi value between systems 3. Determine relative contribution of receptor subtypes for eliciting a response using modified RAi analysis
Aim 1 RAi = product of observed affinity and intrinisic efficacy of test agonist relative standard agonist Comparison of observed affinity and intrinisic efficacy values procured individually through Furchgott analysis with RAi – Furchgott analysis – irreversible antagonism – RAi analysis – of simple agonist concentrationresponse curves
CHO-M 2 cells (Tran et al, submitted)
KOxo-M = 0. 29 m. M KCarb = 4. 3 m. M
RAi = product of affinity and efficacy (Tran et al, submitted)
Mouse ileum, “M 2 KO” (Tran et al, submitted)
Mouse ileum, “M 2 KO” (Tran et al, submitted)
Aim 1 Summary RAi values agree with the product of observed affinity and intrinsic efficacy for the test agonist relative to the standard
Aim 2 Compare RAi values between systems – CHO cells vs tissue The RAi is inherent property of the active state of the receptor that causes it associate with its coupling protein (e. g. , G protein). Therefore RAi values should be consistent between different systems that signal through the same G protein.
are equivalent i values RAi RA values not necessarily equivalent G 1 G 2 G 1
M 2 receptor CHO-M 2 cells Guinea Pig Left Atrium (Tran and Ehlert, in preparation)
M 2 RAi comparison (Tran and Ehlert, in preparation)
M 3 receptor Mouse ileum, “M 2 KO” CHO-M 3 (Tran et al, submitted) (Ehlert et al. , 1999)
M 3 receptor (Tran et al, submitted)
Characterization of Mc. N-A-343 Mouse ileum, “M 2 KO” (Tran et al, submitted)
M 2/M 3 KO M 2 KO (Tran et al, submitted)
Higher activity of Mc. N-A-343 in M 2 KO ileum is a mixed response that may include M 1 receptor activation (Tran et al, submitted)
CHO-b 1 cells b 1 receptor Rat Left Atrium (Tran and Ehlert, in preparation)
(+) b 1 Contraction X (-) b 3
Unknown dobutamine effect
Aim 2 Summary The RAi is consistent between systems and responses measured signaling from the same G protein pathway The unique effects of Mc. N-A-343 and dobutamine are likely due to effects in addition to binding the receptor-G protein pathway under study
Aim 3 Determination of the contribution of various receptor subtypes to the response measured in knockout studies using a modified RAi – Relative Contribution (RC) analysis The contribution of M 1, M 2 and M 3 receptors to oxotremorine-M-induced phosphoinositide hydrolysis in the mouse urinary bladder and ileum – M 2 KO – M 3 KO – M 2/M 3 KO
R 2 R 1 M 1, M 3 – mediate phosphoinositide hydrolysis through Gq M 2 – may mediate phosphoinositide hydrolysis through Gi Oxotremorine-M has similar affinities for all the receptors Assumptions: 1. Receptors can each mediate the response measured individually 2. Agonist has same affinity for all the receptors involved
RC analysis R 2 RC 1 = 1 – RC 2 R 1
Mouse Urinary Bladder M 3 receptor is solely responsible for response (Tran et al. , 2006)
Mouse Ileum Complex Result with possible involvement of M 2 in addition to M 3 as well as another receptor (Tran et al. , 2006)
M 2/M 3 KO Antagonist affinities (p. KB) AF-DX 116 – 6. 42 ± 0. 42 Pirenzepine – 8. 04 ± 0. 47 Binding affinities (p. Kd) M 1 receptor mediated response M 1 M 2 M 3 M 4 M 5 AF-DX 116 6. 2 7. 3 6. 1 6. 0 5. 3 Pirenzepine 7. 8 6. 0 6. 6 7. 2 6. 6 Esqueda et al, 1996 (Tran et al. , 2006)
M 2/M 3 KO M 1 receptor exists in the smooth muscle (Tran et al. , 2006)
M 1, RC 1 = 15 % (M 2/M 3 KO) M 3, RC 3 = 80% (M 3 KO) M 2, RC 2 = 1 -(RC 3 + RC 23) = 5% (Tran et al. , 2006)
Aim 3 Conclusions The RC analysis was used to estimate the contributions of the M 1, M 2 and M 3 receptors to the oxotremorine-M-induced phosphoinositide hydrolysis Evidence is shown for a M 1 and M 2 phosphoinositide response in ileum
Summary The RAi is a relative measure of microscopic affinity constants of the active state of the receptor The RAi is the product of affinity and efficacy of the test agonist relative to a standard agonist The RC analysis can be used in knockout studies to determine the contribution of various receptor subtypes to the response measured
Acknowledgements Frederick Ehlert, Ph. D. Kelvin Gee, Ph. D. Frances Leslie, Ph. D. Ralph Purdy, Ph. D. Qun-Yong Zhou, Ph. D. Alan Goldin, M. D. , Ph. D. Ehlert Lab – – – Michael Griffin, Ph. D. Hinako Suga, Ph. D. Katherine Figueroa, Ph. D. Kirk Pak Alexander Chang Department of Pharmacology Family