HRP 223 2008 Topic 10 Categorical Outcomes Copyright

 ^. 5 Effect Size +/- 1 for")
2")


 / 71 =")


 but they")


 SAS.")


- Slides: 46
HRP 223 - 2008 Topic 10 - Categorical Outcomes Copyright © 1999 -2008 Leland Stanford Junior University. All rights reserved. Warning: This presentation is protected by copyright law and international treaties. Unauthorized reproduction of this presentation, or any portion of it, may result in severe civil and criminal penalties and will be prosecuted to maximum extent possible under the law.
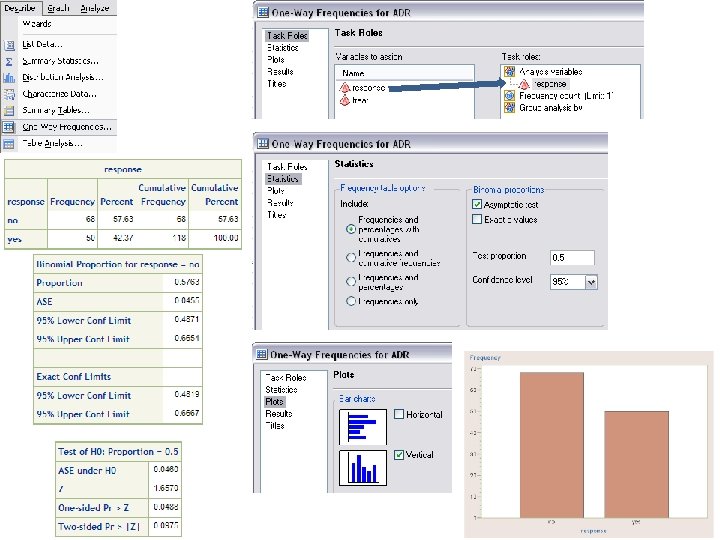
Pearson Modeling Less Adverse Events (χ2 /N) ^. 5 Effect Size +/- 1 for 2 x 2 tables with. 1. 3. 5 Odds ratio = 22/44 ÷ 28/24 Relative Risk 1 = 22/66 ÷ 28/52
Chi-Square Working § § HRP 223 2008 χ2 = (Observed # - Expected #)2 / Expected # χ2 determines if an association exits χ2 does not measure the strength of the association χ2 depends on and reflects sample size
§ Right click on the flowchart or File > New…
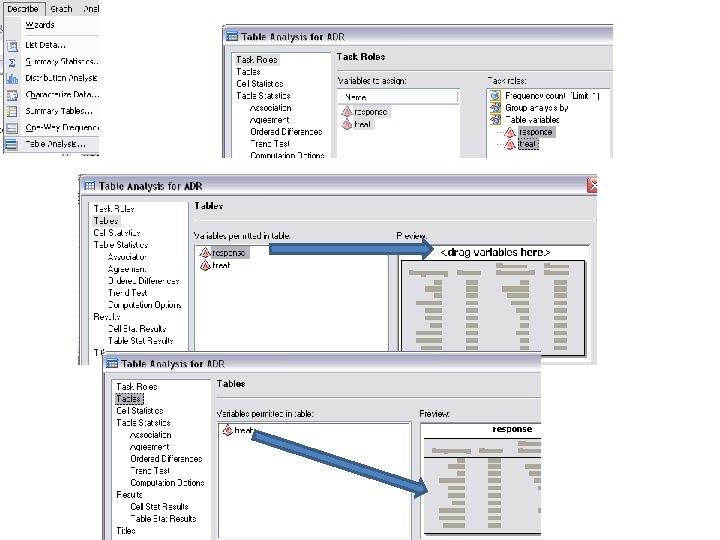
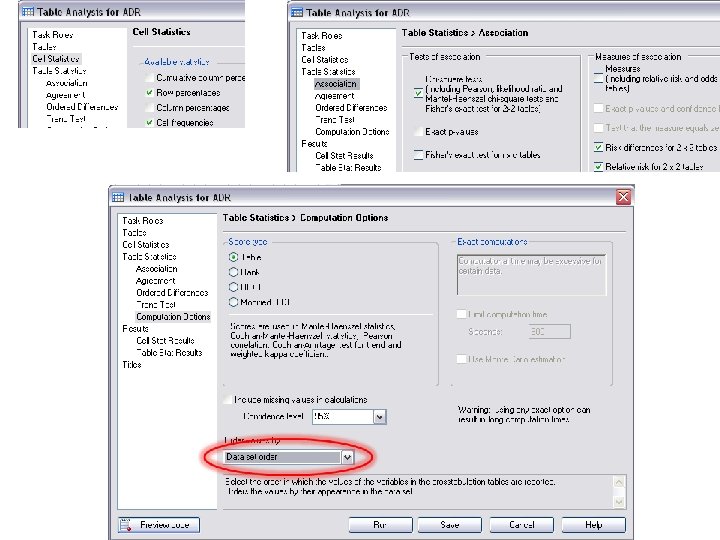
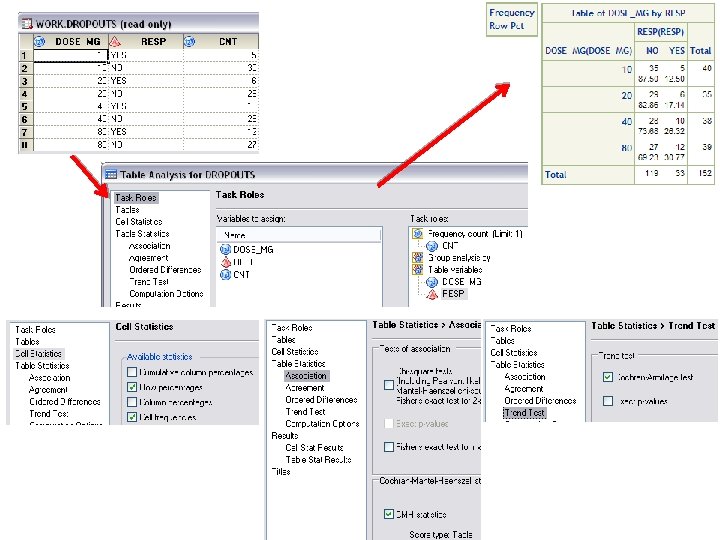
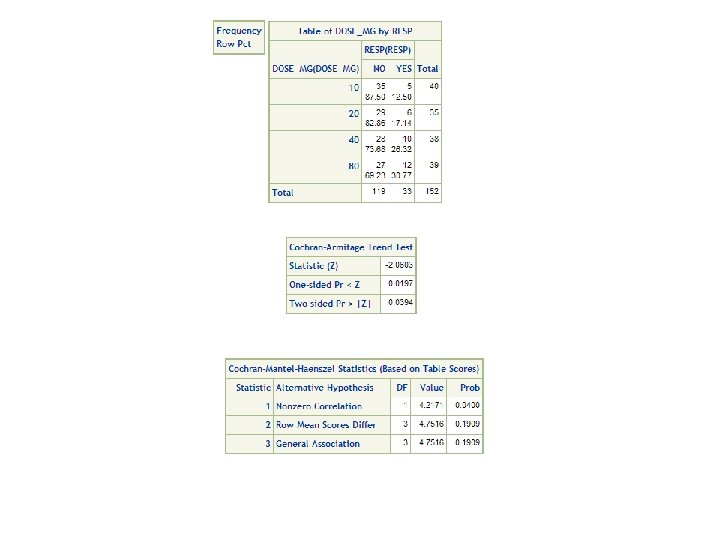
Tables Bigger than 2 x 2 HRP 223 2008
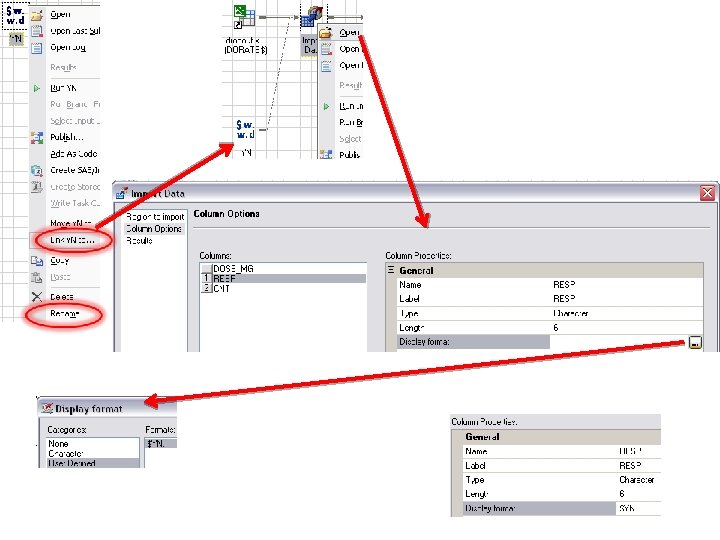
Type “ Yes” with a leading blank 1 2 4 3
5 6 7 8
HRP 223 2008
(16 * 1 + 26 * 2 + 29 * 3) / 71 = mean for ACT (24 * 1 + 26 * 2 + 18 * 3) / 71 = mean for Placebo
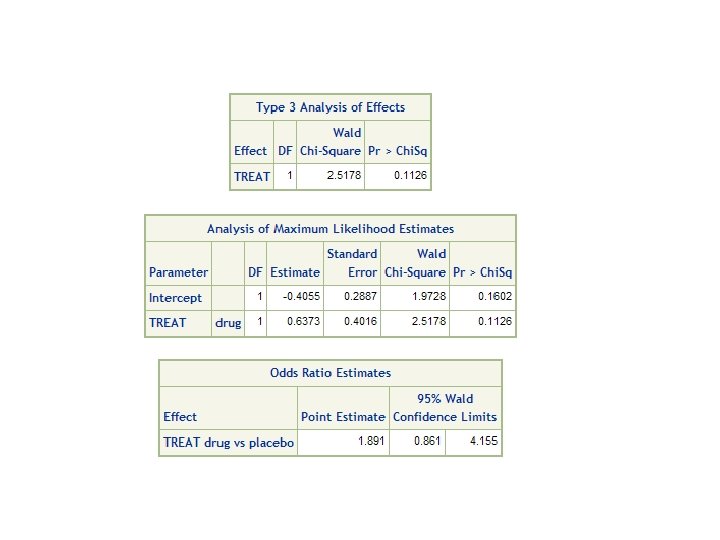
OR: 29/23 ÷ 40/60 = 1. 891
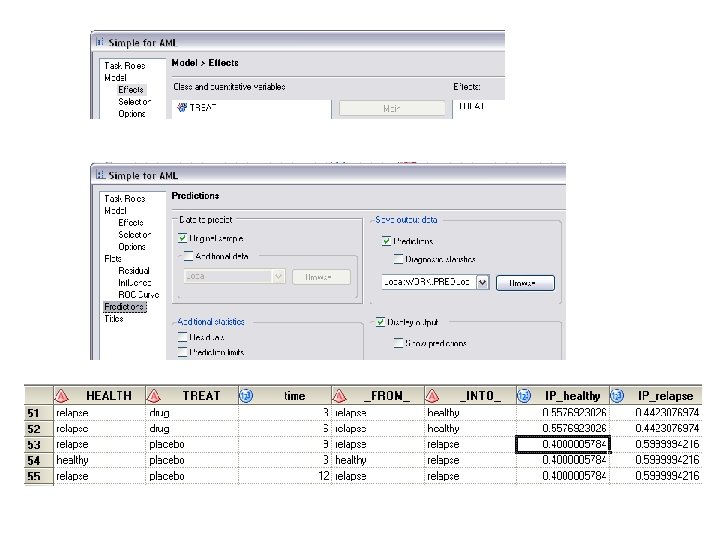
If you model the wrong outcome, tweak this. You can control parameterization here.
Watch for missing data. Use the response variable sort order if you are predicting the wrong outcome. Impact of drug relative to an on placebo baseline The model found an answer. If you have prefect prediction (0 frequencies in the contingency tables), expect problems.
Akaike’s Information Criterion, Schwartz Criterion, -2 log likelihood are here. All are used to compare nested models. AIC and SC penalize you for the number of parameters. Overall, is the model any good?
Concordant = Given a pair of observations with different values in the response variable, the model correctly assigns the higher probability of the outcome to the person with the outcome. Domer’s D (nc-nd) / t Gamma (nc –nd) / (nc + nd) Tau-a (nc – nd) / (. 5 * N-1) c = (nc +. 5 * (t-nc –nd)) / t nc = # concordant pairs Nd = # discordant pairs t = pairs with different response values c = area under the ROC curve Somer’s D = 2(c-. 5)
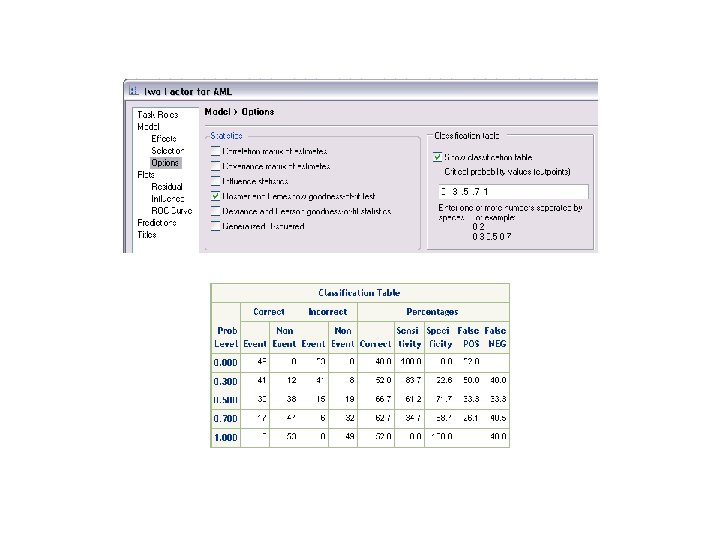
Sensitivity: Correctly identify the presence of a condition in those with the disease. Specificity: Correctly identify the lack of a condition in those without the disease.
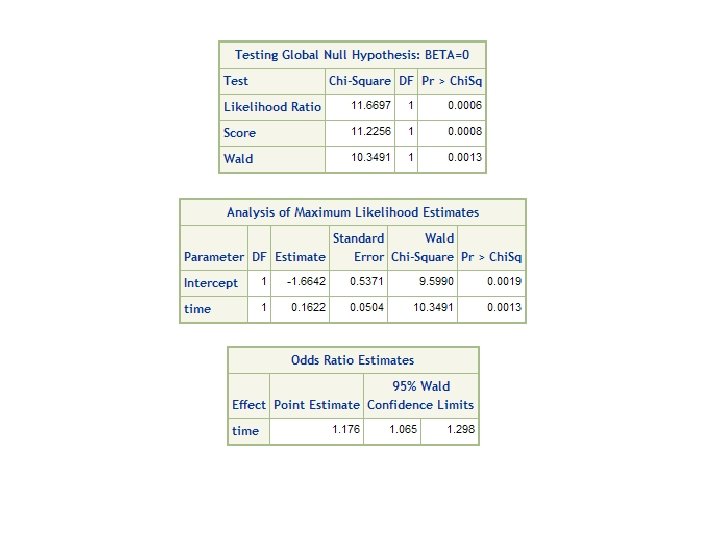
Odds of a Month in Remission HRP 223 2008
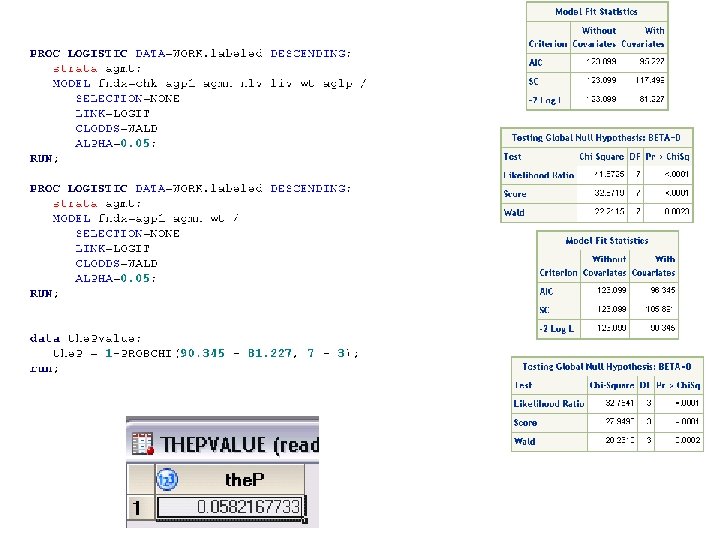
HRP 223 2008 Profile likelihood are more accurate (especially for small samples) but they need extra horsepower to calculate.
Confidence Intervals HRP 223 2008
Don’t interpret these as the % of variance accounted for in your model.
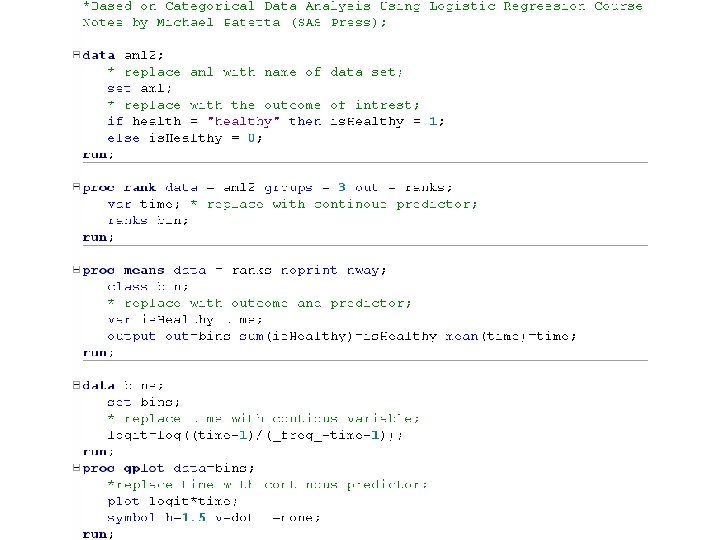
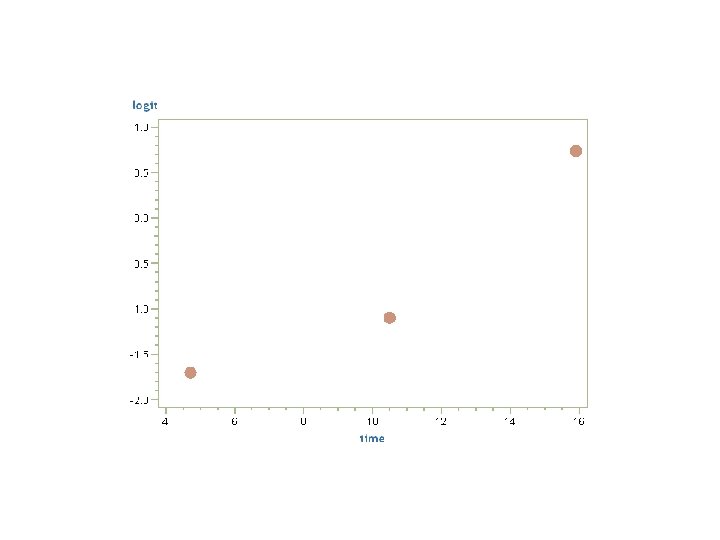
Image from: Categorical Data Analysis Using Logistic Regression Course Notes (2005) SAS.
Like leverage How good does the model do at predicting each person Overall change in parameters if this observation is dropped. Like cooks distance. Standardized change in parameters if this observation is dropped
Poorly fit are in the upper corners. Rough rule of thumb is > 4. See Hosmer and Lemeshow (2000). Events (healthy) Not events (sick)
Modify the code to get a better plot showing the impact on the CLs.
HRP 223 2008 Look for big bubbles and you can hover the mouse over the dots to see the subjectobservation number.
Are you missing interactions? HRP 223 2008 § Compare you model vs. a saturated model. § It does not make sense if you have continuous variables in the model.
HRP 223 2008 Use H and L if you have continuous predictors in the model.
Logistic “issues”
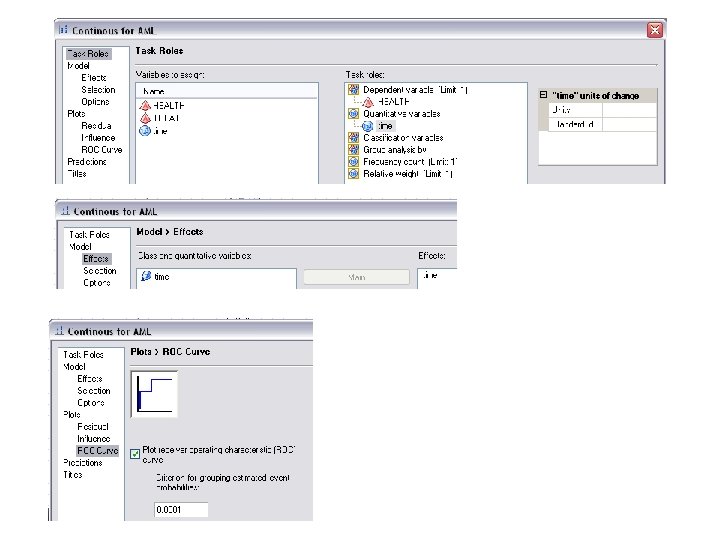
Conditional Logistic You want to predict BBD, so change response variable sort order to descending. They forgot the strata task role! Use “Group analysis by” then tweak the code.
HRP 223 2008 Change “by” into strata.