HRP 223 2008 HRP 223 2008 Topic 8


 =. 75/sqrt(5) =. 34 . 75/sqrt(25) =. 15")


- Slides: 58
HRP 223 - 2008 HRP 223 2008 Topic 8 – Analysis of Means Copyright © 1999 -2008 Leland Stanford Junior University. All rights reserved. Warning: This presentation is protected by copyright law and international treaties. Unauthorized reproduction of this presentation, or any portion of it, may result in severe civil and criminal penalties and will be prosecuted to maximum extent possible under the law.
One Categorical Predictor HRP 223 2008 Normally Distributed Not Normally Distributed One sample vs. population One sample t-test Wilcoxon Signed Rank Two paired samples Paired t-test Difference then Signed Rank Two unpaired samples T-test Wilcoxon Rank-sum Three or more unpaired samples ANOVA Kruskal-Wallis Three or more paired samples Mixed effects Transform then mixed model Normally Distributed Not Normally Distributed One sample vs. population Describe > Distribution Two paired samples Analyze >ANOVA>t-test Describe > Distribution Two unpaired samples Analyze >ANOVA>t-test Describe > Distribution Three or more unpaired samples Analyze >ANOVA>Linear Analyze >ANOVA>Nonpar. Three or more paired samples Analyze >ANOVA>Mixed
Multiple Categorical Predictors § Unpaired samples HRP 223 2008 – ANOVA § Paired samples – Mixed Effects Models § If data is not normally distributed – There are spcialized statistics (Friedman’s test for 2 predictors). – Try to transform into normally distributed.
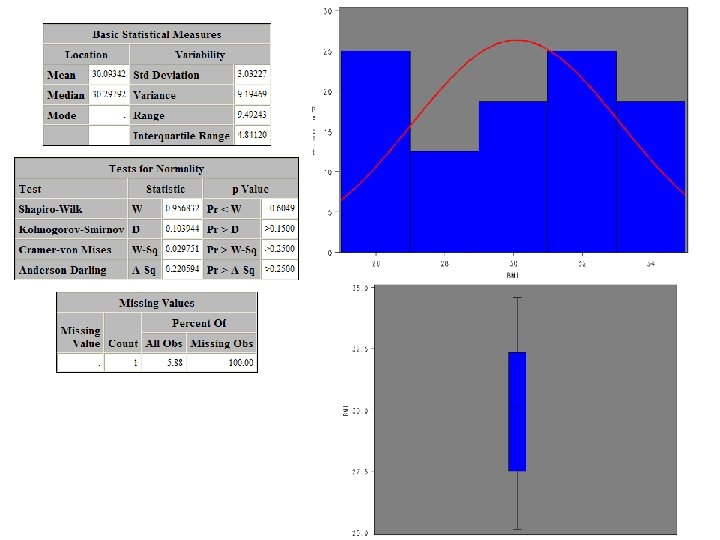
Mean vs. Expected BMI It would be nice to see the actual Excel file.
Adds a link to source and runs import wizard This gives instant access to the current state of the spreadsheet but it is bugged if you mix character and numeric data.
Take a Look at the Data HRP 223 2008
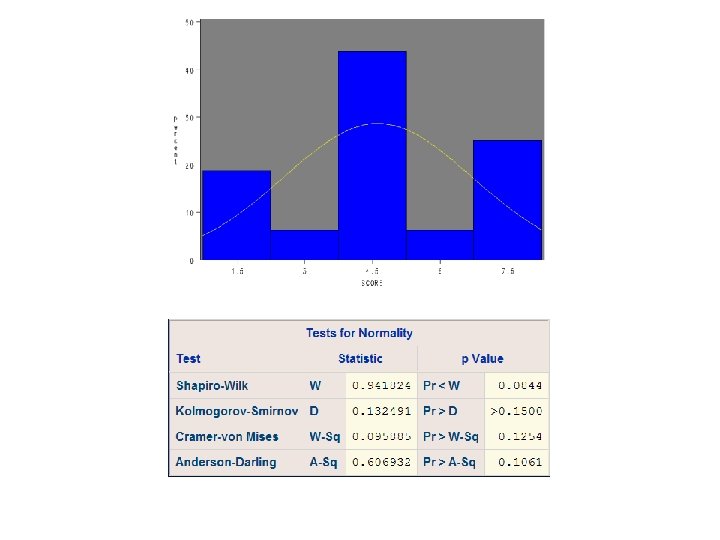
Prior to analysis, do all 3 plots. Histograms and box plots show outliers and bimodal data but are not ideal for assessing normality. The formal tests for normality are not great. They will not find problems with small samples and will declare problems with large samples.
. 3. . . . . . . . . 5. . 4. . . . . 1. normal distribution. . . 2. skewed-to-the-right distribution. . . . . 3. skewed-to-the-left distribution. . 4. heavy-tailed distribution. . . . 5. light-tailed distribution 1. 2. Image from: Statistics I: Introduction to ANOVA, Regression, and Logistic Regression: Course Notes. SAS Press 2008.
Inference 101 HRP 223 2008 § You only have one sample but you want to make inferences to the world. § Given what you see in this sample, you can guess what the distribution of samples looks like around the null distribution.
If the population you are sampling from has a mean of 4, you will not observe a score of 4. Make a histogram of the means How do you compare this sample vs. another with a mean of 5?
Distributions of the Means . 75/sqrt(1) =. 75/sqrt(5) =. 34 . 75/sqrt(25) =. 15
Precision HRP 223 2008 § Think of the “+/- something” imprecision in the estimates of the political polls. § You typically end up saying you are 95% sure you chose an interval that has the true value inside the range bracketed by the confidence limits (CLs). Either the population value is or is not in the interval between the lower and upper confidence limit, and if you repeated the process on many samples, 95% of such intervals would include the population value. § The 99% CI is wider (more accurate) than the more precise 95% CL.
Confidence Intervals from 10 Samples The unobservable truth You want to set the width of the interval so that in 95% of the experiments, the confidence interval includes the true value. In theory, you tweak the interval and increase or decrease the width. Axis with units showing your outcome
Benefits of CLs HRP 223 2008 § You have information about the estimate's precision. § The width of the CI tells you about the degree of random error which is set by the confidence interval. § Wide intervals indicate poor precision. Plausible values could be across a broad range.
Estimation vs. Hypothesis Testing HRP 223 2008 § P-value <. 05 corresponds to a 95% CL that does not include the null hypothesis value. § CLs show uncertainty, or lack of precision, in the estimate of interest and thus convey more useful information than the p-value.
0 difference between groups or odds ratio of 1 CLs vs. p-values null value Lower CL Upper CL P >. 05 and the null value is inside of the confidence limits (CLs) Confidence interval null value Lower CL P <. 05 and the null value is not inside of the confidence limits Upper CL Confidence interval
null value zone of clinical indifference Not statistically significant and not clinically interesting Not statistically significant, possibly clinically interesting Statistically significant but not clinically interesting Statistically significant and clinically interesting
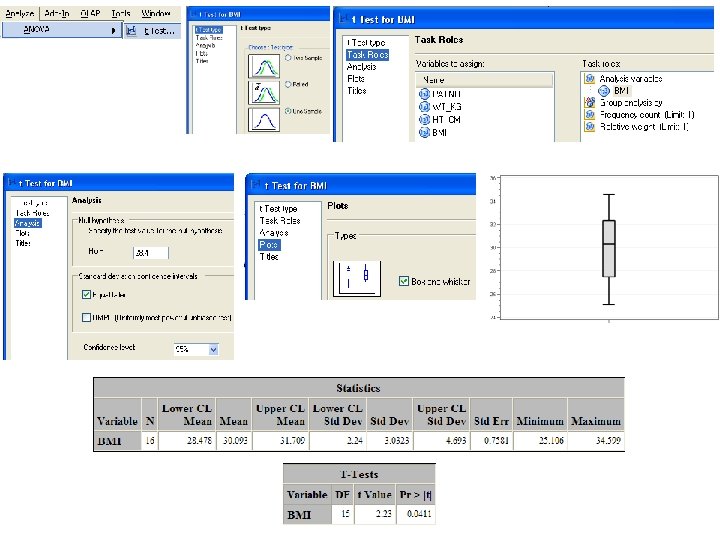
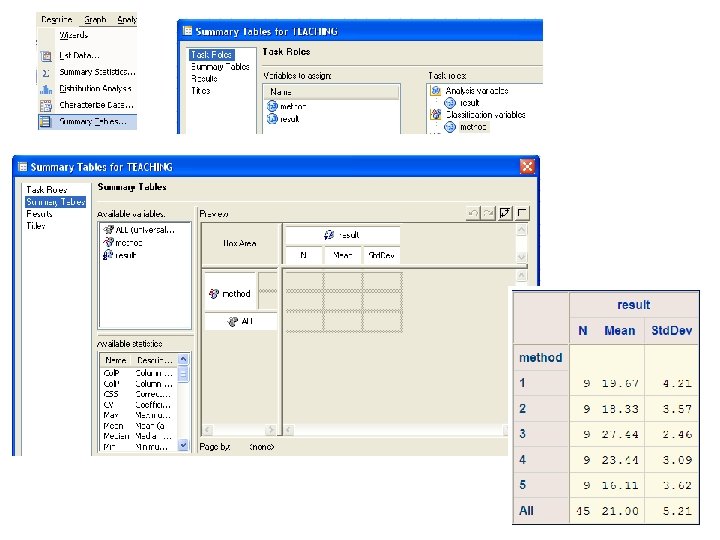
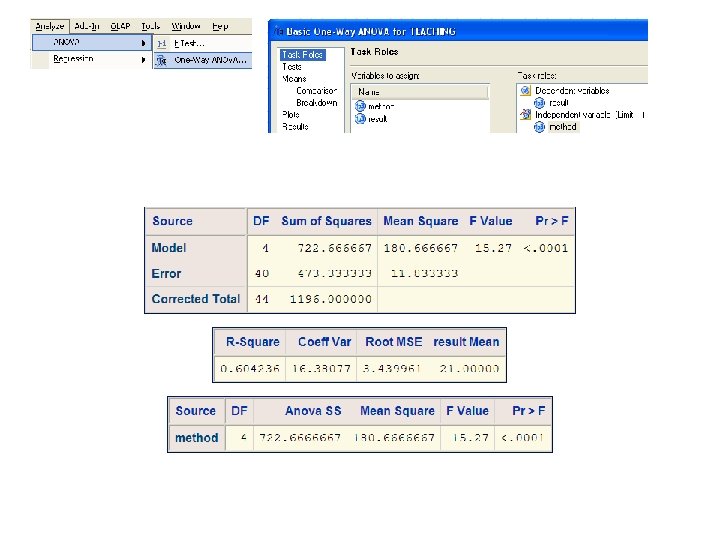
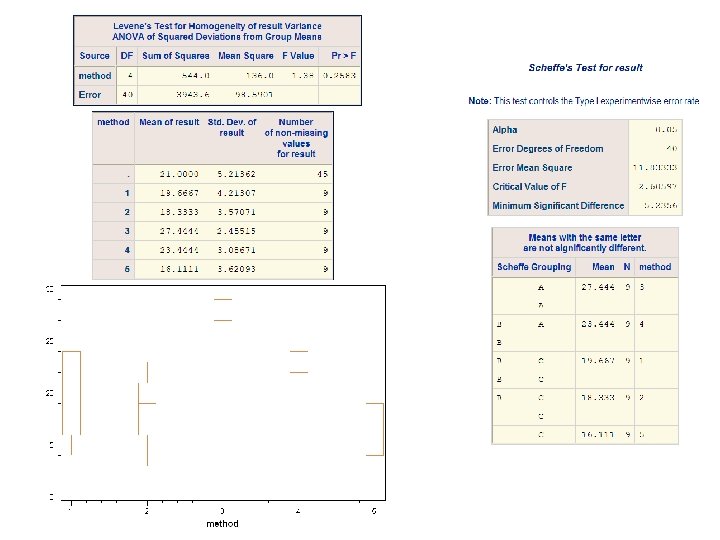
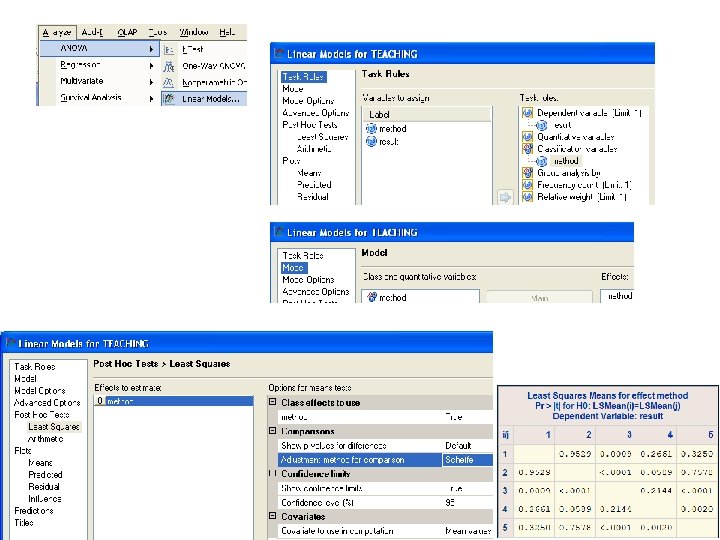
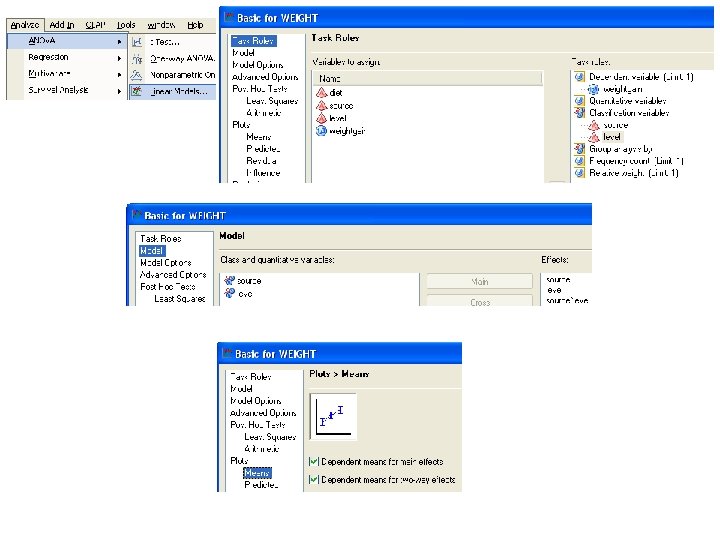
Compare Two Teachers § Import the data § Describe the data HRP 223 2008 – Assign the method as a classification variable § Do an unpaired T-test § Do a one-way ANOVA with the predictor having only two levels
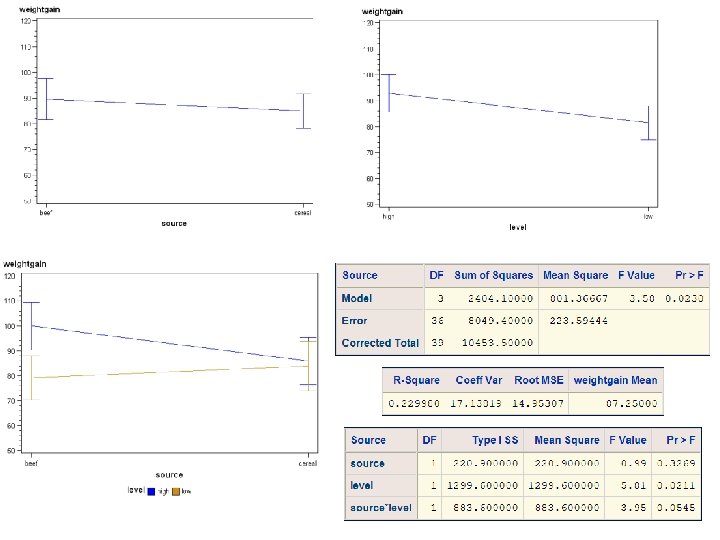
SS total is the sum of the distance between each point and the overall mean line squared. SS error is the sum of the total squared distances between each point and the group mean lines.
HRP 223 2008
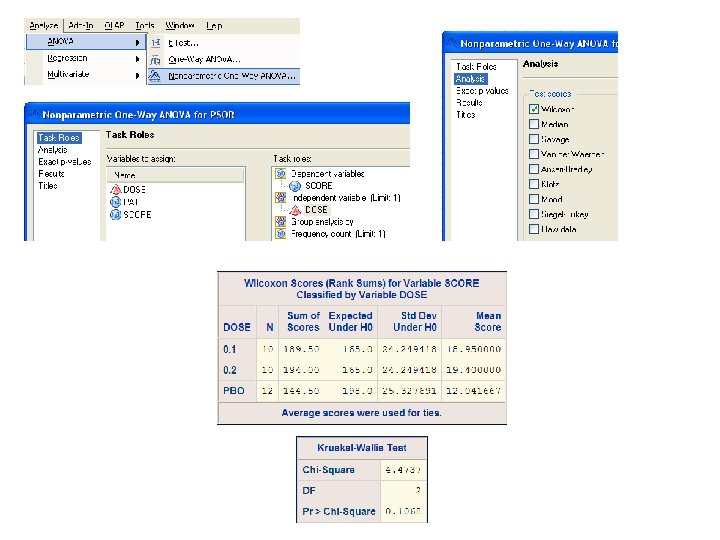
Psoriasis § Scores are arbitrary numbers 0 = < 0% response, 5 = 26 -50% response, etc.
If and only if you work on a fast machine! HRP 223 2008
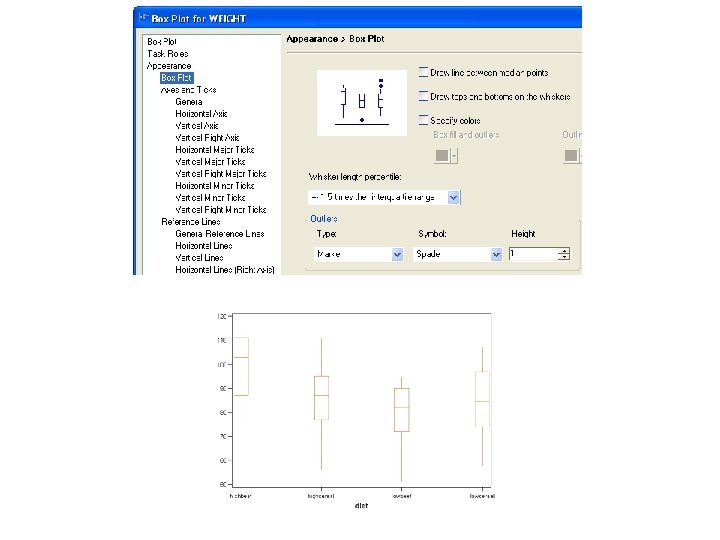
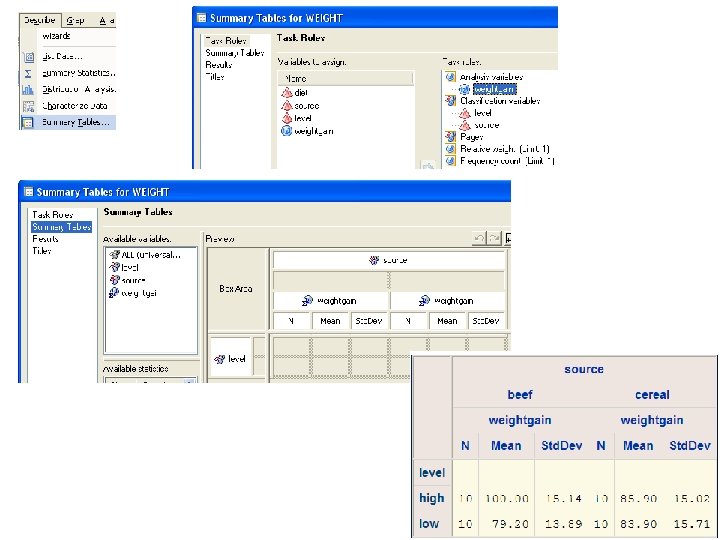
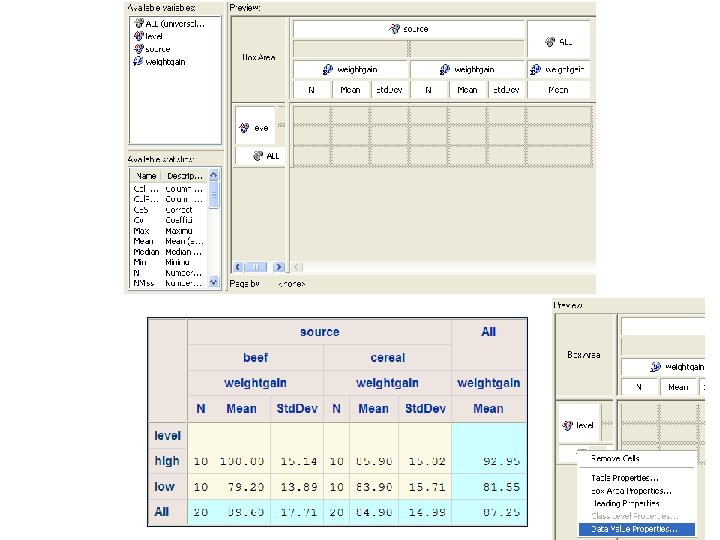
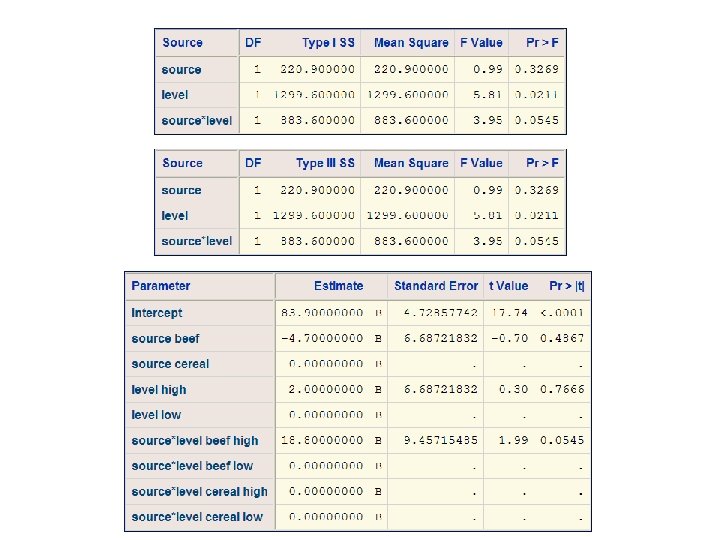
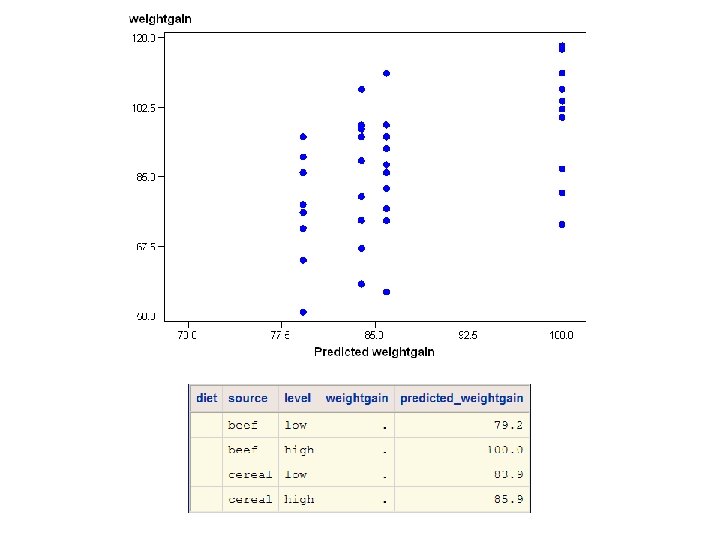
Weight Gain HRP 223 2008
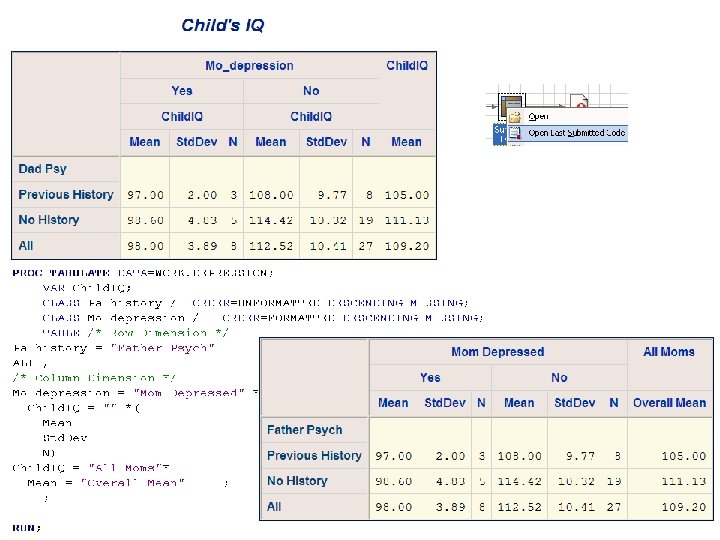
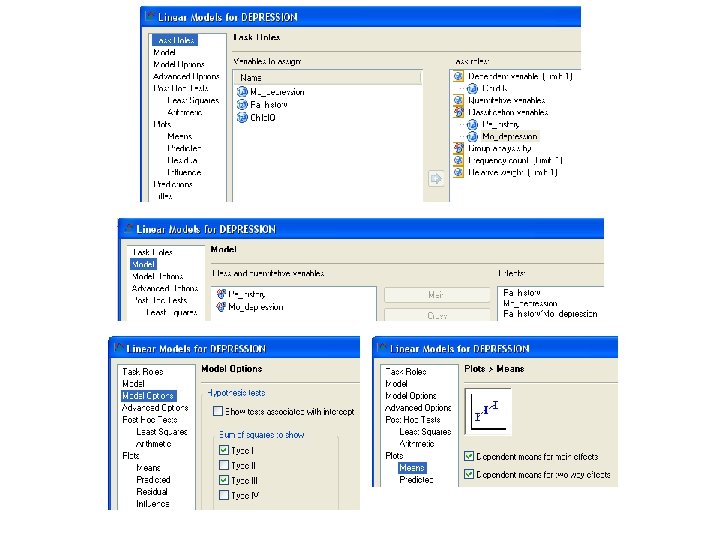
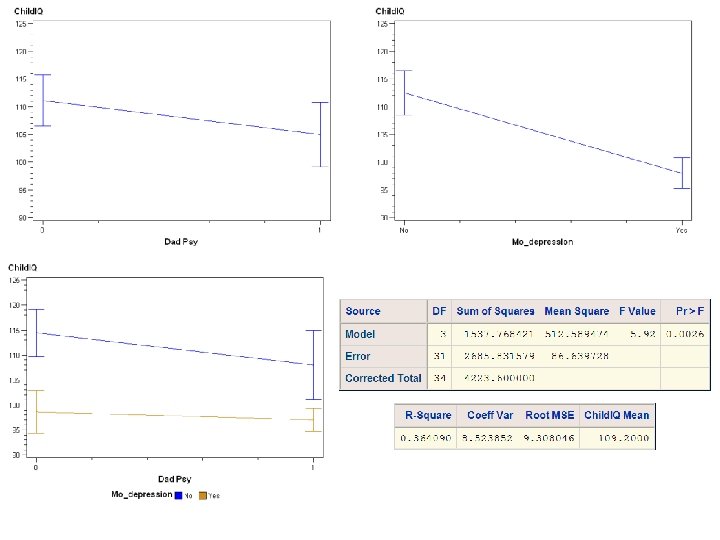
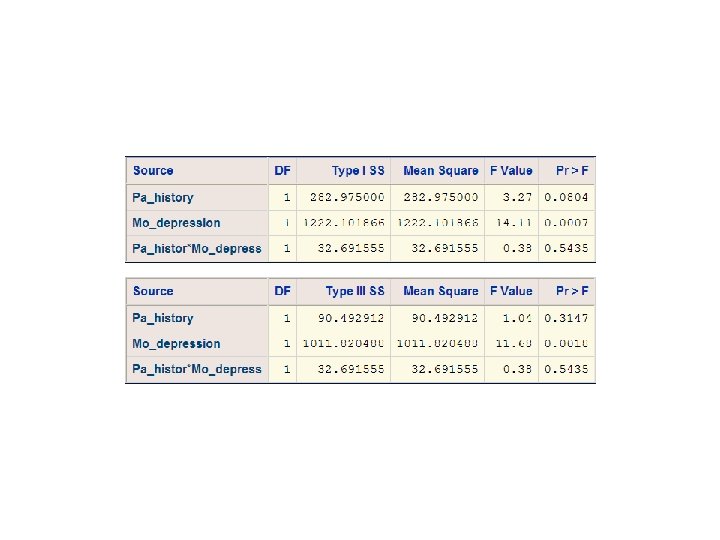
Postpartum Depression
After the Formats
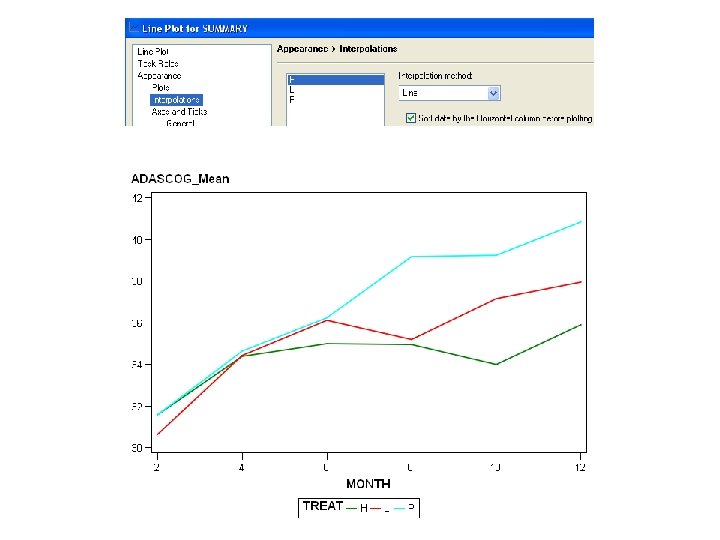
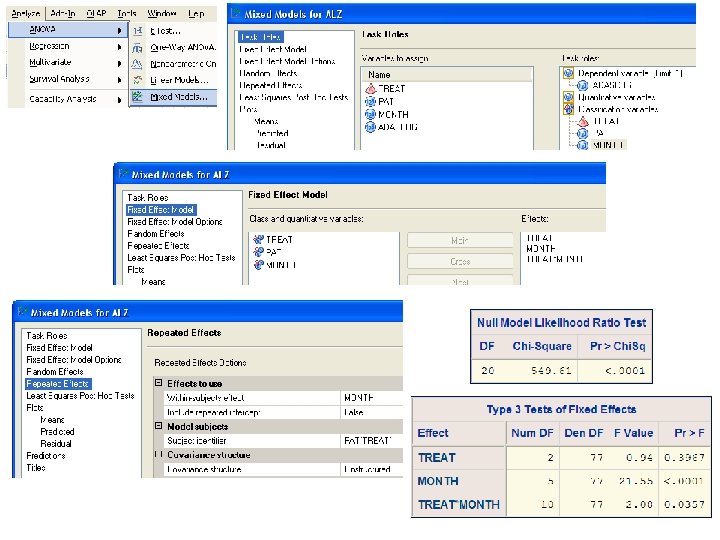
Dementia
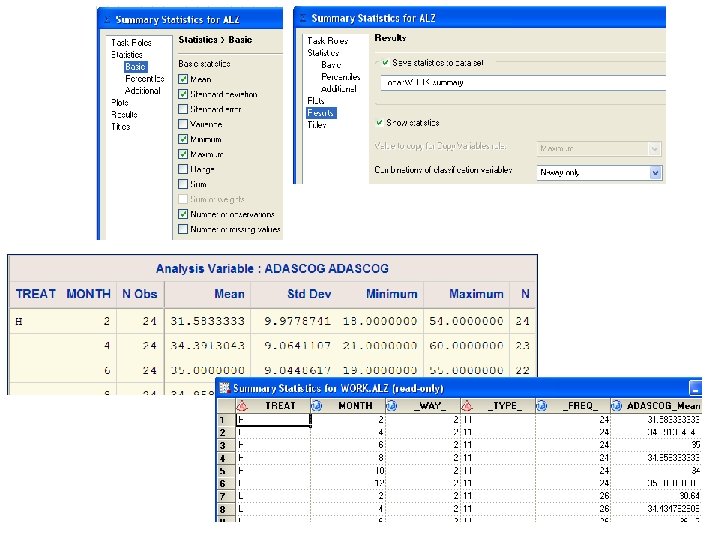
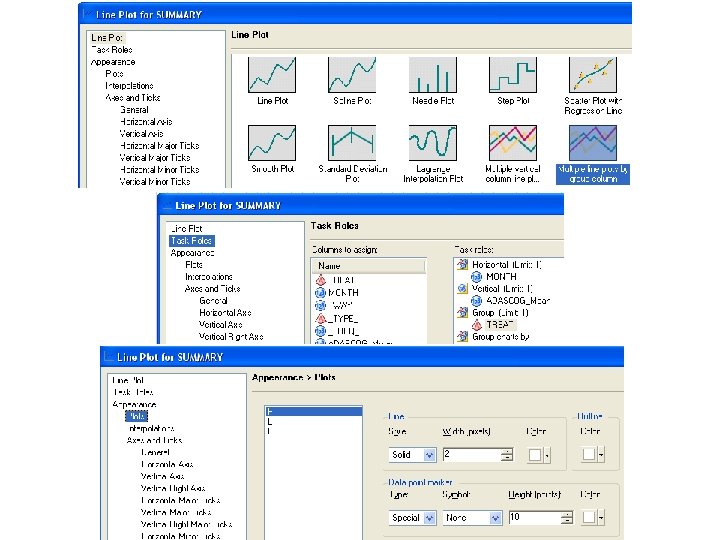
Wide to Long HRP 223 2008 § You may have noticed that the data for these analyses are all set up as long, skinny files where there is a record for every observation on a patient. Some people store data as wide records with many variables with a single record for each person. § To convert from wide to long: – Do data step processing with arrays. – Use the Transpose option on the Data menu. – Combine proc transpose and data step code. – Use a macro I wrote. (It is brand new, so check it. )
Tolerance. sas 7 bdat is dataset from the book Save a copy of the macro in a file after the fill in the blanks are done.
The stuff in the macro file: The stuff in the blah. sas file:
tol: all variables starting with the letters tol
Narrow to Wide HRP 223 2008 § Of course you can transpose back to wide from narrow. § If you download the keyboard macros today you will see that proc transpose now gives you a code template.