GROWTH AND ACTIVITY AND OVERGROWTH AND UNDERACTIVITY PSY


 Address both nutrition and physical activity. 2)")
 Easy")


 73% of the Population of 1 st-3")
 Follow-up: Individual Measurements (age 8) ASP")
")
 Baseline Obesity and Popularity Development Fall Spring")


 Popularity and ASP Participation Fall Spring Time")


")
")


- Slides: 79
GROWTH AND ACTIVITY AND OVER-GROWTH AND UNDERACTIVITY PSY 226 Physical Development During Early Childhood
Objectives Understand normative growth and activity during early childhood. Describe the historical progression of child obesity and several physical and social risks. Identify the key factors contributing to the child obesity epidemic and give examples. Describe the role of social learning in children’s beliefs about body types. Discuss several potential solutions to preventing or reducing child obesity.
Early Childhood Physical Developments: Ages 2 -6 years Early childhood is referred to as “the play years. ” Fast growth, high activity, rapid learning, and social exploration.
Growth Annual: 2 -3” and 4 -6 lbs. Age 2: 30 lbs. , 34” Age 6: 50 lbs. , 45” Growth is similar for boys and girls Size and strength are similar
Activity Physical play rises and peaks around 2 -3 years, then declines Children increase in their ability to sit, listen, pay attention
Activity Boys engage in more rough/tumble play Girls are less apt to wear pants? Parents activity level correlates with their child’s activity level. Parent encourage more activity from boys
Obesity Trends* Among U. S. Adults BRFSS, 1985 (*BMI ≥ 30, or ~ 30 lbs. overweight for 5’ 4” person) No Data <10% 10%– 14%
Obesity Trends* Among U. S. Adults BRFSS, 1986 (*BMI ≥ 30, or ~ 30 lbs. overweight for 5’ 4” person) No Data <10% 10%– 14%
Obesity Trends* Among U. S. Adults BRFSS, 1987 (*BMI ≥ 30, or ~ 30 lbs. overweight for 5’ 4” person) No Data <10% 10%– 14%
Obesity Trends* Among U. S. Adults BRFSS, 1988 (*BMI ≥ 30, or ~ 30 lbs. overweight for 5’ 4” person) No Data <10% 10%– 14%
Obesity Trends* Among U. S. Adults BRFSS, 1989 (*BMI ≥ 30, or ~ 30 lbs. overweight for 5’ 4” person) No Data <10% 10%– 14%
Obesity Trends* Among U. S. Adults BRFSS, 1990 (*BMI ≥ 30, or ~ 30 lbs. overweight for 5’ 4” person) No Data <10% 10%– 14%
Obesity Trends* Among U. S. Adults BRFSS, 1991 (*BMI ≥ 30, or ~ 30 lbs. overweight for 5’ 4” person) No Data <10% 10%– 14% 15%– 19%
Obesity Trends* Among U. S. Adults BRFSS, 1992 (*BMI ≥ 30, or ~ 30 lbs. overweight for 5’ 4” person) No Data <10% 10%– 14% 15%– 19%
Obesity Trends* Among U. S. Adults BRFSS, 1993 (*BMI ≥ 30, or ~ 30 lbs. overweight for 5’ 4” person) No Data <10% 10%– 14% 15%– 19%
Obesity Trends* Among U. S. Adults BRFSS, 1994 (*BMI ≥ 30, or ~ 30 lbs. overweight for 5’ 4” person) No Data <10% 10%– 14% 15%– 19%
Obesity Trends* Among U. S. Adults BRFSS, 1995 (*BMI ≥ 30, or ~ 30 lbs. overweight for 5’ 4” person) No Data <10% 10%– 14% 15%– 19%
Obesity Trends* Among U. S. Adults BRFSS, 1996 (*BMI ≥ 30, or ~ 30 lbs. overweight for 5’ 4” person) No Data <10% 10%– 14% 15%– 19%
Obesity Trends* Among U. S. Adults BRFSS, 1997 (*BMI ≥ 30, or ~ 30 lbs. overweight for 5’ 4” person) No Data <10% 10%– 14% 15%– 19% ≥ 20%
Obesity Trends* Among U. S. Adults BRFSS, 1998 (*BMI ≥ 30, or ~ 30 lbs. overweight for 5’ 4” person) No Data <10% 10%– 14% 15%– 19% ≥ 20%
Obesity Trends* Among U. S. Adults BRFSS, 1999 (*BMI ≥ 30, or ~ 30 lbs. overweight for 5’ 4” person) No Data <10% 10%– 14% 15%– 19% ≥ 20%
Obesity Trends* Among U. S. Adults BRFSS, 2000 (*BMI ≥ 30, or ~ 30 lbs. overweight for 5’ 4” person) No Data <10% 10%– 14% 15%– 19% ≥ 20%
Obesity Trends* Among U. S. Adults BRFSS, 2001 (*BMI ≥ 30, or ~ 30 lbs. overweight for 5’ 4” person) No Data <10% 10%– 14% 15%– 19% 20%– 24% ≥ 25%
Obesity Trends* Among U. S. Adults BRFSS, 2002 (*BMI ≥ 30, or ~ 30 lbs. overweight for 5’ 4” person) No Data <10% 10%– 14% 15%– 19% 20%– 24% ≥ 25%
Obesity Trends* Among U. S. Adults BRFSS, 2003 (*BMI ≥ 30, or ~ 30 lbs. overweight for 5’ 4” person) No Data <10% 10%– 14% 15%– 19% 20%– 24% ≥ 25%
Obesity Trends* Among U. S. Adults BRFSS, 2004 (*BMI ≥ 30, or ~ 30 lbs. overweight for 5’ 4” person) No Data <10% 10%– 14% 15%– 19% 20%– 24% ≥ 25%
Obesity Trends* Among U. S. Adults BRFSS, 2005 (*BMI ≥ 30, or ~ 30 lbs. overweight for 5’ 4” person) No Data <10% 29% ≥ 30% 10%– 14% 15%– 19% 20%– 24% 25%–
Obesity Trends* Among U. S. Adults BRFSS, 2006 (*BMI ≥ 30, or ~ 30 lbs. overweight for 5’ 4” person) No Data <10% 29% ≥ 30% 10%– 14% 15%– 19% 20%– 24% 25%–
Obesity Trends* Among U. S. Adults BRFSS, 2007 (*BMI ≥ 30, or ~ 30 lbs. overweight for 5’ 4” person) No Data <10% 29% ≥ 30% 10%– 14% 15%– 19% 20%– 24% 25%–
Obesity Trends* Among U. S. Adults BRFSS, 2008 (*BMI ≥ 30, or ~ 30 lbs. overweight for 5’ 4” person) No Data <10% 29% ≥ 30% 10%– 14% 15%– 19% 20%– 24% 25%–
Obesity Trends* Among U. S. Adults BRFSS, 2009 (*BMI ≥ 30, or ~ 30 lbs. overweight for 5’ 4” person) No Data <10% 29% ≥ 30% 10%– 14% 15%– 19% 20%– 24% 25%–
Prevalence* of Self-Reported Obesity Among U. S. Adults by State and Territory, BRFSS, 2011 *Prevalence estimates reflect BRFSS methodological changes started in 2011. These estimates should not be compared to prevalence estimates before 2011. WA MT OR ME ND ID MN VT SD WI IA NE NV PA IL UT CO KS CA AZ OK NM TX OH IN WV MO KY VA NC TN AR SC MS AK NY MI WY NH MA RI CT NJ DE MD DC AL GA LA FL HI GUAM 15%–<20% 20%–<25% 25%–<30% PR 30%–<35% ≥ 35%
Prevalence* of Self-Reported Obesity Among U. S. Adults by State and Territory, BRFSS, 2012 *Prevalence estimates reflect BRFSS methodological changes started in 2011. These estimates should not be compared to prevalence estimates before 2011. WA MT OR ME ND ID MN VT SD WI IA NE NV PA IL UT CO KS CA AZ OK NM TX OH IN WV MO KY VA NC TN AR SC MS AK NY MI WY NH MA RI CT NJ DE MD DC AL GA LA FL HI GUAM 15%–<20% 20%–<25% 25%–<30% PR 30%–<35% ≥ 35%
Prevalence* of Self-Reported Obesity Among U. S. Adults by State and Territory, BRFSS, 2013 *Prevalence estimates reflect BRFSS methodological changes started in 2011. These estimates should not be compared to prevalence estimates before 2011. WA MT OR ME ND ID MN VT SD WI IA NE NV PA IL UT CO KS CA AZ OK NM TX OH IN WV MO KY VA NC TN AR SC MS AK NY MI WY NH MA RI CT NJ DE MD DC AL GA LA FL HI GUAM 15%–<20% 20%–<25% 25%–<30% PR 30%–<35% ≥ 35%
Obesity in the US Adult obesity has more than doubled in the last 30 years. 69. 8% Adults Overweight 35. 9% Adults Clinically Obese 6. 3% Adults Extremely Obese Greater increase for children and adolescents Source: CDC 2012
Percentage of U. S. Youth who are Obese by age Equal or greater than 95% age/sex CDC Growth Charts Source: Medline, 2006 Ogden et al. JAMA; 195: 1549 -55, Hedley et al. JAMA; 291: 2847 -2850; CDC, 2012
Obesity in Children & Adolescents 2 -5 Year Olds = 12. 1% 6 -11 Year Olds = 18. 0% 12 -19 Year Olds = 18. 4% Source: CDC 2012
Who Cares? Sleep apnea High Blood Pressure & Hypertension Gallbladder Disease Psychological Disorders (e. g. , depression) Type II Diabetes Adult Cardiovascular Disease Premature Death Medical Costs $147 Billion (2008)
Actual Causes of Death in US– 2000 Physical inactivity and poor diets are associated with 300, 000 to 500, 000 deaths each year JAMA 291: 1238 -1245, March 10, 2004 Danaei et al. 2009 Percent of Deaths
Social Consequences Negative Social Stigma Fewer nominations for friendships Higher rates of peer rejection Greater rates of bullying Relational (rumors) and overt (hitting) Victim and perpetrator E. g. , Janssen et al. 2003
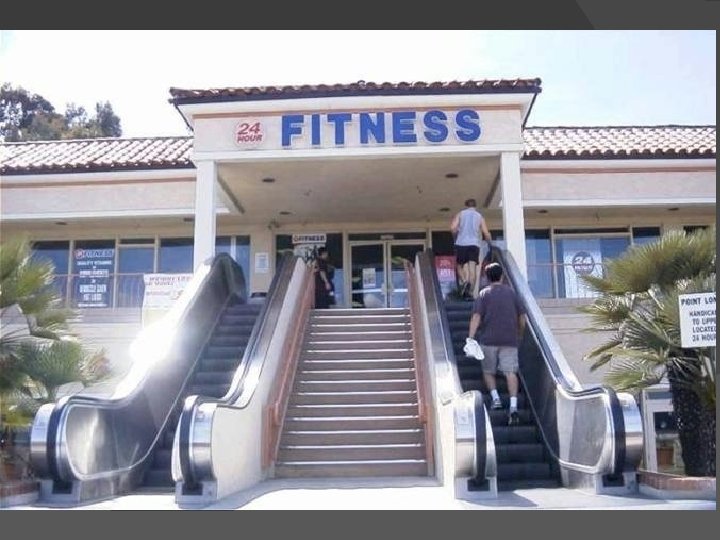
Reasons for the Super. Sizing? Energy Input > Energy Output Hint: It’s not genes… Toxic Food Environment Sedentary Lifestyle
Cost of Food CDC 2005
The American Landscape “Super Size Me” Fries = 640 cal. ; 29 g fat; 45% fat Big Mac = 549 cal. ; 29 g fat; 48% fat Coke (42 oz. ) = 540 calories Total = 1729 calories; 58 g fat
National Geographic, August 2004; The Heavy Cost of Fat, p. 59
Marketing and Media
% Meeting Guidelines DHHS Guidelines for Aerobic Activity and Muscle Strengthening YEAR Source: US Dept. of Heath & Human Services (2012)
Body Type Assignment
Family-Based Solutions… Given the body types and messages… What Can Parents Do to Help Their Children Stay Healthy?
CDC State-Level Guidelines for Addressing Obesity 1) Address both nutrition and physical activity. 2) Change environments and policies that affect those behaviors (e. g. , access to supermarkets and areas facilitating physical activity). Work across multiple settings (e. g. , medical-care sites, school, worksites, and community organizations). 3) Change individual behaviors (e. g. , improved diet, greater consumption of fruits and vegetables as well).
CDC Examples of State-Level Initiatives FOOD AND NUTRITION Food Policy Controls (cost, ads) Easy Access to Farm Produce School & Work Food Policies (types, ads) Maternity Care Practices (healthy feeding) Limit Access to Sugared Soft Drinks Menu Label Policies (calories, fat grams)
CDC Examples of State-Level Initiatives PHYSICAL ACTIVITY Community Design for Activity Active Transport to School (walk, bike) School-Based PE (regular, MVPA) Child Care Policies (food, exercise)
Children’s After-school Program Participation and the Development of BMI and Obesity
Why Should After-school Programs Affect BMI/Obesity? Controlled eating Opportunities for physical recreation and health education
Challenges California Elementary Schools Face • Avg. 15 min PE/day • Avg. 2 min MVPA/day MVPA = Moderate to Vigorous Physical Activity (you can break a sweat) Physical Education Matters, Failing Fitness, California Endowment Reports 2006
Why Should After-school Programs Affect BMI/Obesity? Healthy Role Models Healthier Lifestyle More “palatable” than traditional treatments
Why Should After-school Programs Affect Peer Relations ASPs are Social Contexts Additional Time with Peers ○ Average 87 Days/Year (261 Hours/Year) ASP Context and Classroom are Socially Interdependent ASP Activities are Socially Valued
Study of Children’s After-School Time 4 -Year Longitudinal Study
Participants N = 599 (48. 5% girls) 73% of the Population of 1 st-3 rd graders from 3 Public Schools Sub-sample (N = 439) with Baseline BMI Information Economically Disadvantaged, Urban Sample 58% poverty 30% near poverty 10% no poverty Median Annual Household Income = $16, 794 Diversity 46% Hispanic, 34% Black, 6% White, 14% Other
Measures Obesity Baseline: Student Health Records (age 5) Follow-up: Individual Measurements (age 8) ASP Participation Daily Program Attendance Records Peer Acceptance Teacher-rated Popularity (ICS-T) Peer Nominations Control Variables Poverty Status, Race/Ethnicity
Percentage Obesity Status Age 5 Age 8 Clinically Obese (BMI ≥ 95 th Percentile) Based on CDC Growth Charts According to Age and Gender
Teacher-Rated Popularity (Scale Range 1 to 5) Baseline Obesity and Popularity Development Fall Spring Time of Assessment Source: Mahoney, Lord, & Carryl (2005)
# of Nominations Obesity and Peer Nominations: “Do Not Want to Hang Around With” Obesity Status Source: Mahoney, Lord, & Carryl (2005)
Body Mass Index ASP Participation and BMI Change Time of Assessment Source: Mahoney, Lord, & Carryl (2005)
% Obese at Follow-Up ASP Participation and Obesity Prevalence Age 5 Age 8 ASP Participation Source: Mahoney, Lord, & Carryl (2005)
Teacher-Rated Popularity (Scale Range 1 to 5) Popularity and ASP Participation Fall Spring Time of Assessment Source: Mahoney, Lord, & Carryl (2005)
# of Nominations ASP Participation & Peer Nominations: “Do Not Want to Hang Around With” Obesity Status Source: Mahoney, Lord, & Carryl (2005)
Summary Child Obesity Prevalent and increasing Indicative of low peer acceptance over time Participation in After-school Programs Less marked increase in BMI Lower prevalence of obesity at follow-up Increased popularity Fewer negative peer nominations
Adolescent Summer Arrangements and the Development of Obesity
Why Focus on Summertime? Longest Consecutive Period of Out-of -school Time 23% of the Calendar Year Less than 1 in 10, 000 publications on summertime
Summertime Can Contribute to Obesity Not always a healthy time Summer weight gain for youth
Methodology: Sample PSID-CDS is Nationally Representative Subsample: N = 1766 Ages 10 -18 at Wave II (2002 -2003) Male 49% Race/Ethnicity ○ 62% White ○ 16% African American ○ 13% Hispanic or Latino
Regular Child Care Arrangements: Parent Interview “Now I'm going to ask you some questions about child care arrangements last summer. Please tell me which of these you used for _X_ on a regular basis during last summer”
Do Summer Care Arrangements Predict Subsequent Obesity? Parent Care Self Care Relative Care Organized Activities
% Obese SUMMER ARRANGEMENTS AND RISK FOR OBESITY Regular Summer Arrangements Source: Mahoney (2011)
% Obese SUMMER ARRANGEMENTS AND RISK FOR OBESITY Regular Summer Arrangements Source: Mahoney (2011)
Summary Adolescent summertime arrangements are significantly associated with obesity Obesity highest for parent care Participation in summer activities predicts lower prevalence of obesity
Objectives Understand normative growth and activity during early childhood. Describe the historical progression of child obesity and several physical and social risks. Identify the key factors contributing to the child obesity epidemic and give examples. Describe the role of social learning in children’s beliefs about body types. Discuss several potential solutions to preventing or reducing child obesity.