
2 1 Block 2 FLT I can interpret
2. 1 (Block 2) FLT: I can interpret graphs and make conclusions about the population through 4 graphs
Warm Up 10 min to… Finish pg 10—Lily Pad questions. Check the answer key. Come and show me
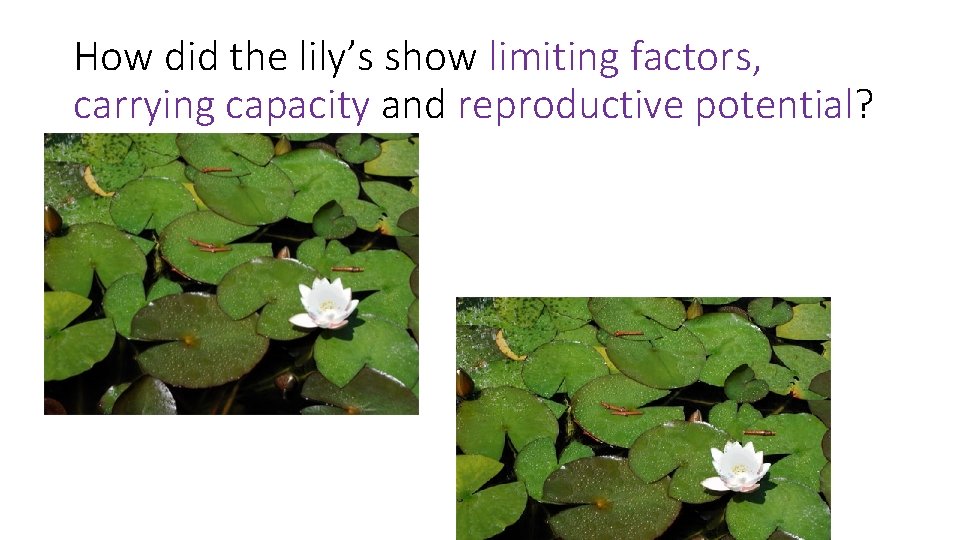
How did the lily’s show limiting factors, carrying capacity and reproductive potential?
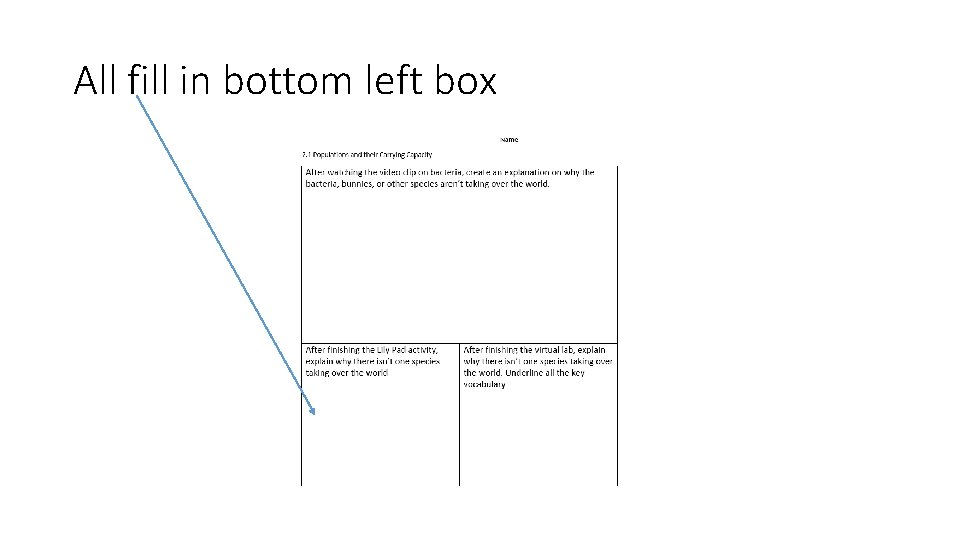
All fill in bottom left box
Notebook Table of Contents • Page 1—Your name and Biology • Page 2—Surgery week paper (STAPLE) • Page 3 --Safety rules or standard deviation (per 3 + 5) • Page 4—Pig article reflection • Page 5— 2. 1 Explanation Page 6 -Warm Up Page 7 --Notes Page 8—Lily graph Page 9—Lily Pad Page 10—Lily Pad Page 11—Graphs 1 -2 Page 12—Graphs 3 -4
Due Thurs Pig Project—First Stamp=A+ in Class FRONT of PIG -7 organ names and mini-parts with FUNCTIONS -7 PHOTOS or drawings of the organs (can get photos from my weebly) BACK -Dissection reflection (3 sentences) -Pro or con to pig organ transplants ( 3 sentences) STAPLE -Dissection packet or virtual dissection notes
How to interpret what a population is doing by looking at a graph 1. Start by looking at axis and title 2. Look at beginning, middle, end 3. Any patterns? If the population is FLAT=hit carrying capacity. If looks like a J=exponential 4. Draw conclusions about population
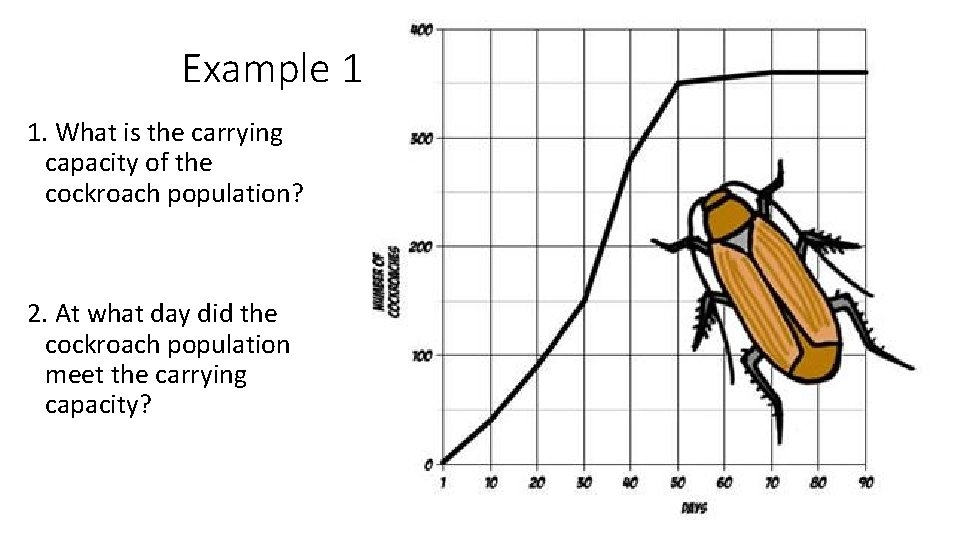
Example 1 1. What is the carrying capacity of the cockroach population? 2. At what day did the cockroach population meet the carrying capacity?
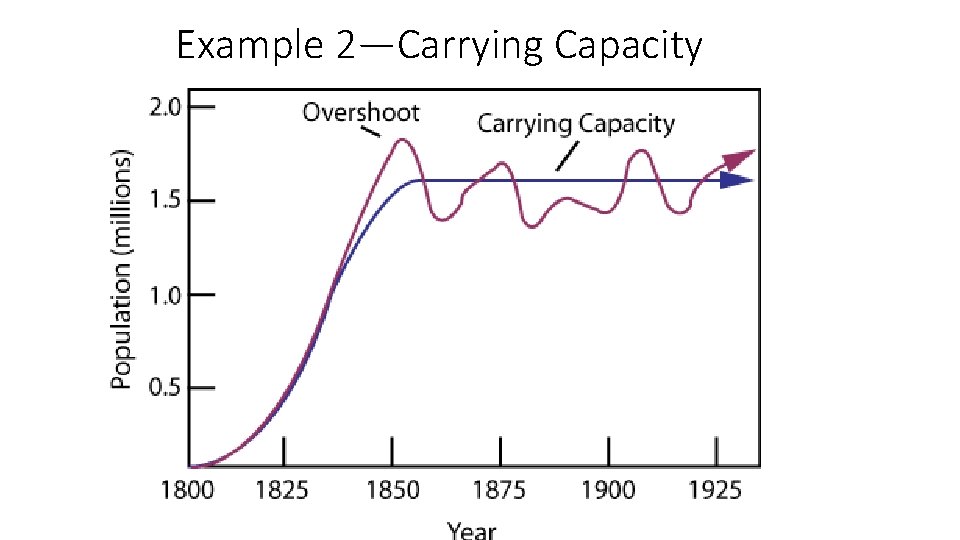
Example 2—Carrying Capacity
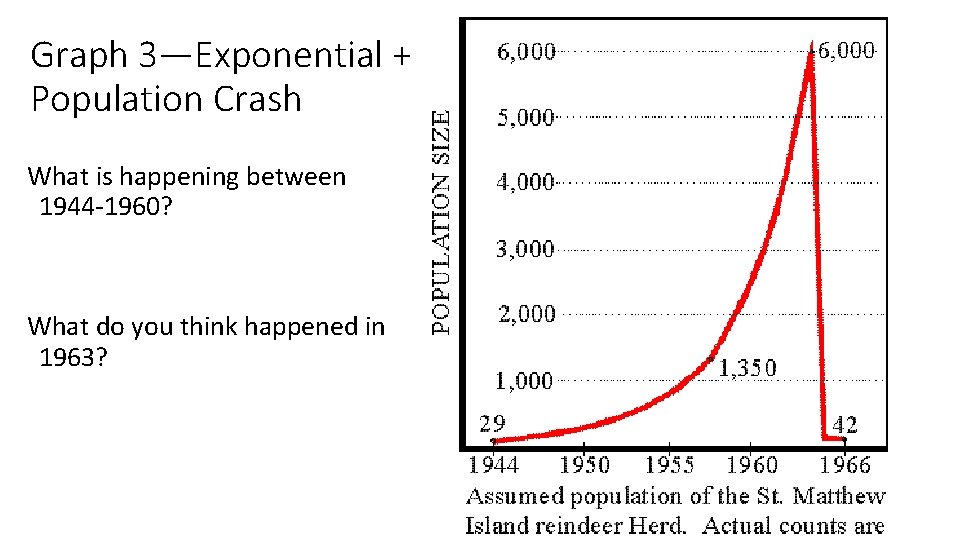
Graph 3—Exponential + Population Crash What is happening between 1944 -1960? What do you think happened in 1963?
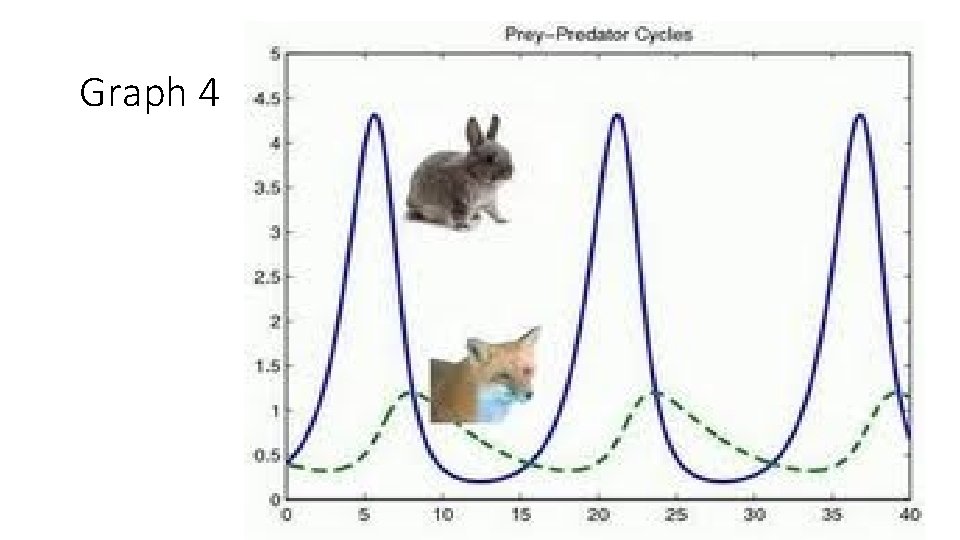
Graph 4

Your turn—Look at 4 graph interpretations answer all questions Page 11—Graphs 1 + 2 Page 12—Graphs 3 + 4
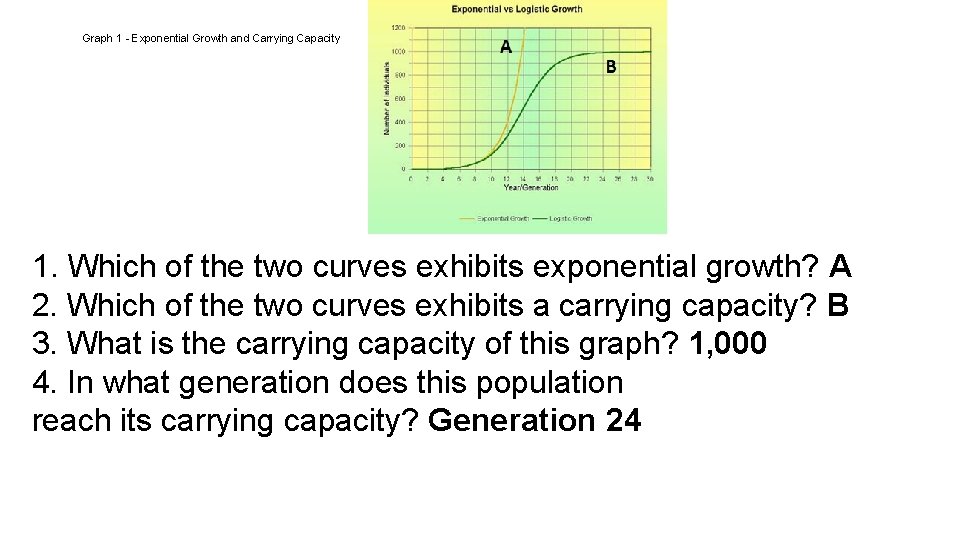
Graph 1 - Exponential Growth and Carrying Capacity 1. Which of the two curves exhibits exponential growth? A 2. Which of the two curves exhibits a carrying capacity? B 3. What is the carrying capacity of this graph? 1, 000 4. In what generation does this population reach its carrying capacity? Generation 24
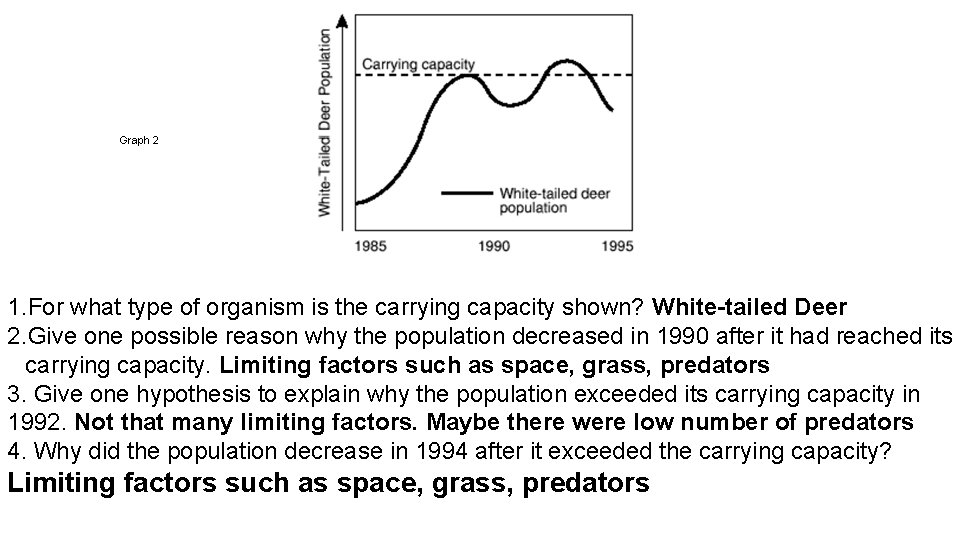
Graph 2 1. For what type of organism is the carrying capacity shown? White-tailed Deer 2. Give one possible reason why the population decreased in 1990 after it had reached its carrying capacity. Limiting factors such as space, grass, predators 3. Give one hypothesis to explain why the population exceeded its carrying capacity in 1992. Not that many limiting factors. Maybe there were low number of predators 4. Why did the population decrease in 1994 after it exceeded the carrying capacity? Limiting factors such as space, grass, predators
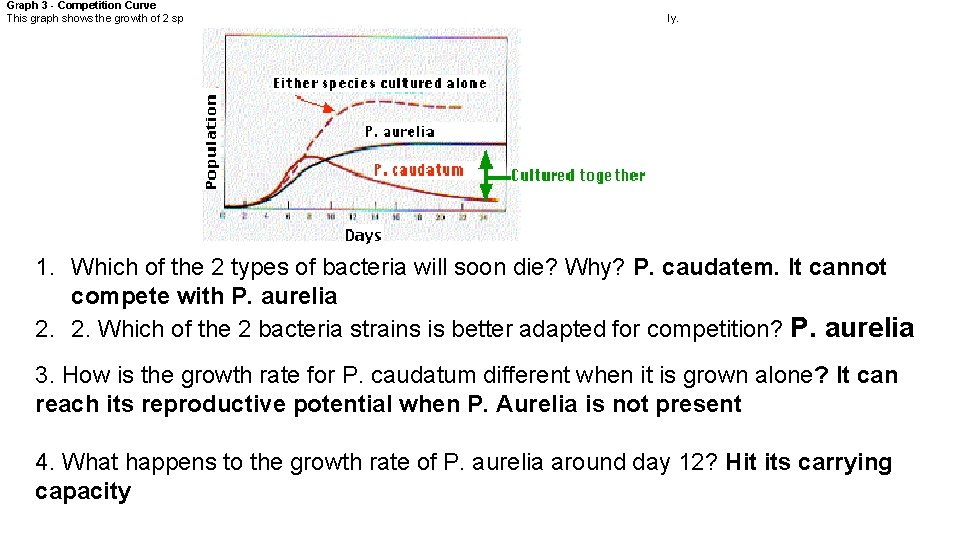
Graph 3 - Competition Curve This graph shows the growth of 2 species of bacteria grown on the same petri dish. It also shows their growth rate when grown separately. 1. Which of the 2 types of bacteria will soon die? Why? P. caudatem. It cannot compete with P. aurelia 2. 2. Which of the 2 bacteria strains is better adapted for competition? P. aurelia 3. How is the growth rate for P. caudatum different when it is grown alone? It can reach its reproductive potential when P. Aurelia is not present 4. What happens to the growth rate of P. aurelia around day 12? Hit its carrying capacity
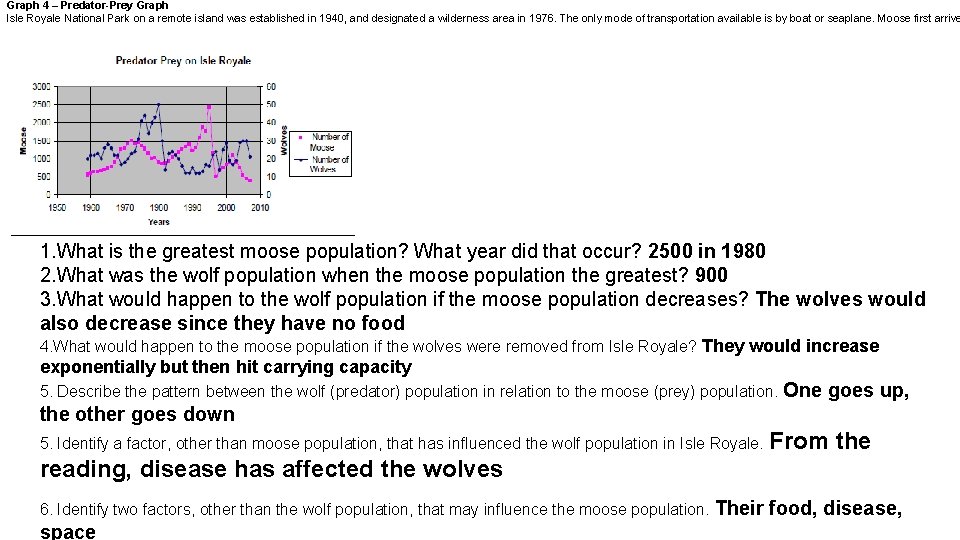
Graph 4 – Predator-Prey Graph Isle Royale National Park on a remote island was established in 1940, and designated a wilderness area in 1976. The only mode of transportation available is by boat or seaplane. Moose first arrive 1. What is the greatest moose population? What year did that occur? 2500 in 1980 2. What was the wolf population when the moose population the greatest? 900 3. What would happen to the wolf population if the moose population decreases? The wolves would also decrease since they have no food 4. What would happen to the moose population if the wolves were removed from Isle Royale? They would increase exponentially but then hit carrying capacity 5. Describe the pattern between the wolf (predator) population in relation to the moose (prey) population. One goes up, the other goes down 5. Identify a factor, other than moose population, that has influenced the wolf population in Isle Royale. From the reading, disease has affected the wolves 6. Identify two factors, other than the wolf population, that may influence the moose population. space Their food, disease,
- Slides: 16