ERROR ANALYSIS AND METHOD FOR ERROR ESTIMATE P


 is a normal distribution with a")


- Slides: 24
ERROR ANALYSIS AND METHOD FOR ERROR ESTIMATE P M V Subbarao Professor Mechanical Engineering Department Measures for degree of Truthfulness …
Theoretical to Actual Cycle
Experimental Test Rig
Engine specifications Model Kirloskar TAFI Type Single cylinder, four stroke, direct injection Piston type Bowl-in-piston Capacity 661 cm 3 Bore × stroke 87. 5 mm × 110 mm Compression ratio 17. 5: 1 Speed (constant) 1300 rpm Rated powder 4. 0 k. W Dynamometer Electric Cooling system Air cooling
Pressure Transducer • Quartz pressure sensor for measuring dynamic and quasistatic pressures up to 250 bar at temperatures up to 200°C. • Very small dimensions, high natural frequency. • The measured pressure acts through the diaphragm on the quartz crystal measuring element, which transforms the pressure p (bar) into an electrostatic charge Q (p. C = pico. Coulomb). • The stainless steel diaphragm is welded flush and hermetically to the stainless steel sensor body. • Sensitivity 15. 1 p. C/bar
Cold Period of Operation Hot Period of Operation
Co-ordination of Valve Action with Piston Displacement
Measurement of Pressure Vs Crank Angle in A Diesel Engine
Measurement of Pressure Vs Crank Angle in A Diesel Engine
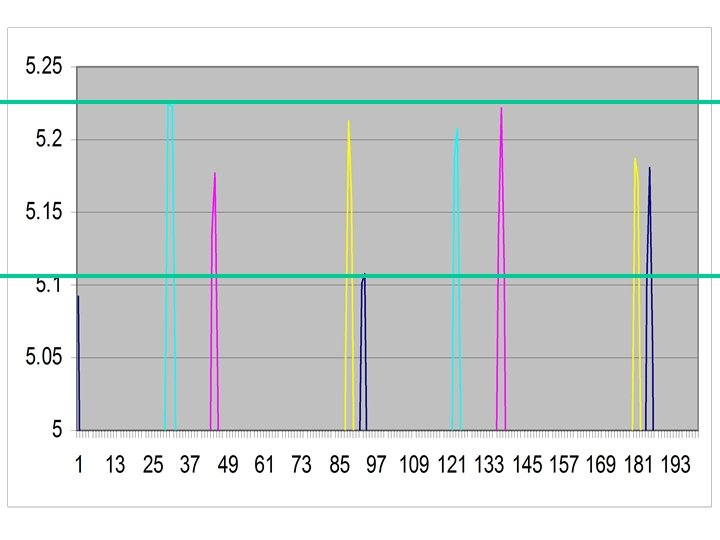
Repeated Measurement of Diesel Cycle
Reaction to the Behaviour of Measured Values • • • Is it a valid Measurement? Is it possible to improve the degree of truthfulness? How to compute the degree of truthfulness? What are the salient features of repeated measurements? Is it possible to control the variation?
Classification of Errors • Ideal Distinction: bias versus random errors • Bias error is a systematic inaccuracy caused by a mechanism that can be (ideally) controlled. • Measurements can be adjusted to account for bias errors. • Random error is a non-repeatable inaccuracy caused by an unknown or an uncontrollable influence. • Random errors establish the limits on the precision of a measurement. • A more practical distinction of errors as three types of errors. • Fixed errors • Random errors • Variable but deterministic errors • Fixed errors and variable but deterministic errors are also called bias errors.
Fixed Error • All repeatable errors are fixed errors. • A fixed error is the same for each nominal operating point of the system • Sources of fixed error: • Sensor calibration • Fixed disturbance to system • Examples • A pressure gauge that always reads 20 k. Pa high. • Heat flow along thermocouple leads when measuring the temperature of an object. • Effect of probe blockage on flow field downstream of the probe.
Wheatstone Bridge for RTD RRTD
Electric Resistance, in Ohms Circuit Voltage, m. V Calibration Errors
Reasons for Fixed Errors
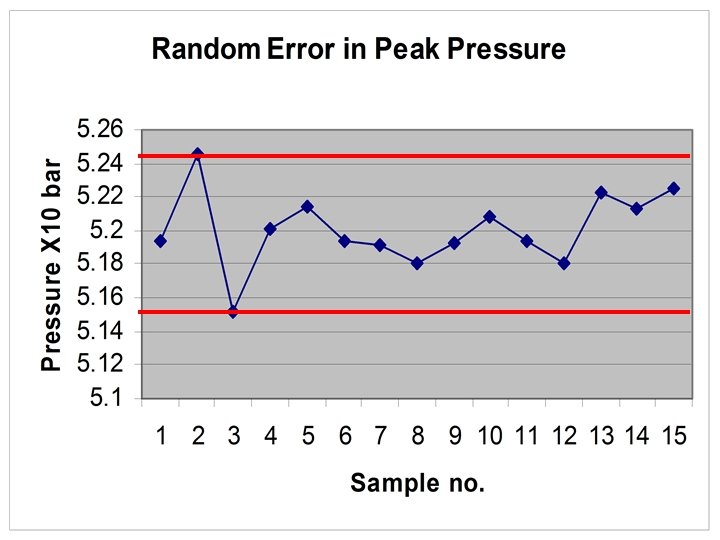
Random Error • Random errors have different magnitude during subsequent measurements of the same quantity. • For well behaved systems, random errors in a measurement cause a cluster of observed values. • We will assume that random errors are normally distributed. • This is reasonable for large sample sizes and truly random errors
Central Limit Theorem The sample mean of a sample taken from a population with some arbitrary distribution, in the limit, tend to be normally distributed with the same mean as the population and with a variance equal to the population variance divided by the sample size. A histogram plot of the means of many samples drawn from one population will therefore form a normal (bell shaped) curve regardless of the distribution of the population values.
Normal distributions are a family of distributions with a symmetrical bell shape The area under each of the curves above is the same and most of the values occur in the middle of the curve. The mean and standard deviation of a normal distribution control how tall and wide it is.
• The standard normal distribution (z distribution) is a normal distribution with a mean of 0 and a standard deviation of 1. • Any point (x) from a normal distribution can be converted to the standard normal distribution (z) with the formula z = (xmean) / standard deviation. • z for any particular x value shows how many standard deviations x is away from the mean for all x values.
Variable but Deterministic Error • Some errors that appear to be random can be caused by faulty measurement techniques or the errors may be variable but deterministic. • Errors change even though the system is at the same nominal operating point • Errors may not be recognized as deterministic: variations between tests, or test conditions, may seem random. • Cause of these errors are initially hidden from the experimenter
• Variations in room air conditions such as temperature and air circulation patterns – – set-back thermostats solar radiation through windows presence of people in the room windows open to outside • Changes in sensors – Thermal drift of sensors – Use of a new batch of thermocouple wire with different calibration – Cold working of thermocouple wire • Changes in consumable materials or equipment used in experiments – Leakage or chemical degradation of working fluid – Mechanical wear or misalignment of positioning equipment