MATHEMATICS AND SCIENCE Estimate An estimate is an


- Slides: 21
MATHEMATICS AND SCIENCE
Estimate
� � An estimate is an approximation of a number based on reasonable assumptions. Not the same as guessing!!! �Based � on known info Scientist must sometimes rely on estimates when they cannot obtain exact numbers
Accuracy and Precision � Accuracy – refers to how close a measurement is to the true value. � Precision – refers to how close a group of measurements are to each other.
Neither Accurate or Precise Accurate and Precise but not Accurate
Significant Figures � The significant figures in a measurement include all the digits that have been measured exactly, plus one whose value has been estimated.
Mean Several ways to determine the average number. 1. Mean - is the numerical average by adding up all the numbers and then dividing by the total number of items in the list. Test scores: Mean = 88 94 72 90 7
Median Several ways to determine the average number. 2. Median – the middle number in a set of data. - Place all the numbers in order from smallest to largest. Circle the middle number. 110 102 110 107 94 110 109 Median = 8
Mode Several ways to determine the average number. 2. Mode – the number that appears most often in a list of numbers. - Place all the numbers in order from smallest to largest. 110 102 110 107 94 110 109 Mode = 9
Percent Error Percent error is used to determine how accurate, or close to the true value an experimental value really is.
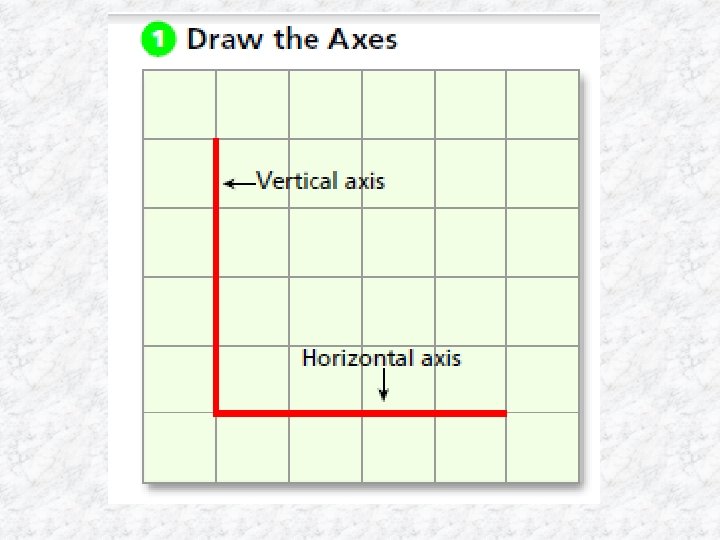
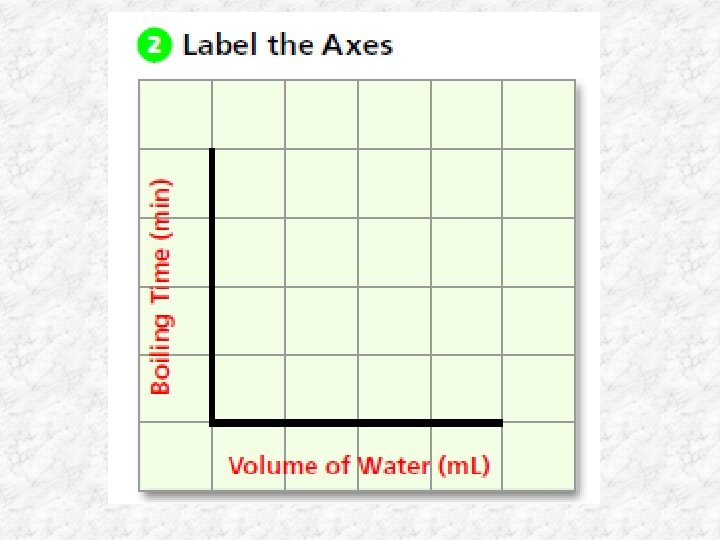
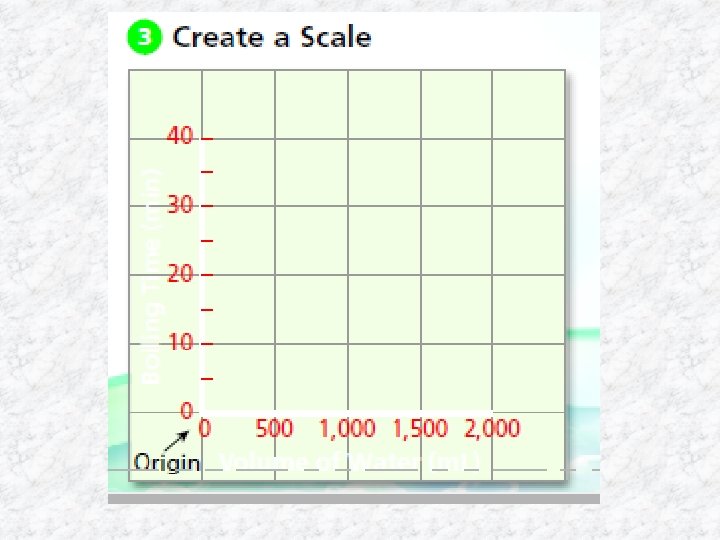
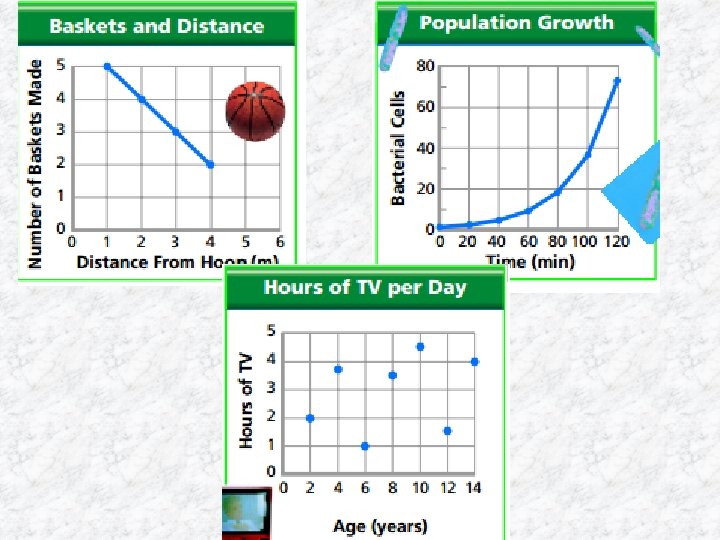
Graphing � � A graph is a useful tool that may help scientist interpret data by revealing unexpected patterns. Line graph – shows how the responding or dependent variable changes in response to the manipulated or independent variable. � The horizontal axis – runs left to right. � The vertical axis – runs up and down. � Includes a line of best fit – this shows the overall trend of data. � If a graph shows no identifiable trend then there is no relationship between the variables 11
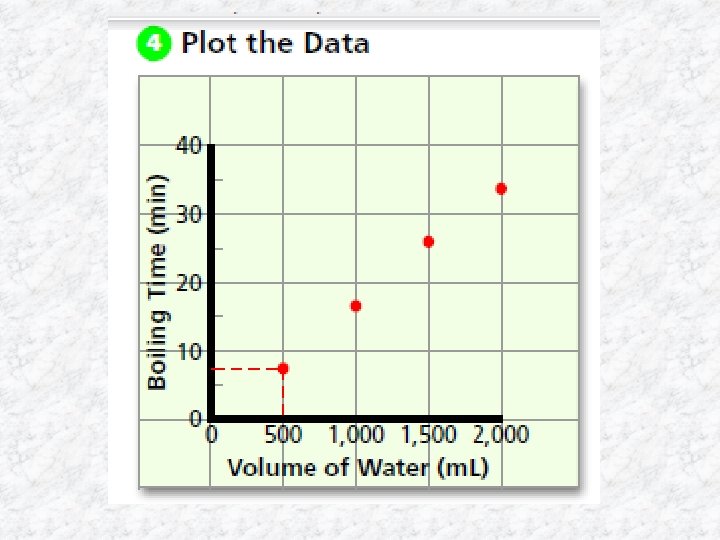
A line of best fit emphasizes the overall trend shown by all the data taken as a whole.
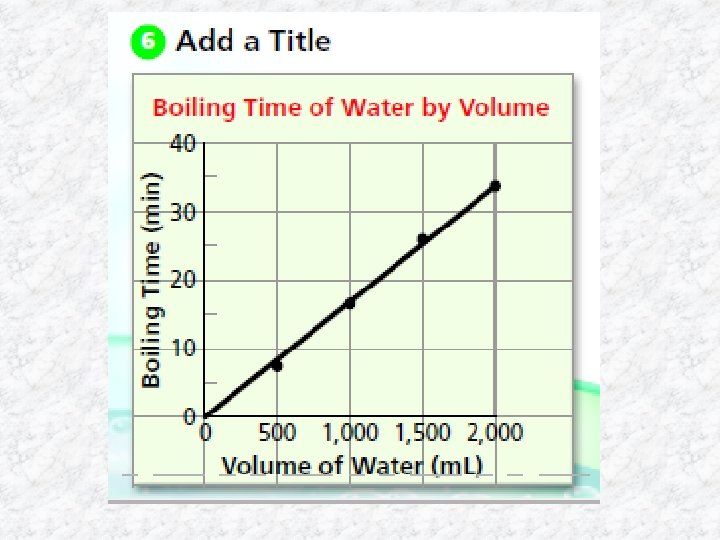
Trend Lines Linear Trends – A line graph in which the points fall on a straight line Nonlinear Trends – Points don’t fall on the line No Trend – Points are scattered
Safety in the Science Lab C B A
• Good preparation helps you stay safe when doing science activities in the lab. • Just as in the lab, good preparation helps you stay safe when doing science activities in the field • When an accident occurs, no matter how minor, notify your teacher immediately. Then, listen to your teacher’s directions and carry them out quickly.