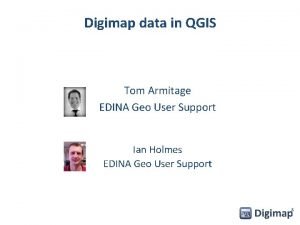
Digimap data in QGIS Tom Armitage EDINA Geo


- Slides: 49

Digimap data in QGIS Tom Armitage EDINA Geo User Support Ian Holmes EDINA Geo User Support

Content • • • What data is available? How do I use Data Download to get data for QGIS? What formats should I pick for using in QGIS? How do I load data into QGIS? How do I style my data? Tips: • Clipping smaller areas • Merging tiles • Plugins • Resources

Digimap Home Page

What data is available from Digimap? • Ordnance Survey (OS) – Full range of OS maps and data available including OS Master. Map and OS Open. Data • Historic – Detailed historic OS maps from 1843 -1990 s • Geology – Onshore and offshore geological datasets • Marine – Marine and coastal zone data • Environment – Land cover datasets • Aerial – Detailed aerial imagery • Lidar – High resolution Lidar data All data can be used in QGIS in one form or another! You might not have access to all data.

How do I download map data? • Data Download – download OS and other mapping data for use in QGIS

Using Data Download Three steps: 1. Select area 2. Choose data 3. Add to basket options to change format, version and layers

Data Download Click + or on category name to open and see available map data products: • OS Master. Map – most detailed topographic mapping of GB, with added Building Heights, Transport Network, Water Network & Sites data • Background Mapping – raster maps at range of scales, all in TIFF format • Land Height data – contours and Digital Terrain Models • Vector data – range of scales and formats • Boundary and Location data – administrative boundaries, postcode data, gazetteers • Withdrawn datasets

Availability Grid - Shows availability of different products - Shows Reference grids - Can select areas by Tile Names

Basket options • Select version, format and layers in the basket. • Options vary between map data products.

What formats should I use for QGIS? • • • Shapefile – for vector if available File Geodatabase – for vector if available (read only) GML (for OS Master. Map and VML) – if needed TIFF – for raster ASC (for DTM)

Shape file availability • Check the Information boxes. • Every product in Vector Data category available in Shape format. • The most up-to -date contours are also available as Shape.

OS Master. Map Topography • Recommend you take File Geodatabase for use in QGIS. Then save as a Geopackage or Shapefile. • Alternative: Take GML and convert to Shapefile using Interp. OSe or the Ordnance Survey Translator plugin. • Why would I convert GML? – Can limit the actual feature types you import – Can merge several orders together

Use Ordnance Survey Translator to process GML • Creates a shapefile • Can process multiple Chunks and Multiple Orders

Raster data formats TIFF • Raster data (backdrop mapping) all supplied in TIFF image format • Some TIFFs are supplied with a TFW file - a plain text World file • World Files contain the geographic coordinates, scale and rotation of TIFF map. ASC • DTM and Gridded Bathymetry data

Formats and conversion guidance http: //digimap. edina. ac. uk/webhelp/os/data_information/data_formats/new_data_translators. htm

Download zip file contents Within each zip file: • Folder for each map product • Contents text file • Citations text file You must extract the data from the zip file before using the data in QGIS: • Either use the Windows ‘built-in’ uncompress option “Extract All” available when you right click on the zip file • Or use software such as 7 -Zip or Win. Zip to extract the data from the zip file.

Getting QGIS Downloading QGIS • Available from www. qgis. org • Download page: http: //www. qgis. org/en/site/forusers/download. html • Windows 32 bit, Windows 64 bit, Mac and Linux versions • There are Long Term Releases (LTRs) and Latest Versions (LVs) • • LTRs are supported for 1 - 2 years Have good help material and bug fixes LVs have all the latest features They have bug fixes but not all the features are well documented or stable

Setting up QGIS Setting your CRS • If you are mostly use British Data then you can set the map to always start using British National Grid • Go to Settings Options • Enable ‘on the fly’ reprojection • The EPSG code is 27700

Setting up QGIS Saving the Map • Map documents are saved as QGS files • These save only the styling, zoom levels and other changes you have made but NOT the data itself. Adding a Favourite Folder • Right-Click on Favourites and browse to you data folder • Drag files in rather than add them using the buttons

Adding Data • Add data using the buttons down the side with the green plus Symbols. • Three key ones you need to know for Digimap data are: – Add Raster Data – Add Vector Data – Add CSV Data

Adding VMD Raster Data • Click on the Add Raster Button: • Browse to your data use Ctrl or Shft to select multiple raster tiles at one time

Adding Shapefile Data • Click on the add vector data button: • Click Browse and locate your shapefile • Click Open:

Adding File Geodatabase Data • The File Geodatabase format from EDINA can be opened in QGIS as well as Arc. GIS • Click Add Vector Layer: • Choose Directory as the Source Type • Pick Open. File. GDB • Browse to. gdb file • Click Open

Adding File Geodatabase Data

Adding CSV Data • Click on the add csv data button: • Click Browse and locate your csv data • Select the columns that contain spatial data:

Adding CSV Data • The points will be displayed on the map:

Styling Vector Data in QGIS • Vector data (e. g. OS Master. Map, OS Vector. Map Local) will not have the same appearance as it does in Digimap, when viewed in QGIS • May want to consider styling the data to emphasise certain things on the map, or to try and match the OS cartographic style

Styling options In QGIS – do this in Style tab of map layer properties: You can apply your own style to all features or base a scheme on categories or values in the attribute data.

Styling options In the latest versions of QGIS you can open a live styling dock next to your map There are some great advanced features and styles to look at:

2. 5 D maps

Heatmap • Adds the ability to view datasets as a heatmap • Select it from the Style tab, this is postcodes weighted by domestic delivery points

Hillshade Adds the ability to view DTM data as a hillshade layer very quickly and easily

Blend Modes • Mixes the colours between layers without the washed out effect of transparency

Draw Effects • Outer Glows, Inner Glows Blurs and tints.

Style files • Digimap provides style files for some vector data products • Look on the product information page • Click More Info on the Data Download Information box • Some products have the Symbology file in the download zip

Common Geoprocessing Tools • Merge Vector Tiles • Merge Raster Tiles • Clip

Vector data – Merge tool • Where your download area covers multiple tiles, possible to merge the tiles into one Image: OS Terrain contours before merging (SE England)

Raster data – Merge tool

Clip tool • Where tiles are provided in large sizes e. g. 100 x 100 km, possible to clip them to smaller area • To use the vector clip tool, necessary to have a file of the smaller area to use as the guide

Plugins • QGIS has extended functionality through its Plugins • They are accessed from the plugin menu • Here are some of our favourites:

Web Basemaps • Quick Map Services. – Really quick maps to download, huge number of layers to choose from. Can be a little unreliable • Open. Layers Plugin: – Very stable, smaller choice, some tiles don’t arrive

MMQGIS • Many different features to explore but we like the create grid layer, great for creating hexagons:

QGIS 2 Three. JS • Adds the ability to create a 3 D scene from your data • It is relatively easy to set up

QGIS 2 Three. JS • This opens in a web browser so can be shared easily

More Plugins • QGIS 2 Web – Takes your map and creates a webmap using either leaflet or Open. Layers. – Remember not to publish licenced data on a public website! • Cartogram – Create Cartograms from your data • Terrain Analysis • Zonal Statistics

Resources • Digimap Resource centre – access help pages, guides, FAQs, videos, case studies and more.

Help pages Digimap Resource centre: http: //digimap. edina. ac. uk/webhelp/resources/index. html

PDF exercises • Exercises available for download • PDF step by step • Some with data provided

Chat • Usually manned in office hours.
 Digimap edina
 Digimap.edina.ac.uk
 Building heights digimap
 Digimapsforschools
 Digimap
 Kartodiagram qgis
 Qgis gml
 Topotijdreis qgis
 Qgis pivot table
 Qgis
Qgis Qgis fantasy map
 Go 910
 Symbols in the devil and tom walker
 Radost od boga edina
 Dr farkas edina gyermekpszichiáter
 Edina lacrosse
 Edina girls lacrosse
 Edina football
 Edina sinanovic
 Edina alpine ski team
 Edina youth baseball
 Edina moodle
 Edina sudzuka
 Edina timb
 Jonas
Jonas Edina flag football
 Tb kutis
 Emin efendira
 Edina timb
 The manhunt simon armitage
 Simon armitage you're beautiful
 Sun stunned sand smothered land
 Remains simon armitage
 Armitage metasploit
 My father thought it simon armitage
 Kid simon armitage
 Hitcher by simon armitage
 Give poem
 Armitage kullanımı
 Poem deconstruction example
 Disk structure
 Simon armitage the clown punk
 Armitage metasploit
 Suman armitage
 Remains definition
 Metasploit
 Kali armitage
 The manhunt by simon armitage
 Armitage
 My father thought it bloody queer analysis

