
Using QGIS to process raster images Robert Catherman
Using QGIS to process raster images Robert Catherman
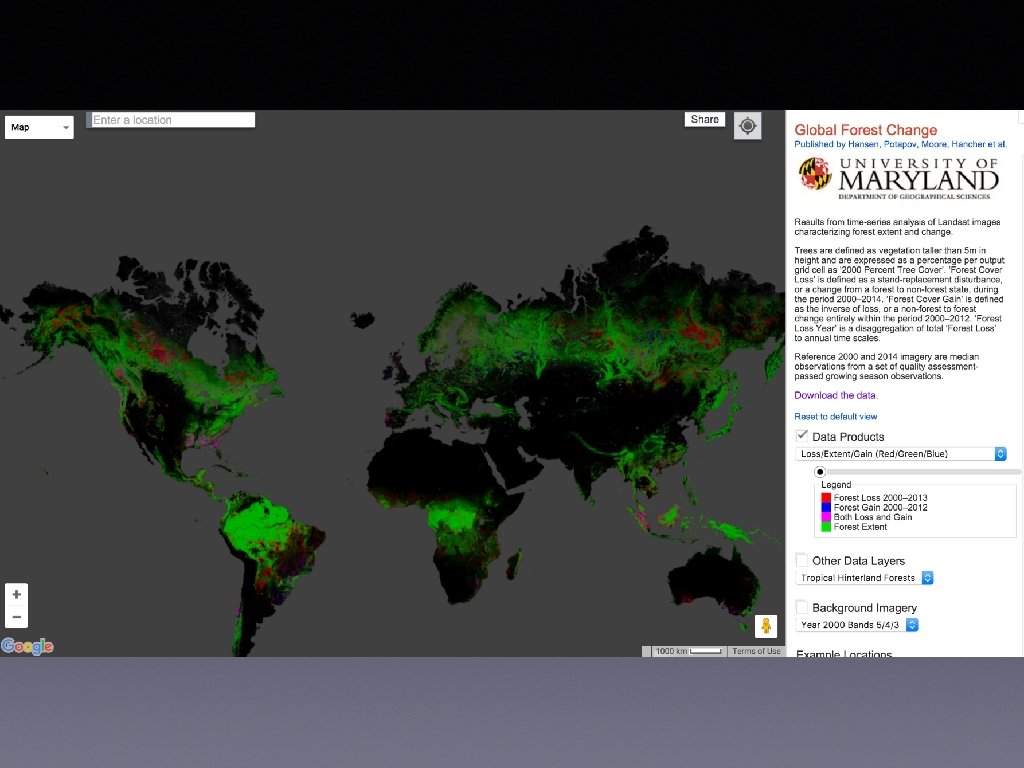
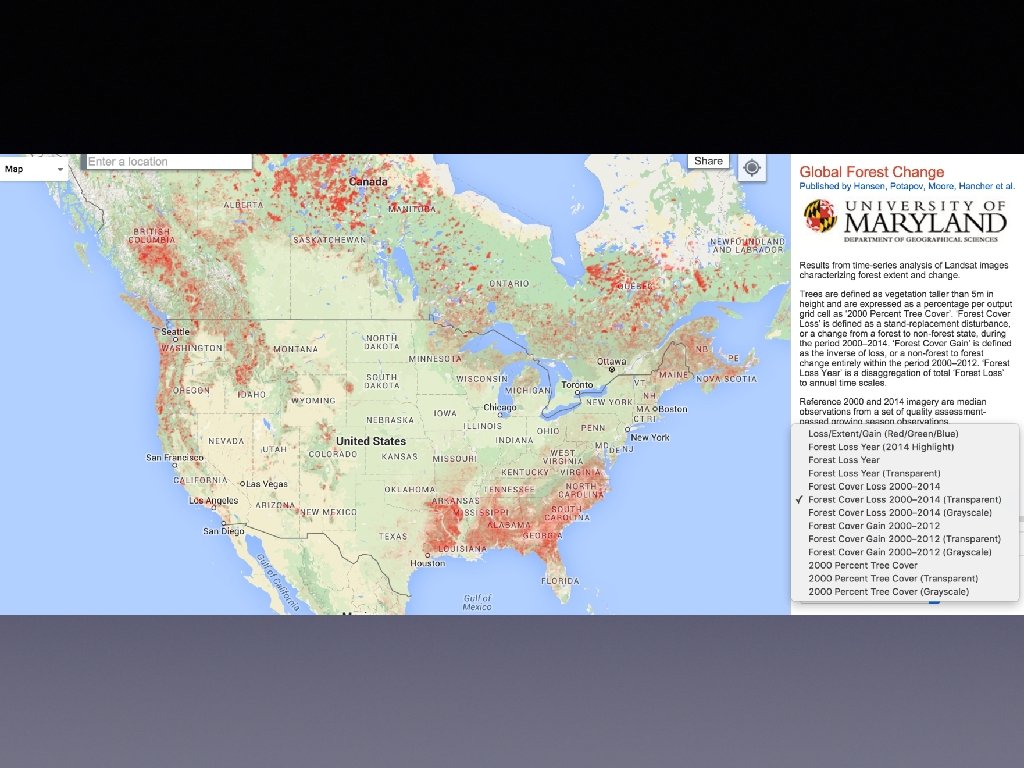
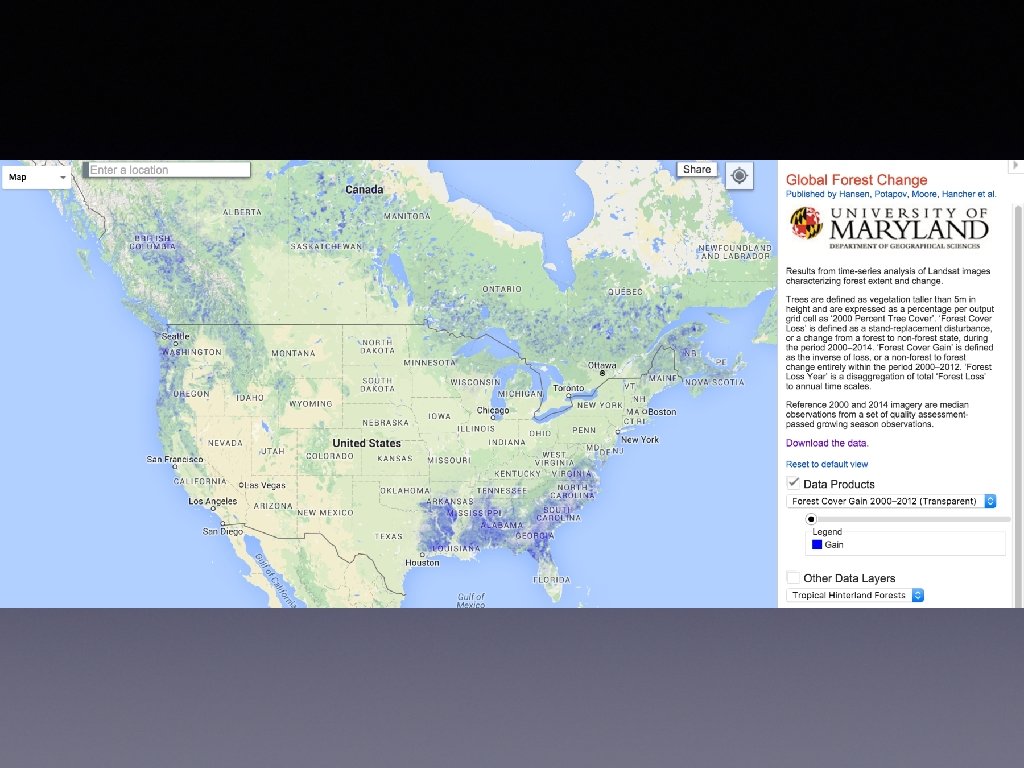
Global Forest Change • University of Maryland project • Question: what areas globally have gained or lost forest coverage between 2000 and 2013? • Resources: several UM professors, assisted by USGS, processed on Google server farm, assisted by Ph. D candidate students of UM • http: //earthenginepartners. appspot. com/science-2013 global-forest
My project • Goal: Replicate the analysis processes of UM • choose a small study area • define the workflow to process Landsat images • execute the workflow • compare the results
Resources • Landsat images - downloaded • one average GIS practitioner (me) • one undergrad UW student assistant • QGIS open source software • Windows laptop
Study Area • Redmond, WA neighborhood where forest had been cut down and houses built
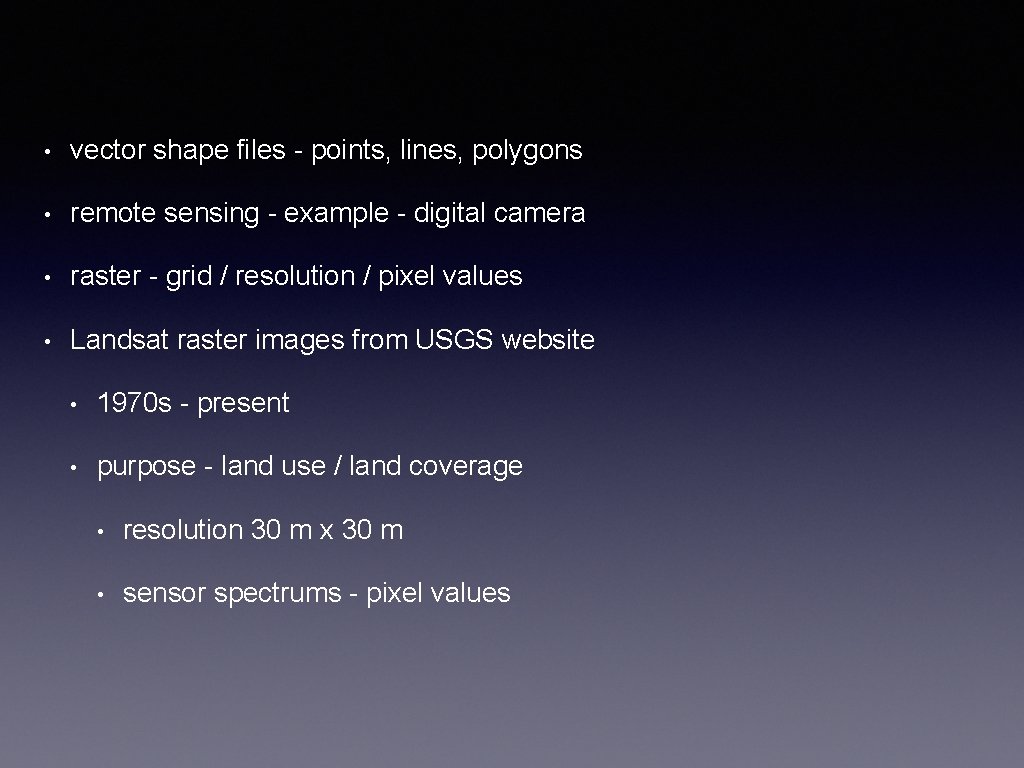
• vector shape files - points, lines, polygons • remote sensing - example - digital camera • raster - grid / resolution / pixel values • Landsat raster images from USGS website • 1970 s - present • purpose - land use / land coverage • resolution 30 m x 30 m • sensor spectrums - pixel values
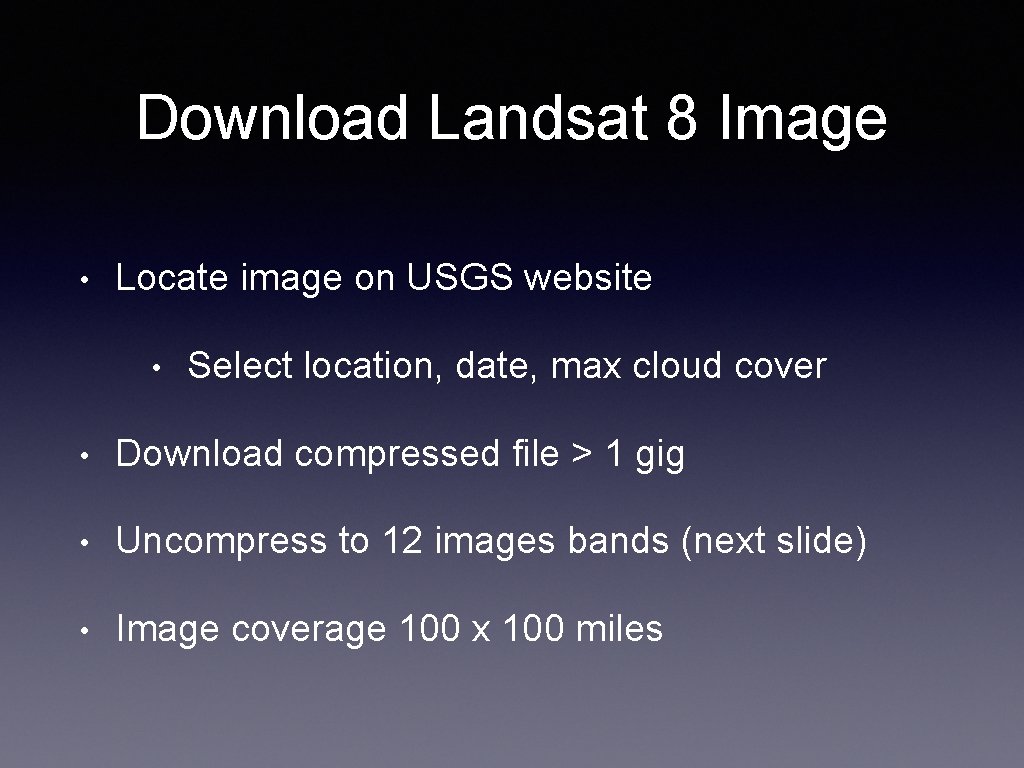
Download Landsat 8 Image • Locate image on USGS website • Select location, date, max cloud cover • Download compressed file > 1 gig • Uncompress to 12 images bands (next slide) • Image coverage 100 x 100 miles
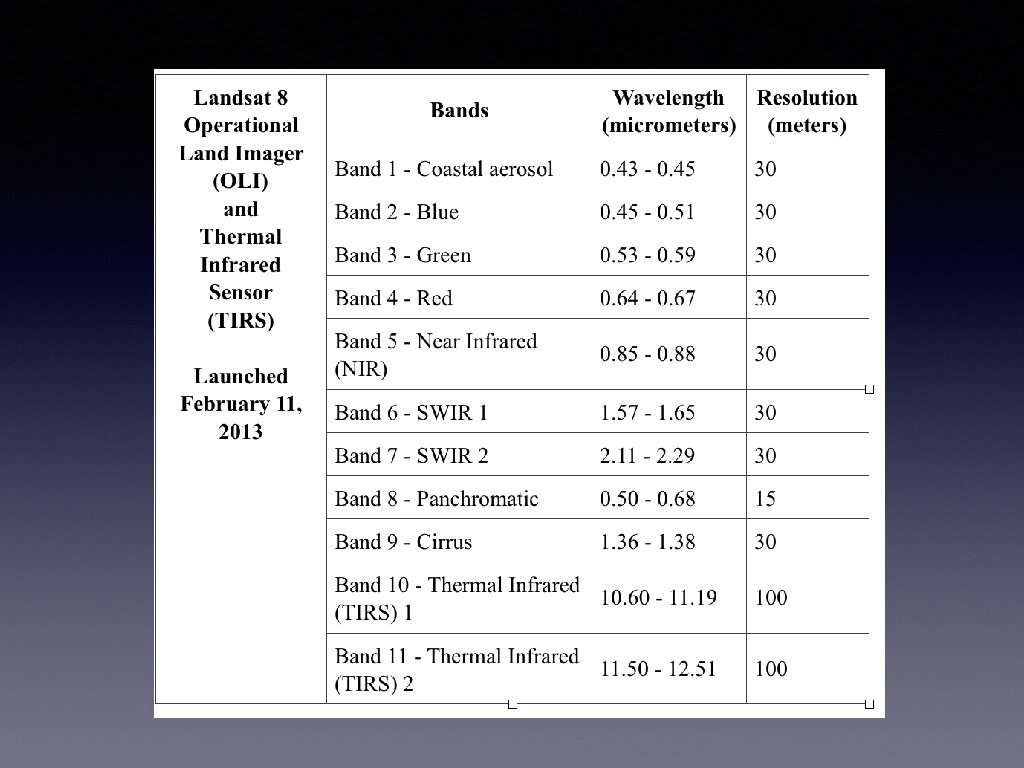
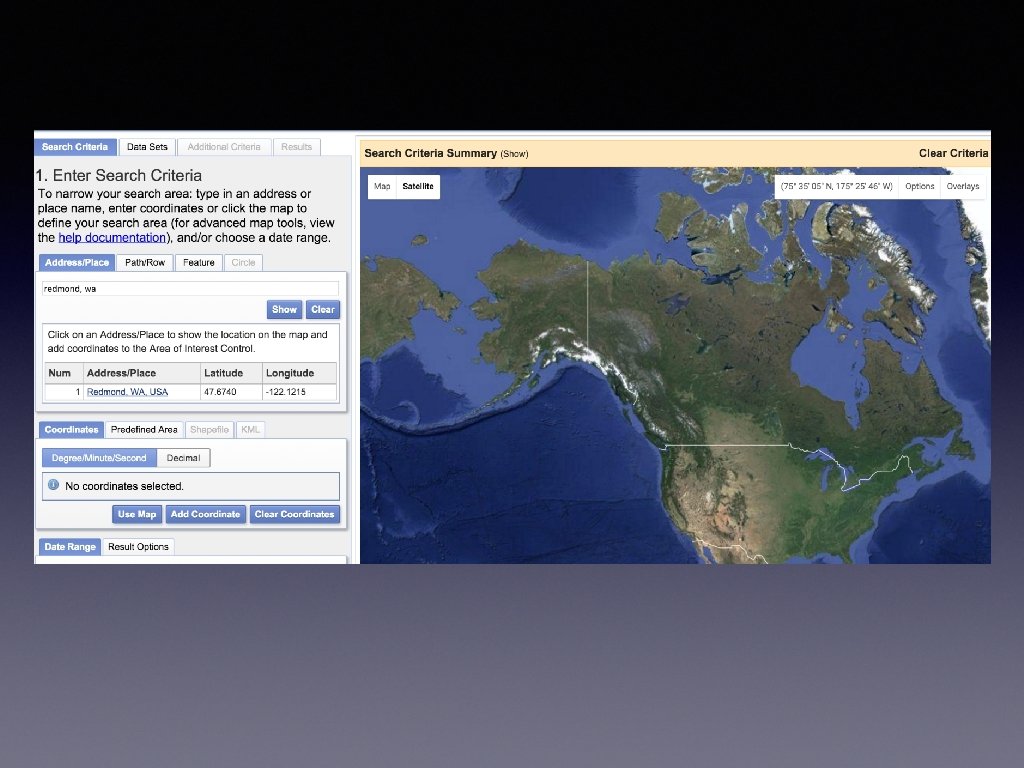
http: //earthexplorer. usgs. gov/
Load rasters into QGIS • Landsat 7 - bands 3 and 4 • Landsat 8 - bands 4 and 5 • Crop rasters using KML study area • Cleanup
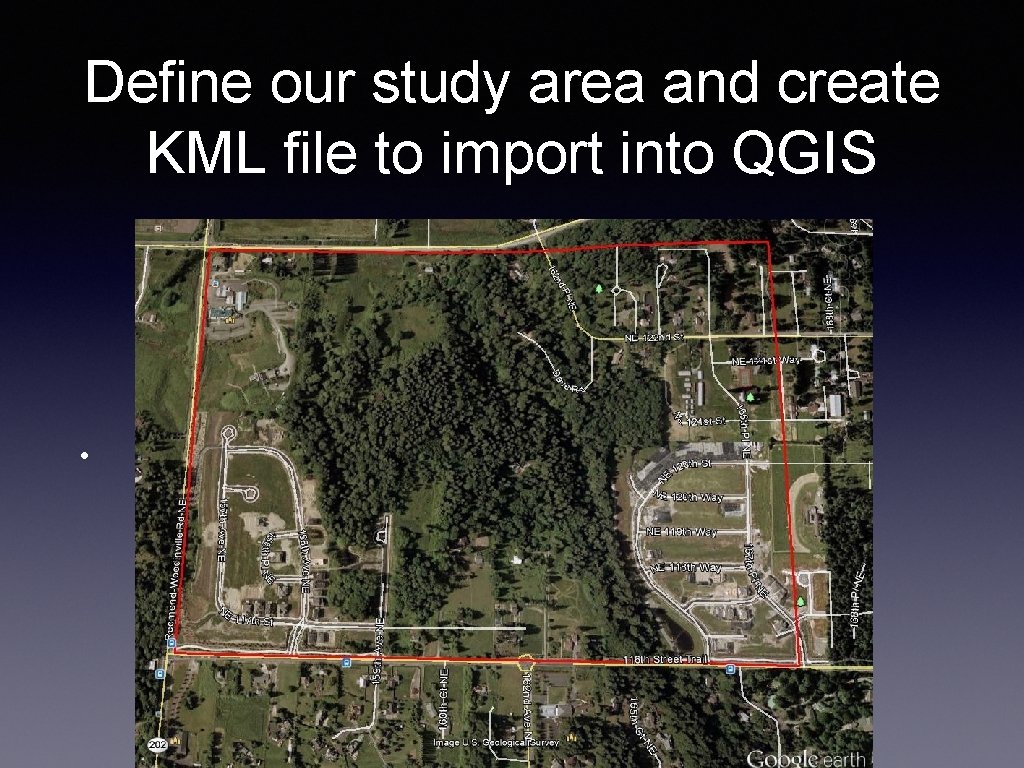
Define our study area and create KML file to import into QGIS •
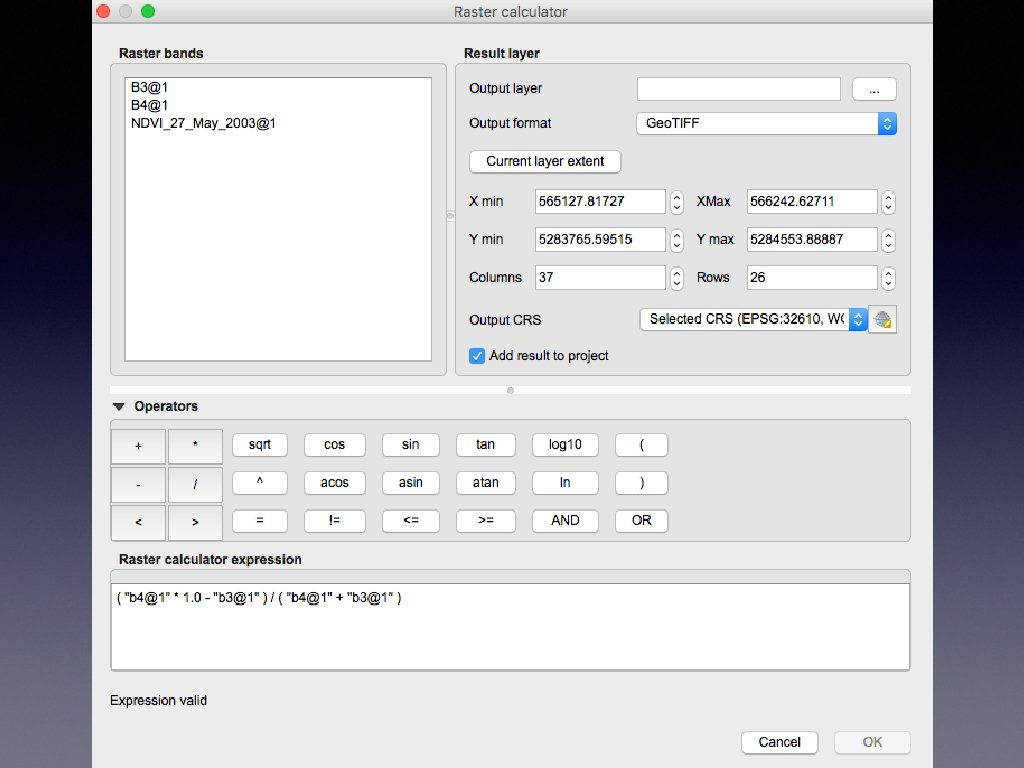
Normalized Difference Vegetation Index images from Landsat satellites • Channel 3 is in the visible red-light region • chlorophyll absorbs incoming sunlight. • Channel 4 is in the near-infrared region • plant's spongy mesophyll leaf structure creates con As a result, vigorously growing healthy vegetation has low re
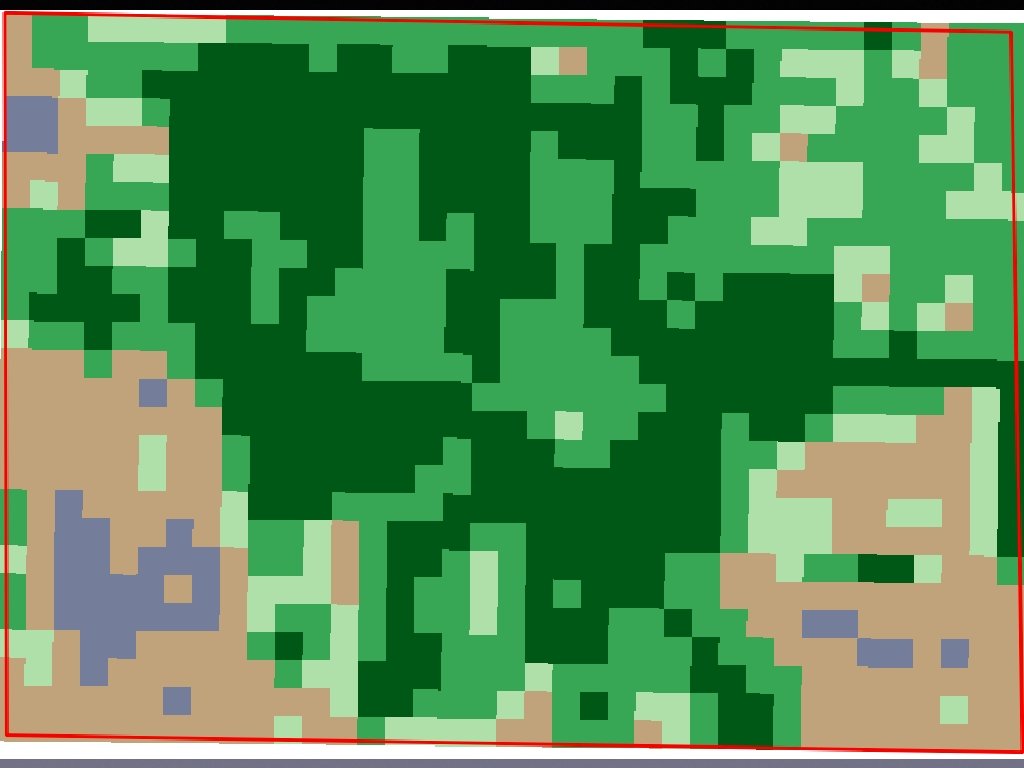
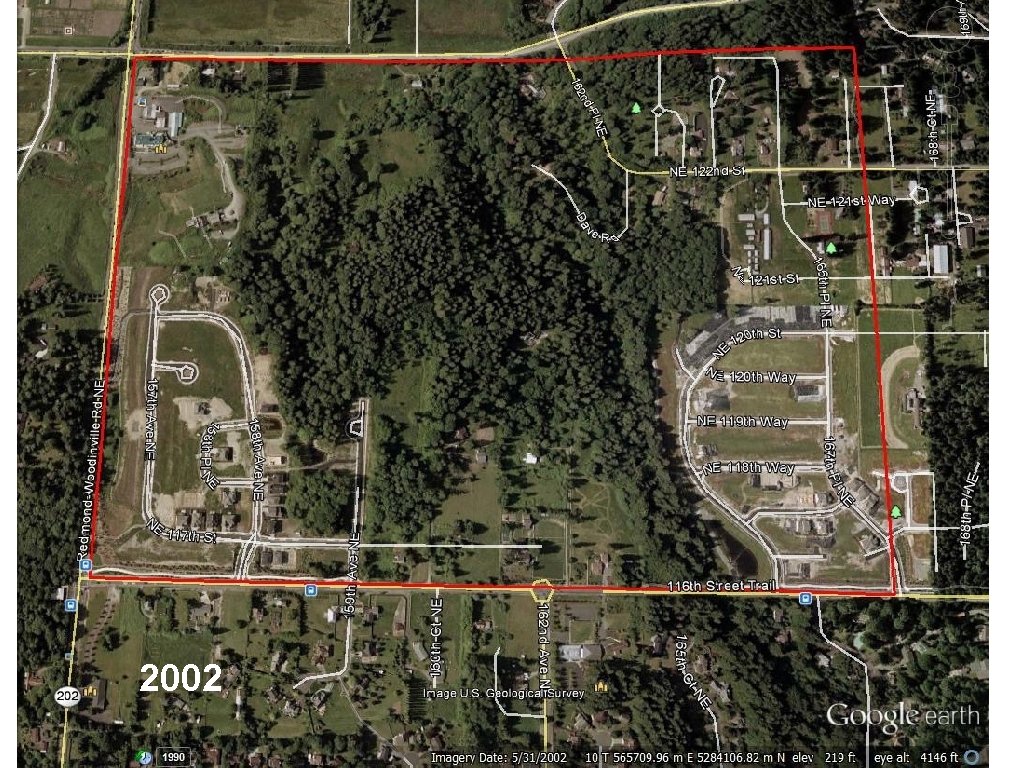
2002
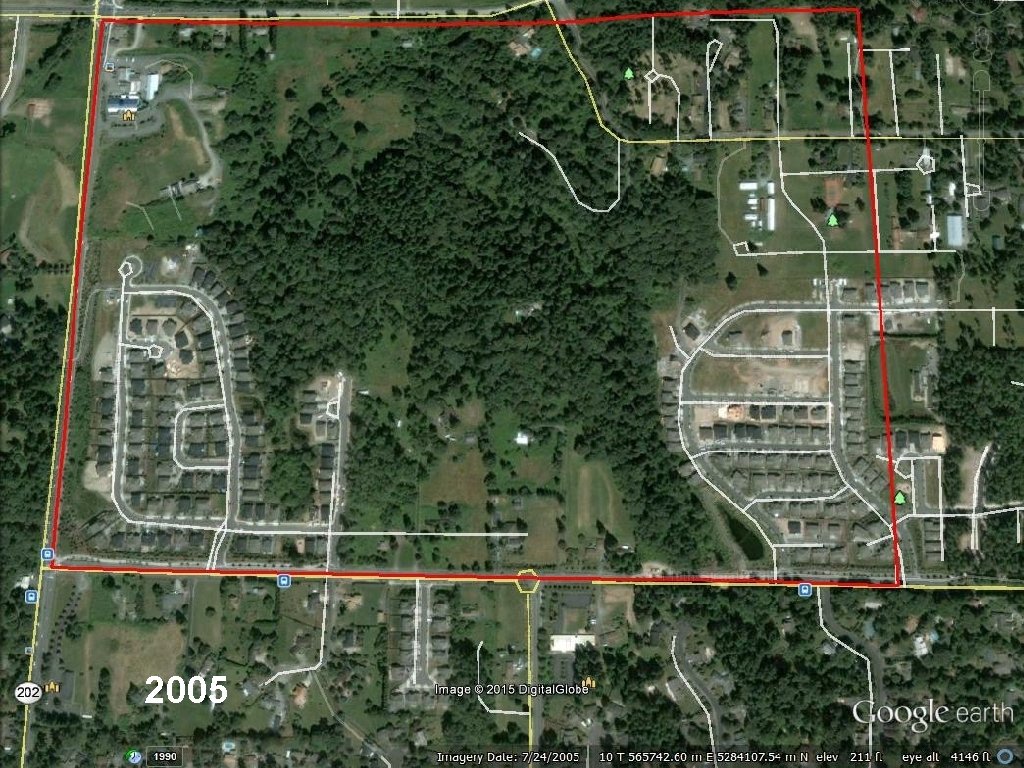
2005
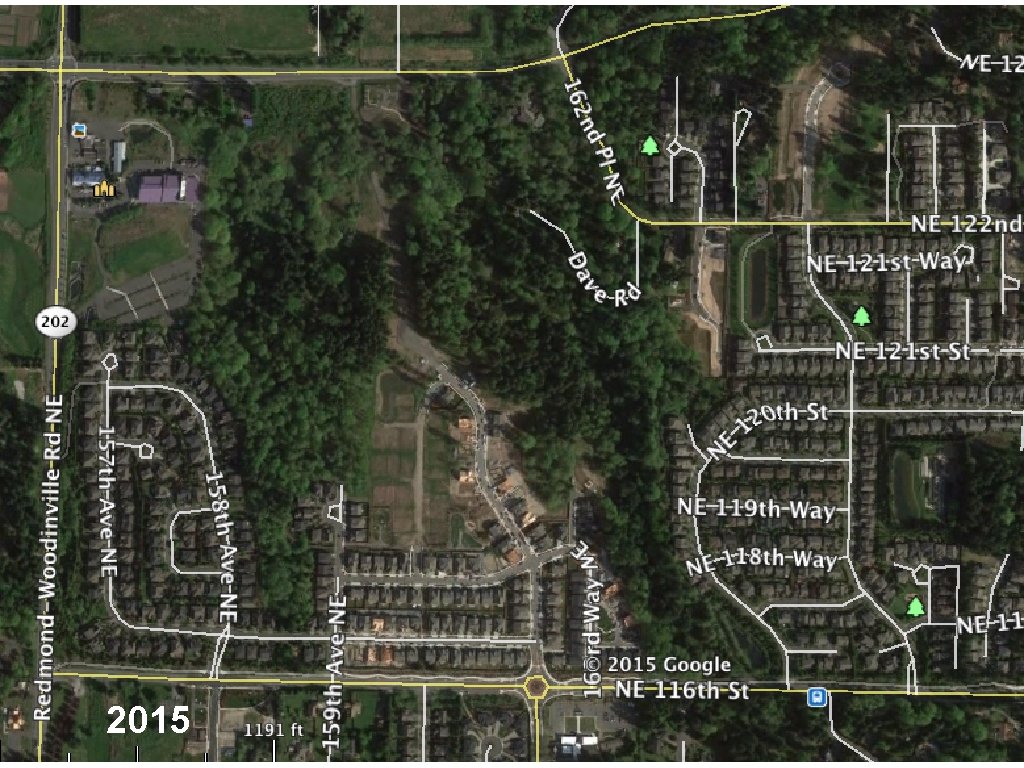
2015
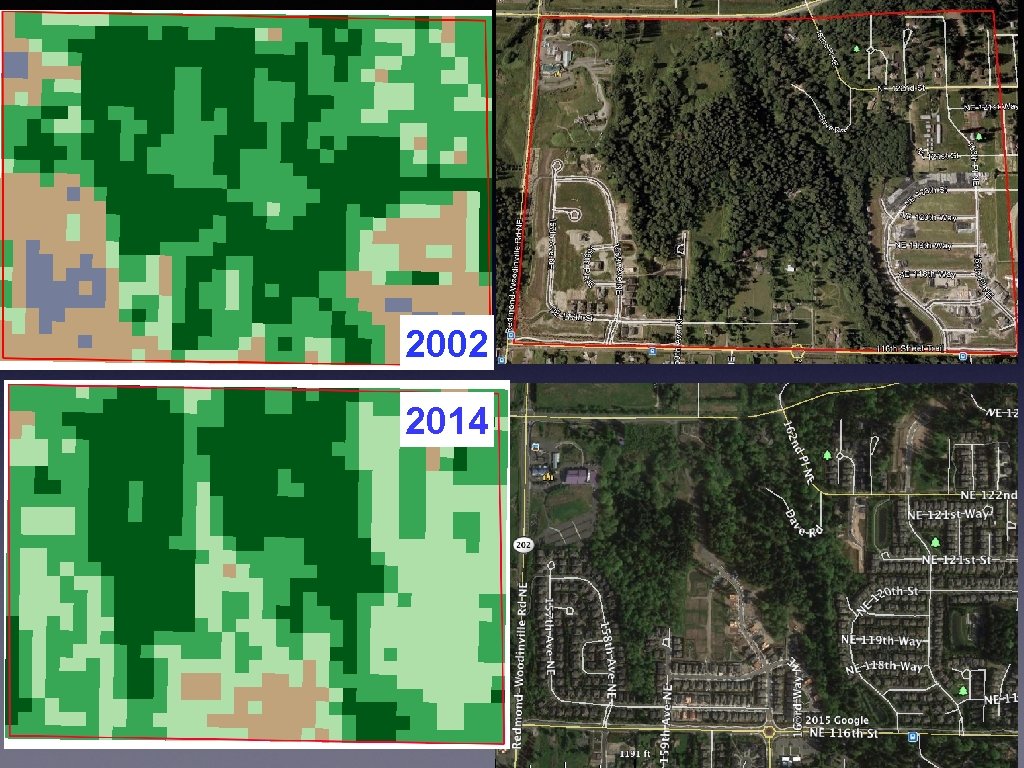
2002 2014
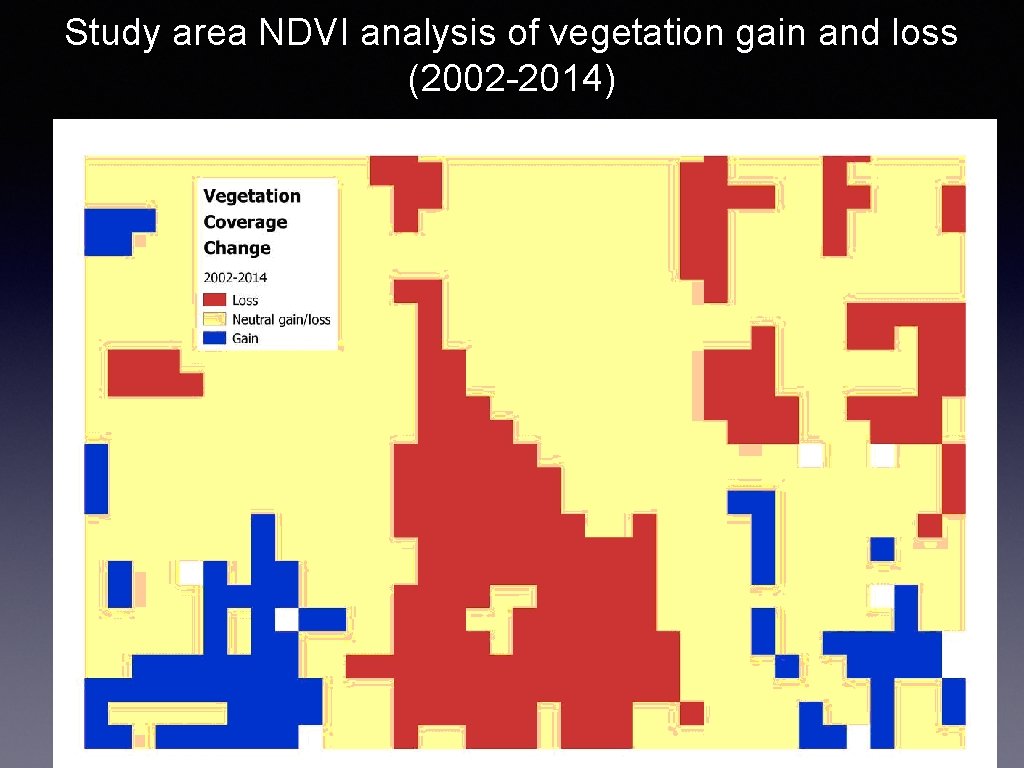
Study area NDVI analysis of vegetation gain and loss (2002 -2014)
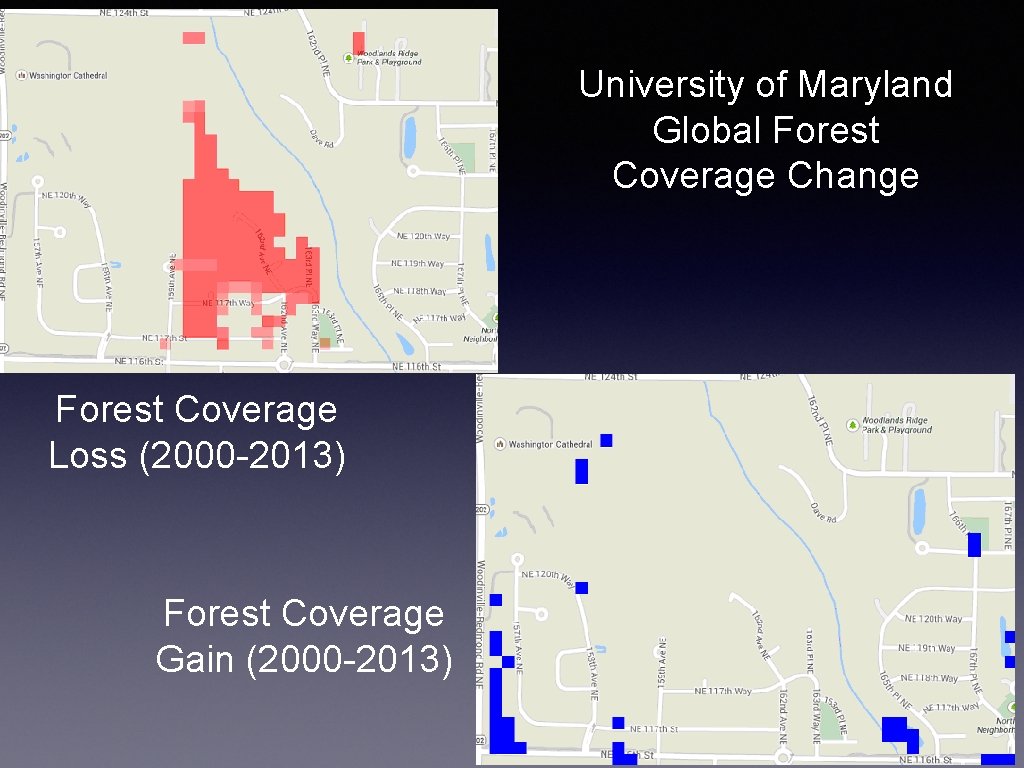
University of Maryland Global Forest Coverage Change Forest Coverage Loss (2000 -2013) Forest Coverage Gain (2000 -2013)
Interpretation : ood agreement between our shape and area of coverage of “loss”. There is les 2000 -2013 and we used a date range of 2002 -2014. A second reason for a var
- Slides: 24