Data warehouses generalize and consolidate data in multidimensional


: Pivot (also called rotate) is")
- Slides: 54
Data warehouses generalize and consolidate data in multidimensional space. The construction of data warehouses involves data cleaning, data integration, and data transformation. It can be viewed as an important preprocessing step for data mining. It provide on-line analytical processing (OLAP) tools for the interactive analysis of multidimensional data of varied granularities. This facilitate effective data generalization and data mining.
Why Data warehouses ? Many other data mining functions, such as association, classification, prediction, and clustering, can be integrated with OLAP operations. This will enhance interactive mining of knowledge at multiple levels of abstraction. Hence, the data warehouse has become an increasingly important platform for data analysis and on-line analytical processing and provides an effective platform for data mining. Therefore, data warehousing and OLAP form an essential step in the knowledge discovery process.
Data warehouses Data warehouse refers to a database that is maintained separately from an organization’s operational databases. “A data warehouse is a subject-oriented, integrated, time-variant, and nonvolatile collection of data in support of management’s decision making process” --William H. Inmon, a leading architect Subject-oriented: A data warehouse is organized around major subjects, such as customer, supplier, product, and sales. It provide a simple and concise view around particular subject issues by excluding data that are not useful in the decision support process.
Data warehouses A data warehouse is a subject-oriented, integrated, time-variant, and nonvolatile collection of data in support of management’s decision making process” --William H. Inmon, a leading architect Integrated: A data warehouse is usually constructed by integrating multiple heterogeneous sources, such as relational databases, flat files, and on-line transaction records. Data cleaning and data integration techniques are applied to ensure consistency in naming conventions, encoding structures, attribute measures, and so on.
Data warehouses A data warehouse is a subject-oriented, integrated, time-variant, and nonvolatile collection of data in support of management’s decision making process” --William H. Inmon, a leading architect Time-variant: Data are stored to provide information from a historical perspective (e. g. , the past 5– 10 years). Every key structure in the data warehouse contains, either implicitly or explicitly, an element of time.
Data warehouses A data warehouse is a subject-oriented, integrated, time-variant, and nonvolatile collection of data in support of management’s decision making process” --William H. Inmon, a leading architect Non-volatile: A data warehouse is always a physically separate store of data transformed from the application data found in the operational environment. Due to this separation, a data warehouse does not require transaction processing, recovery, and concurrency control mechanisms. It usually requires only two operations in data accessing: initial loading of data and access of data.
Data warehouses A data warehouse : - • A semantically consistent data store • Serves as a physical implementation of a decision support data model • Stores the information on which an enterprise needs to make strategic decisions. A data warehouse is also often viewed as an architecture, constructed by integrating data from multiple heterogeneous sources. It supports analytical reporting, and decision making. Data warehousing is the process of constructing and using data warehouses. The construction requires data cleaning, data integration, and data consolidation.
Data warehouses Many organizations use this information to support business decision-making activities: Increasing customer focus, which includes the analysis of customer buying patterns (such as buying preference, buying time, budget cycles, and appetites for spending) Repositioning products and managing product portfolios by comparing the performance of sales by quarter, by year, and by geographic regions in order to finetune production strategies; Analyzing operations and looking for sources of profit; Managing the customer relationships, making environmental corrections, and managing the cost of corporate assets.
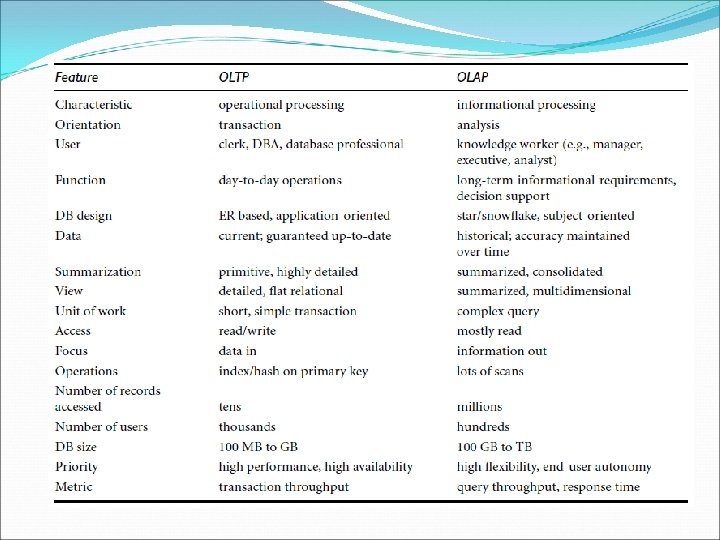
Operational Database Systems V/S Data Warehouses The major task of on-line operational database systems is to perform On-line Transaction and query Processing (OLTP Systems). They cover most of the day-to-day operations of an organization: purchasing, inventory, manufacturing, banking, payroll, registration, and accounting. Data warehouse systems, on the other hand, serve users or knowledge workers in the role of data analysis and decision making. They organize and present data in various formats in order to accommodate the diverse needs of the different users (OLAP Systems).
Operational Database Systems V/S Data Warehouses Users and system orientation: An OLTP system is customer-oriented and is used for transaction and query processing by clerks, clients, and information technology professionals. An OLAP system is market-oriented and is used for data analysis by knowledge workers, including managers, executives, and analysts. Data contents: An OLTP system manages current data that, typically, are too detailed to be easily used for decision making. An OLAP system manages large amounts of historical data. Provides facilities for summarization and aggregation, and stores-and-manages information at different levels of granularity. These features make the data easier to use in decision making.
Operational Database Systems V/S Data Warehouses Database design: An OLTP system usually adopts an entity-relationship (ER) data model and an application-oriented database design. An OLAP system typically adopts either a star or snowflake model and a subject oriented database design. View: An OLTP system focuses mainly on the current data within an enterprise or department, without referring to historical data or data in different organizations. In contrast, an OLAP system often spans multiple versions of a database schema, due to the evolutionary process of an organization. OLAP systems also deal with information that originates from different organizations, integrating information from many data stores. Because of their huge volume, OLAP data are stored on multiple storage media.
Operational Database Systems V/S Data Warehouses Access patterns: The access patterns of an OLTP system consist mainly of short, atomic transactions. Such a system requires concurrency control and recovery mechanisms. However, accesses to OLAP systems are mostly read-only operations.
But, Why Have a Separate Data Warehouse? A major reason for a separation is to help promote the high performance of both systems. An operational database is designed and tuned from known tasks and workload. indexing and hashing using primary keys, searching for particular records, and optimizing “canned” queries. Data warehouse queries are often complex. They involve the computation of large groups of data at summarized levels. They may require the use of special data organization, access, and implementation methods based on multidimensional views. Processing OLAP queries in operational databases would substantially degrade the performance of operational tasks.
But, Why Have a Separate Data Warehouse? An operational database supports the concurrent processing of multiple transactions. Concurrency control and recovery mechanisms, such as locking and logging, are required to ensure the consistency and robustness of transactions. An OLAP query often needs read-only access of data records for summarization and aggregation. Concurrency control and recovery mechanisms, if applied for such OLAP operations, may jeopardize the execution of concurrent transactions Thus substantially reduce throughput of an OLTP system.
But, Why Have a Separate Data Warehouse? The data in operational databases, though abundant, is usually far from complete for decision making. Decision support requires consolidation (such as aggregation and summarization) of data from heterogeneous sources, resulting in high-quality, clean, and integrated data. In contrast, operational databases contain only detailed raw data, such as transactions, which need to be consolidated before analysis. Because the two systems provide quite different functionalities and require different kinds of data, it is presently necessary to maintain separate databases.
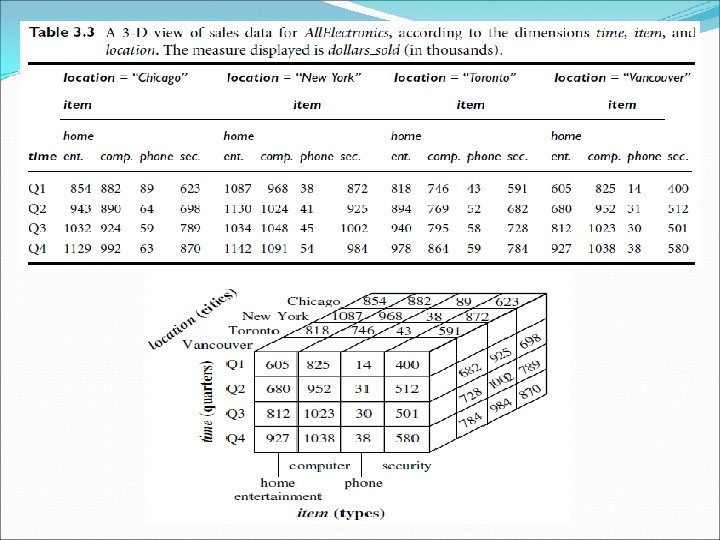
A Multidimensional Data Model Data warehouses and OLAP tools are based on a multidimensional data model. This model views data in the form of a data cube. A data cube allows data to be modelled and viewed in multiple dimensions. It is defined by dimensions and facts. Dimensions are the perspectives or entities with respect to which an organization wants to keep records. For example, All. Electronics may create a sales data warehouse in order to keep records of the store’s sales with respect to the dimensions time, item, branch, and location.
A Multidimensional Data Model Each dimension may have a table associated with it, called a dimension table, which further describes the dimension. A dimension table for item may contain the attributes item name, brand, and type. Dimension tables can be specified by users or experts, or automatically generated and adjusted based on data distributions. A multidimensional data model is typically organized around a central theme, like sales, for instance. This theme is represented by a fact table. Facts are numerical measures and can be treated as quantities by which we want to analyse relationships between dimensions.
A Multidimensional Data Model Examples of facts for a sales data warehouse include dollars sold (sales amount in dollars), units sold (number of units sold). The fact table contains the names of the facts, or measures, as well as keys to each of the related dimension tables. a simple 2 -D data of All. Electronics sales data for items sold per quarter in the city of Vancouver.
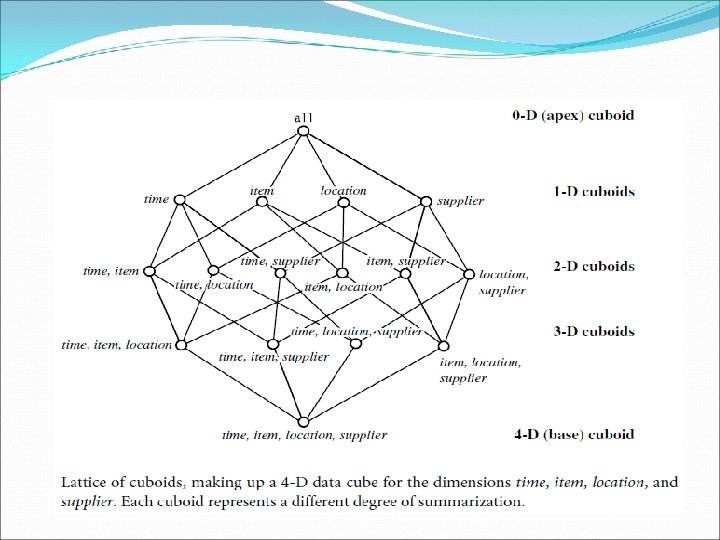
A Multidimensional Data Model Given a set of dimensions, we can generate a cuboid for each of the possible subsets of the given dimensions. The result would form a lattice of cuboids, each showing the data at a different level of summarization, or group by. The lattice of cuboids is then referred to as a data cube. The cuboid that holds the lowest level of summarization is called the base cuboid. Cuboid, which holds the highest level of summarization, is called the apex cuboid. In our example, this is the total sales, or dollars sold, summarized over all four dimensions.
Stars, Snowflakes, and Fact Constellations: Schemas for Multidimensional Databases A data warehouse, requires a concise, subject-oriented schema that facilitates online data analysis. The most popular data model for a data warehouse is a multidimensional model. Such a model can exist in the form of a star schema, a snowflake schema, or a fact constellation schema.
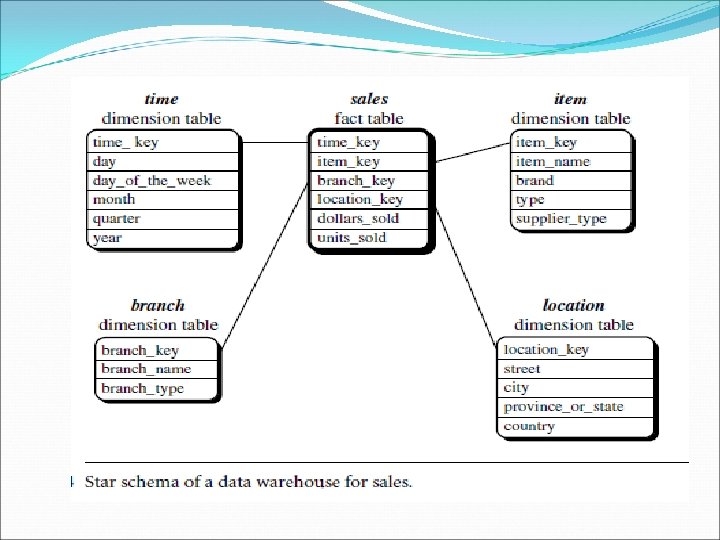
Stars, Snowflakes, and Fact Constellations: Schemas for Multidimensional Databases Star schema: The most common modelling paradigm is the star schema, in which the data warehouse contains A large central table (fact table) containing the bulk of the data, with no redundancy. a set of smaller attendant tables (dimension tables), one for each dimension. The schema graph resembles a starburst, with the dimension tables displayed in a radial pattern around the central fact table.
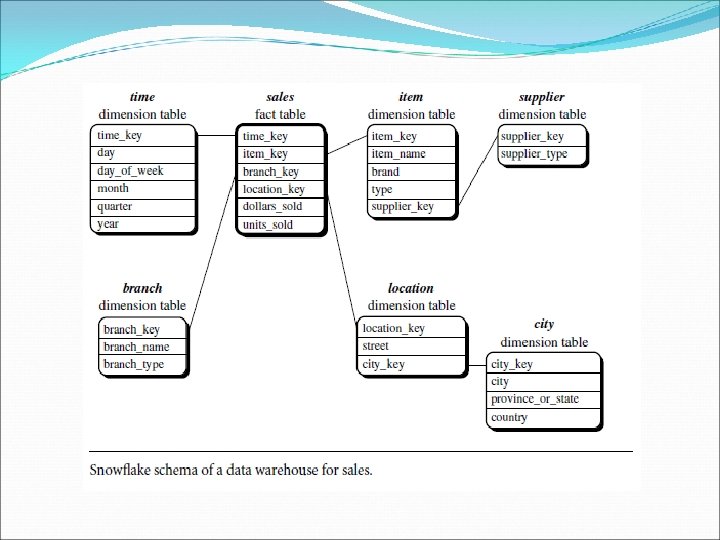
Stars, Snowflakes, and Fact Constellations: Schemas for Multidimensional Databases The snowflake schema is a variant of the star schema model. Some dimension tables are normalized, thereby further splitting the data into additional tables. The major difference between the snowflake and star schema models is that the dimension tables of the snowflake model may be kept in normalized form to reduce redundancies. The snowflake structure can reduce the effectiveness of browsing, since more joins will be needed to execute a query. Consequently, the system performance may be adversely impacted.
Fact constellation: Some applications may require multiple fact tables to share dimension tables. This kind of schema can be viewed as a collection of stars, and hence is called a galaxy schema or a fact constellation.
Stars, Snowflakes, and Fact Constellations: Schemas for Multidimensional Databases In data warehousing, there is a distinction between a data warehouse and a data mart. A data warehouse collects information about subjects that span the entire organization, such as customers, items, sales, assets, and personnel, and thus its scope is enterprise-wide. For data warehouses, the fact constellation schema is commonly used, since it can model multiple, interrelated subjects. A data mart, on the other hand, is a department subset of the data warehouse that focuses on selected subjects, and thus its scope is department wide. For data marts, the star or snowflake schema are commonly used, since both are geared toward modelling single subjects.
Examples for Defining Star, Snowflake, and Fact Constellation Schemas A data mining query language can be used to specify data mining tasks. Data warehouses and data marts can be defined using two language primitives. The cube definition statement has the following syntax: define cube <cube name> [<dimension list>]: <measure list> The dimension definition statement has the following syntax: define dimension <dimension name> as (<attribute or dimension list>)
Examples for Defining Star, Snowflake, and Fact Constellation Schemas Star schema definition using DMQL as follows: define cube sales star [time, item, branch, location]: dollars sold = sum(sales in dollars), units sold = count(*) define dimension time as (time key, day of week, month, quarter, year) define dimension item as (item key, item name, brand, type, supplier type) define dimension branch as (branch key, branch name, branch type) define dimension location as (location key, street, city, province or state, country)
Examples for Defining Star, Snowflake, and Fact Constellation Schemas Snowflake schema definition using defined in DMQL as follows: define cube sales snowflake [time, item, branch, location]: dollars sold = sum(sales in dollars), units sold = count(*) define dimension time as (time key, day of week, month, quarter, year) define dimension item as (item key, item name, brand, type, supplier (supplier key, supplier type)) define dimension branch as (branch key, branch name, branch type) define dimension location as (location key, street, city (city key, city, province or state, country))
Examples for Defining Star, Snowflake, and Fact Constellation Schemas Fact constellation schema definition using DMQL as follows: define cube sales [time, item, branch, location]: dollars sold = sum(sales in dollars), units sold = count(*) define dimension time as (time key, day of week, month, quarter, year) define dimension item as (item key, item name, brand, type, supplier type) define dimension branch as (branch key, branch name, branch type) define dimension location as (location key, street, city, province or state, country)
Examples for Defining Star, Snowflake, and Fact Constellation Schemas Fact constellation schema definition using DMQL as follows: define cube shipping [time, item, shipper, from location, to location]: dollars cost = sum(cost in dollars), units shipped = count(*) define dimension time as time in cube sales define dimension item as item in cube sales define dimension shipper as (shipper key, shipper name, location as location in cube sales, shipper type) define dimension from location as location in cube sales define dimension to location as location in cube sales
Measures: Their Categorization and Computation Measures can be organized into three categories distributive, algebraic, holistic based on the kind of aggregate functions used. Distributive: An aggregate function is distributive if it can be computed in a distributed manner as follows: Suppose the data are partitioned into n sets. We apply the function to each partition, resulting in n aggregate values. If the result derived by applying the function to the n aggregate values is the same as that derived by applying the function to the entire data set the function can be computed in a distributed manner. For example, count() , sum(), min(), and max()
Measures: Their Categorization and Computation Algebraic: An aggregate function is algebraic if it can be computed by an algebraic function with M arguments each of which is obtained by applying a distributive aggregate function. For example, avg() (average) can be computed by sum()/count(), where both sum() and count() are distributive aggregate functions. Similarly, it can be shown that min_N() and max_N() and standard_deviation() are algebraic aggregate functions.
Measures: Their Categorization and Computation A holistic measure is a measure that must be computed on the entire data set as a whole. It cannot be computed by partitioning the given data into subsets and merging the values obtained for the measure in each subset. Common examples of holistic functions include median(), mode(), and rank().
Measures: Their Categorization and Computation Suppose that the relational database schema of All. Electronics is the following: time(time key, day of week, month, quarter, year) item(item key, item name, brand, type, supplier type) branch(branch key, branch name, branch type) location(location key, street, city, province or state, country) sales(time key, item key, branch key, location key, number of units sold, price) The DMQL specification is translated into the following SQL query, which generates the required sales star cube. select s. time key, s. item key, s. branch key, s. location key, sum(s. number of units sold s. price), sum(s. number of units sold) from time t, item i, branch b, location l, sales s where s. time key = t. time key and s. item key = i. item key and s. branch key = b. branch key and s. location key = l. location key group by s. time key, s. item key, s. branch key, s. location key
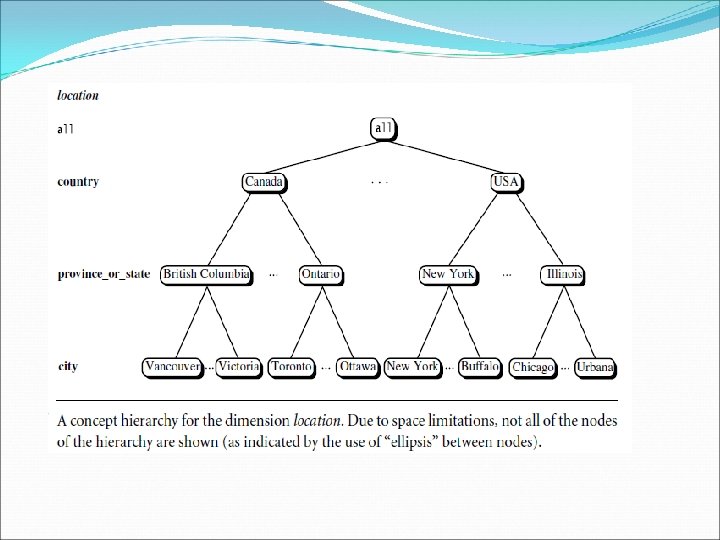
Concept Hierarchies A concept hierarchy defines a sequence of mappings from a set of low-level concepts to higher-level, more general concepts. Consider a concept hierarchy for the dimension location. City values for location include Toronto, New. York, and Chicago. Each city, however, can be mapped to the province or state to which it belongs. For example, Chicago can be mapped to Illinois. The provinces and states can in turn be mapped to the country to which they belong, such as Canada or the USA. These mappings form a concept hierarchy for the dimension location, mapping a set of low-level concepts (i. e. , cities) to higher-level, more general concepts (i. e. , countries).
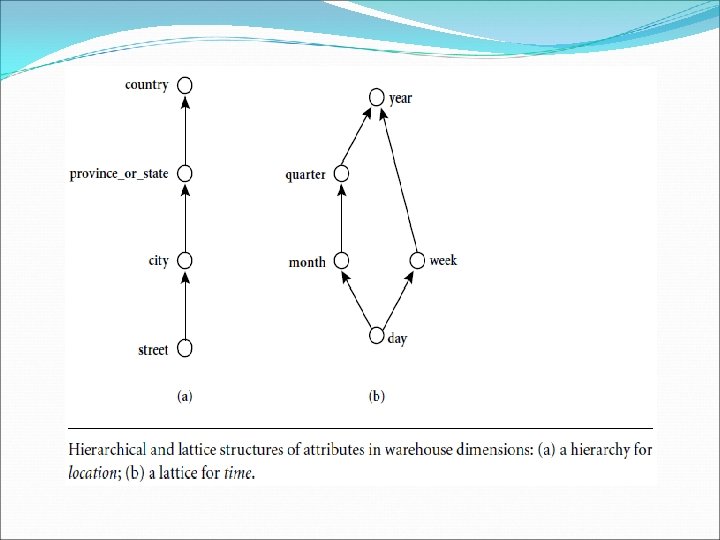
Concept Hierarchies Many concept hierarchies are implicit within the database schema. For example, suppose that the dimension location is described by the attributes number, street, city, province or state, zipcode, and country. These attributes are related by a total order, forming a concept hierarchy such as “street < city < province or state < country”. Alternatively, the attributes of a dimension may be organized in a partial order, forming a lattice. An example of a partial order for the time dimension based on the attributes day, week, month, quarter, and year “day < {month <quarter; week}< year”.
Concept Hierarchies There may be more than one concept hierarchy for a given attribute or dimension, based on different user viewpoints. Concept hierarchies may be provided manually by system users, domain experts, or knowledge engineers, or may be automatically generated based on statistical analysis of the data distribution. Concept hierarchies allow data to be handled at varying levels of abstraction
OLAP Operations in the Multidimensional Data Model In the multidimensional model, data are organized into multiple dimensions. Each dimension contains multiple levels of abstraction defined by concept hierarchies. This organization provides users with the flexibility to view data from different perspectives. A number of OLAP data cube operations exist to materialize these different views. Hence, OLAP provides a user-friendly environment for interactive data analysis.
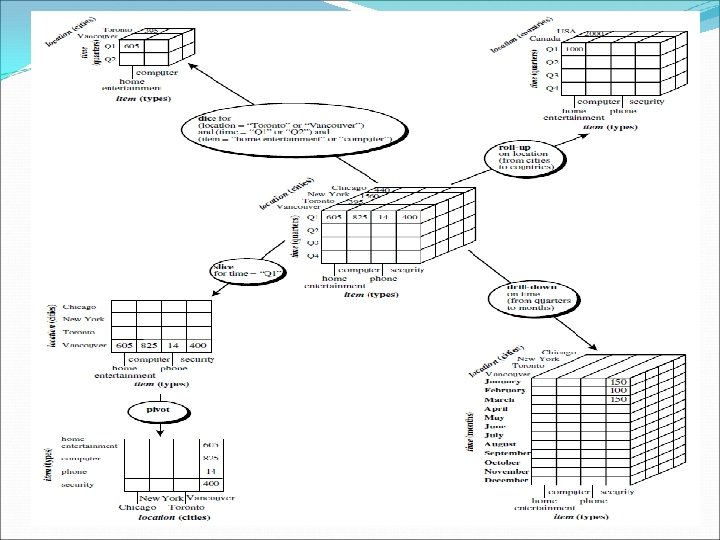
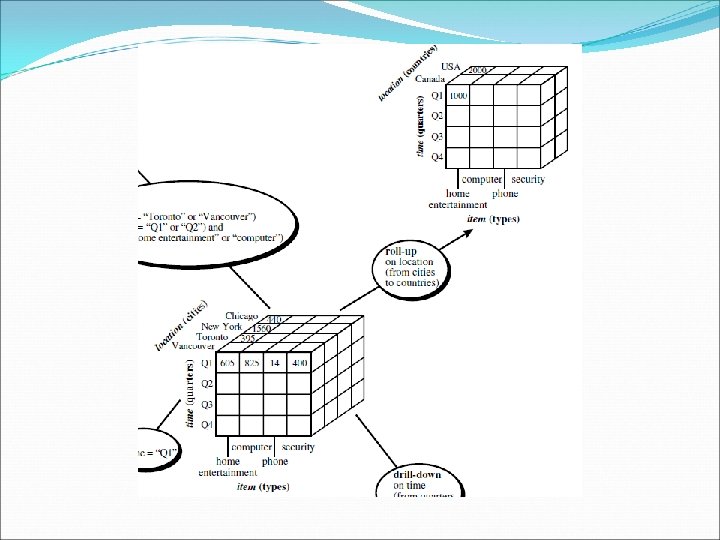
OLAP Operations in the Multidimensional Data Model Roll-up: (also called the drill-up operation by some vendors) The roll-up operation performs aggregation on a data cube, either by climbing up a concept hierarchy for a dimension or by dimension reduction. When roll-up is performed by dimension reduction, one or more dimensions are removed from the given cube. For example, consider a sales data cube containing only the two dimensions location and time. Roll-up may be performed by removing, say, the time dimension, resulting in an aggregation of the total sales by location, rather than by location and by time.
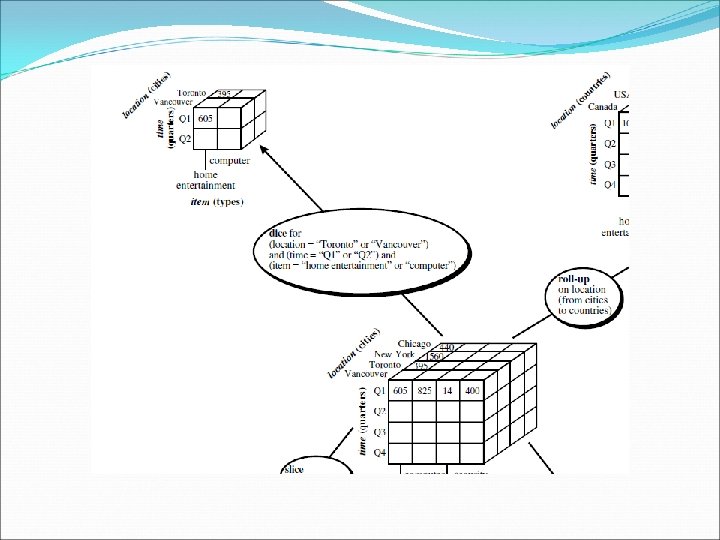
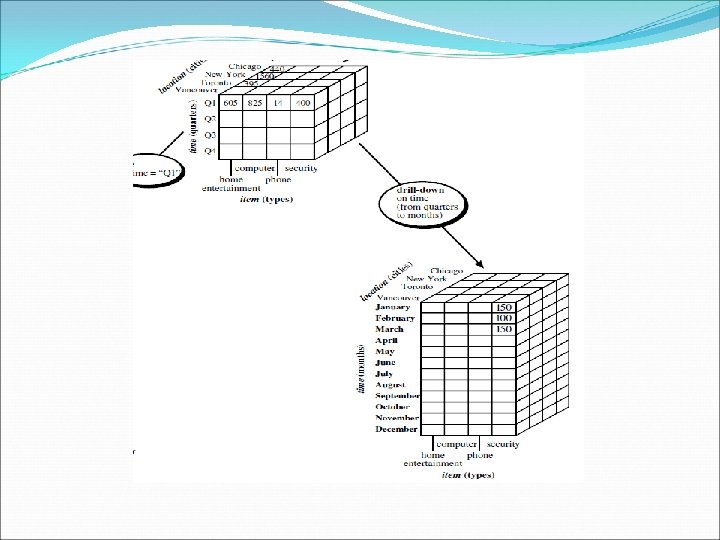
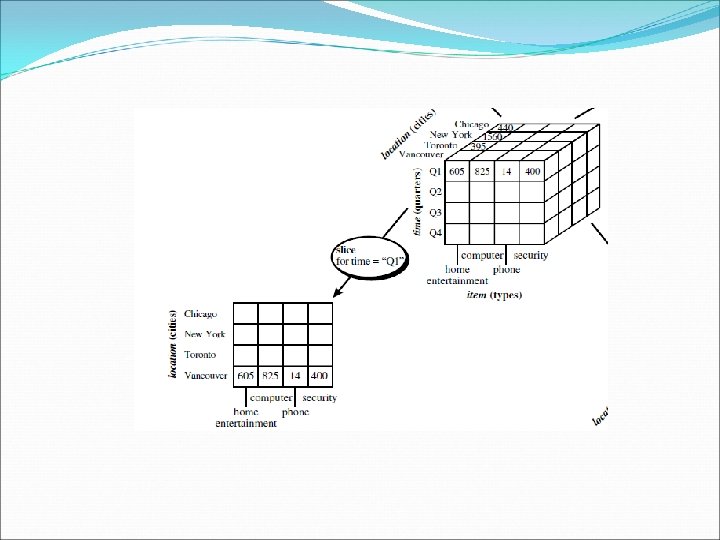
OLAP Operations in the Multidimensional Data Model Drill-down: Drill-down is the reverse of roll-up. It navigates from less detailed data to more detailed data. Drill-down can be realized by either stepping down a concept hierarchy for a dimension or introducing additional dimensions. Slice and dice: The slice operation performs a selection on one dimension of the given cube, resulting in a sub-cube. The dice operation defines a subcube by performing a selection on two or more dimensions.
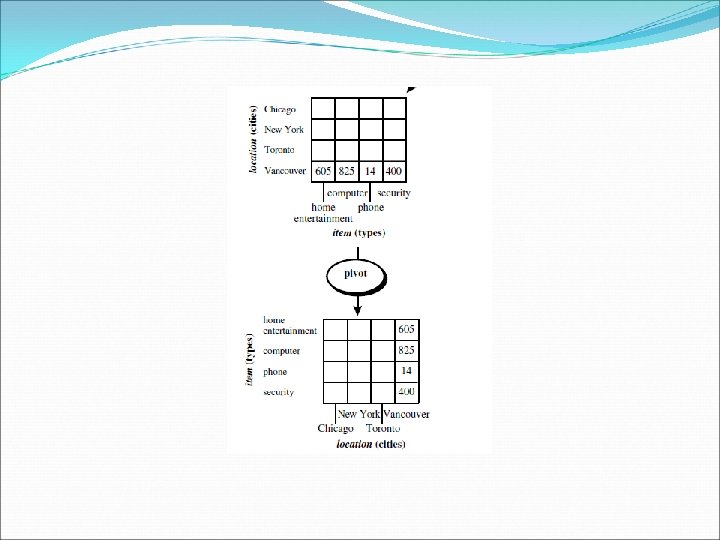
OLAP Operations in the Multidimensional Data Model Pivot (rotate): Pivot (also called rotate) is a visualization operation that rotates the data axes in view in order to provide an alternative presentation of the data.